


 |
市場調查報告書
商品編碼
1858879
發電用蒸汽渦輪機市場機會、成長促進因素、產業趨勢分析及預測(2025-2034年)Power Generation Steam Turbine Market Opportunity, Growth Drivers, Industry Trend Analysis, and Forecast 2025 - 2034 |
||||||
2024 年全球發電蒸汽渦輪機市場價值為 10.4 億美元,預計到 2034 年將以 23.9% 的複合年成長率成長至 29.2 億美元。
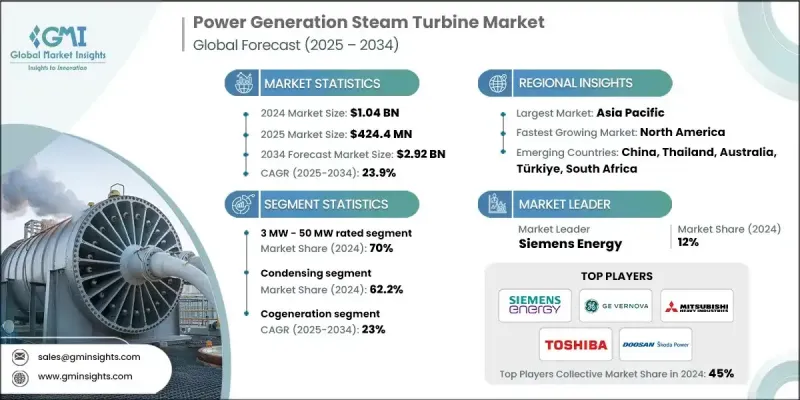
這一顯著成長主要受工業活動擴張和對可靠、不間斷電力日益成長的需求所驅動,從而加速了對自備發電的需求。隨著工業規模的擴大,對穩定能源的需求也隨之增加,促使高效蒸汽渦輪機系統得到廣泛應用。工業界逐步向聯合循環配置轉型,以及對老舊火力發電裝置的依賴下降,持續重塑市場格局。用於發電的蒸汽渦輪機將蒸汽的熱能轉換為機械能,然後將機械能轉換為電能。在政府支持減排政策以及對熱電聯產和混合能源模式投資不斷增加的背景下,市場前景仍然十分樂觀。基礎設施建設的不斷改進以及為平衡電力供需所做的努力,進一步推動了對這些系統的需求。許多發展中經濟體正在向天然氣和再生能源發電進行顯著轉型,這提升了蒸汽渦輪機在混合能源系統中的作用,並促進了其在多個地區的廣泛應用。
| 市場範圍 | |
|---|---|
| 起始年份 | 2024 |
| 預測年份 | 2025-2034 |
| 起始值 | 10.4億美元 |
| 預測值 | 29.2億美元 |
| 複合年成長率 | 23.9% |
預計2034年,3兆瓦蒸汽渦輪機市場規模將達2.8億美元。這些汽輪機結構緊湊,是工業場所、離網地區以及熱電聯產解決方案的高效電源。製造商正在推出模組化汽輪機配置,以簡化安裝、降低複雜性並減少維護。這些特性使其在農村地區和基礎設施低度開發地區尤其具有吸引力,因為在這些地區,易於部署至關重要。
2024年,非凝汽式汽輪機市場規模達6.487億美元。該領域受益於工業技術的快速升級和以提高能源效率為重點的政策舉措。公共和私人機構都在積極推動採用能夠降低熱損失並提供必要工藝蒸汽的汽輪機。這些汽輪機是熱電聯產應用的核心設備,可同時生產電力和熱能。其高效性使其適用於重型工業作業。隨著材料、葉片設計和熱力學過程的改進,非凝汽式汽輪機如今具有更高的耐久性和更低的維護需求,從而提高了全生命週期經濟性和整體效率。
預計到2034年,北美發電用蒸汽渦輪機市場規模將達1.65億美元。該地區的成長主要得益於各行業熱電聯產系統應用的不斷擴大。然而,由於許多國家正在逐步淘汰燃煤電廠,轉而採用更清潔的能源,傳統蒸汽渦輪機在火力發電廠的應用可能會放緩,從而形成一個複雜的成長模式。
活躍於全球發電蒸汽渦輪機市場的關鍵企業包括住友重工、Triveni Turbine、三菱重工、Turbotech Precision Engineering、MAN Energy Solutions、西門子能源、荏原株式會社、Trillium Flow Technologies、富士電機、杭州汽輪機動力集團、GE Vernova、川崎重、川崎重、川崎重工、日本重工解決方案Industries、安薩爾多能源、Bharat Heavy Electricals 和 Chola Turbo。為了鞏固市場地位,發電蒸汽渦輪機市場的企業正致力於策略創新和全球合作。關鍵措施包括加大研發投入,開發能夠在各種負載條件和環境標準下高效運作的汽輪機。企業也正在提升服務能力,提供包括安裝、數位化監控和預測性維護在內的端到端支援。多家企業正透過合資企業共同開發結合再生能源和火力發電的混合系統。
目錄
第1章:方法論與範圍
第2章:執行概要
第3章:行業洞察
- 產業生態系分析
- 原物料供應及採購分析
- 製造能力評估
- 供應鏈韌性與風險因素
- 配電網路分析
- 監管環境
- 產業影響因素
- 成長促進因素
- 產業陷阱與挑戰
- 成長潛力分析
- 波特的分析
- PESTEL 分析
- 發電用蒸汽渦輪機的成本結構分析
- 價格趨勢分析(美元/兆瓦)
- 按地區
- 按產能
- 新興機會與趨勢
- 數位化與物聯網整合
- 新興市場滲透
- 投資分析及未來展望
第4章:競爭格局
- 介紹
- 按地區分類的公司市佔率分析
- 北美洲
- 歐洲
- 亞太地區
- 中東和非洲
- 拉丁美洲
- 戰略儀錶板
- 策略舉措
- 重要夥伴關係與合作
- 主要併購活動
- 產品創新與發布
- 市場擴張策略
- 競爭性標竿分析
- 創新與永續發展格局
第5章:市場規模及預測:依設計類型分類,2021-2034年
- 主要趨勢
- 反應
- 衝動
第6章:市場規模及預測:依廢氣排放分類,2021-2034年
- 主要趨勢
- 冷凝
- 非冷凝式
第7章:市場規模及預測:依燃料類型分類,2021-2034年
- 主要趨勢
- 石油和天然氣
- 垃圾焚化發電廠
- 生質能
第8章:市場規模及預測:依產能分類,2021-2034年
- 主要趨勢
- 小於 3 兆瓦
- 3兆瓦 - 50兆瓦
- 50兆瓦 - 100兆瓦
第9章:市場規模及預測:依技術分類,2021-2034年
- 主要趨勢
- 蒸汽循環
- 複合循環
- 熱電聯產
第10章:市場規模及預測:依地區分類,2021-2034年
- 主要趨勢
- 北美洲
- 美國
- 加拿大
- 墨西哥
- 歐洲
- 英國
- 法國
- 俄羅斯
- 德國
- 西班牙
- 義大利
- 亞太地區
- 中國
- 日本
- 韓國
- 印度
- 澳洲
- 印尼
- 馬來西亞
- 泰國
- 中東和非洲
- 沙烏地阿拉伯
- 阿拉伯聯合大公國
- 伊朗
- 埃及
- 南非
- 奈及利亞
- 土耳其
- 摩洛哥
- 拉丁美洲
- 巴西
- 阿根廷
- 智利
第11章:公司簡介
- Ansaldo Energia
- Bharat Heavy Electricals Limited
- Chart Industries
- Chola Turbo
- Doosan Škoda Power
- EBARA CORPORATION
- Fuji Electric
- GE Vernova
- Hangzhou Turbine Power Group
- Kawasaki Heavy Industries
- MAN Energy Solutions
- Mitsubishi Heavy Industries
- NCON Turbo Tech
- Shin Nippon Machinery
- Siemens Energy
- Sumitomo Heavy Industries
- Toshiba Energy Systems & Solutions Corporation
- Trillium Flow Technologies
- Triveni Turbine
- Turbotech Precision Engineering
The Global Power Generation Steam Turbine Market was valued at USD 1.04 billion in 2024 and is estimated to grow at a CAGR of 23.9% to reach USD 2.92 billion by 2034.
This substantial growth is driven by expanding industrial activities and the growing need for reliable, uninterrupted electricity, which is accelerating demand for captive power generation. As industries scale up, they require stable energy sources, encouraging the adoption of efficient steam turbine systems. A gradual industry shift toward combined cycle configurations, along with the declining reliance on outdated thermal power units, continues to reshape the market. Steam turbines used in power generation convert the thermal energy of steam into mechanical energy, which is then transformed into electricity. With supportive government policies targeting emissions reduction, alongside increasing investments in cogeneration and hybrid energy models, the market outlook remains highly favorable. Rising infrastructure development and efforts to balance electricity demand and supply further contribute to the demand for these systems. Many developing economies are making notable transitions toward gas-based and renewable power generation, enhancing the role of steam turbines within hybrid setups and contributing to their expanding application across multiple regions.
| Market Scope | |
|---|---|
| Start Year | 2024 |
| Forecast Year | 2025-2034 |
| Start Value | $1.04 Billion |
| Forecast Value | $2.92 Billion |
| CAGR | 23.9% |
The segment featuring 3 MW steam turbines is forecast to reach USD 280 million by 2034. These turbines are compact and serve as efficient power sources for industrial sites, off-grid locations, and combined heat and power solutions. Manufacturers are introducing modular turbine configurations that streamline installation, reduce complexity, and cut down on maintenance. These features make them particularly attractive in rural zones and regions with developing infrastructure, where ease of deployment is crucial.
In 2024, the non-condensing steam turbine segment was valued at USD 648.7 million. This category benefits from rapid industrial upgrades and policy-led efforts focused on energy efficiency. Both public and private initiatives are pushing the adoption of steam turbines that lower thermal losses while delivering essential process steam. These turbines are central to combined heat and power applications, which produce both electricity and thermal energy. Their efficiency makes them suitable for heavy-duty industrial operations. With improvements in materials, blade design, and thermodynamic processes, non-condensing turbines now offer better durability and lower maintenance requirements, improving lifecycle economics and overall efficiency.
North America Power Generation Steam Turbine Market is projected to reach USD 165 million by 2034. Growth in this region is primarily fueled by expanding use of cogeneration systems across industries. However, conventional steam turbine deployment in thermal plants may see a slowdown, as many nations are phasing out coal-fired facilities in favor of cleaner alternatives, creating a mixed landscape for growth.
Key companies actively operating in the Global Power Generation Steam Turbine Market include Sumitomo Heavy Industries, Triveni Turbine, Mitsubishi Heavy Industries, Turbotech Precision Engineering, MAN Energy Solutions, Siemens Energy, EBARA CORPORATION, Trillium Flow Technologies, Fuji Electric, Hangzhou Turbine Power Group, GE Vernova, Kawasaki Heavy Industries, NCON Turbo Tech, Doosan Skoda Power, Toshiba Energy Systems & Solutions Corporation, Shin Nippon Machinery, Chart Industries, Ansaldo Energia, Bharat Heavy Electricals, and Chola Turbo. To strengthen their presence, companies in the power generation steam turbine market are focusing on strategic innovation and global partnerships. Key approaches include expanding R&D to develop turbines that operate efficiently under varied load conditions and environmental standards. Firms are also enhancing their service capabilities, offering end-to-end support including installation, digital monitoring, and predictive maintenance. Several players are entering joint ventures to co-develop hybrid systems combining renewable and thermal power generation.
Table of Contents
Chapter 1 Methodology & Scope
- 1.1 Research design
- 1.1.1 Research approach
- 1.1.2 Data collection methods
- 1.2 Base estimates and calculations
- 1.2.1 Base year calculation
- 1.2.2 Market estimates & forecast parameters
- 1.3 Forecast model
- 1.3.1 Key trends for market estimates
- 1.3.2 Quantified market impact analysis
- 1.3.2.1 Mathematical impact of growth parameters on forecast
- 1.3.3 Scenario analysis framework
- 1.4 Primary research and validation
- 1.4.1 Some of the primary sources (but not limited to)
- 1.5 Data mining sources
- 1.5.1 Paid Sources
- 1.5.2 Sources, by region
- 1.6 Research trail & scoring components
- 1.6.1 Research trail components
- 1.6.2 Scoring components
- 1.7 Research transparency addendum
- 1.7.1 Source attribution framework
- 1.7.2 Quality assurance metrics
- 1.7.3 Our commitment to trust
- 1.8 Market definitions
Chapter 2 Executive Summary
- 2.1 Industry synopsis, 2021 - 2034
- 2.1.1 Business trends
- 2.1.2 Design trends
- 2.1.3 Exhaust trends
- 2.1.4 Fuel trends
- 2.1.5 Capacity trends
- 2.1.6 Technology trends
- 2.1.7 Regional trends
Chapter 3 Industry Insights
- 3.1 Industry ecosystem analysis
- 3.1.1 Raw material availability & sourcing analysis
- 3.1.2 Manufacturing capacity assessment
- 3.1.3 Supply chain resilience & risk factors
- 3.1.4 Distribution network analysis
- 3.2 Regulatory landscape
- 3.3 Industry impact forces
- 3.3.1 Growth drivers
- 3.3.2 Industry pitfalls & challenges
- 3.4 Growth potential analysis
- 3.5 Porter's analysis
- 3.5.1 Bargaining power of suppliers
- 3.5.2 Bargaining power of buyers
- 3.5.3 Threat of new entrants
- 3.5.4 Threat of substitutes
- 3.6 PESTEL analysis
- 3.6.1 Political factors
- 3.6.2 Economic factors
- 3.6.3 Social factors
- 3.6.4 Technological factors
- 3.6.5 Legal factors
- 3.6.6 Environmental factors
- 3.7 Cost structure analysis of power generation steam turbines
- 3.8 Price trend analysis (USD/MW)
- 3.8.1 By region
- 3.8.2 By capacity
- 3.9 Emerging opportunities & trends
- 3.9.1 Digitalization & IoT integration
- 3.9.2 Emerging market penetration
- 3.10 Investment analysis & future prospects
Chapter 4 Competitive Landscape, 2025
- 4.1 Introduction
- 4.2 Company market share analysis, by region, 2024
- 4.2.1 North America
- 4.2.2 Europe
- 4.2.3 Asia Pacific
- 4.2.4 Middle East & Africa
- 4.2.5 Latin America
- 4.3 Strategic dashboard
- 4.4 Strategic initiatives
- 4.4.1 Key partnerships & collaborations
- 4.4.2 Major M&A activities
- 4.4.3 Product innovations & launches
- 4.4.4 Market expansion strategies
- 4.5 Competitive benchmarking
- 4.6 Innovation & sustainability landscape
Chapter 5 Market Size and Forecast, By Design, 2021 - 2034 (USD Million & MW)
- 5.1 Key trends
- 5.2 Reaction
- 5.3 Impulse
Chapter 6 Market Size and Forecast, By Exhaust, 2021 - 2034 (USD Million & MW)
- 6.1 Key trends
- 6.2 Condensing
- 6.3 Non-condensing
Chapter 7 Market Size and Forecast, By Fuel, 2021 - 2034 (USD Million & MW)
- 7.1 Key trends
- 7.2 Oil & gas
- 7.3 Waste-to-energy plants
- 7.4 Biomass
Chapter 8 Market Size and Forecast, By Capacity, 2021 - 2034 (USD Million & MW)
- 8.1 Key trends
- 8.2 < 3 MW
- 8.3 3 MW - 50 MW
- 8.4 > 50 MW - 100 MW
Chapter 9 Market Size and Forecast, By Technology, 2021 - 2034 (USD Million & MW)
- 9.1 Key trends
- 9.2 Steam cycle
- 9.3 Combined cycle
- 9.4 Cogeneration
Chapter 10 Market Size and Forecast, By Region, 2021 - 2034 (USD Million & MW)
- 10.1 Key trends
- 10.2 North America
- 10.2.1 U.S.
- 10.2.2 Canada
- 10.2.3 Mexico
- 10.3 Europe
- 10.3.1 UK
- 10.3.2 France
- 10.3.3 Russia
- 10.3.4 Germany
- 10.3.5 Spain
- 10.3.6 Italy
- 10.4 Asia Pacific
- 10.4.1 China
- 10.4.2 Japan
- 10.4.3 South Korea
- 10.4.4 India
- 10.4.5 Australia
- 10.4.6 Indonesia
- 10.4.7 Malaysia
- 10.4.8 Thailand
- 10.5 Middle East & Africa
- 10.5.1 Saudi Arabia
- 10.5.2 UAE
- 10.5.3 Iran
- 10.5.4 Egypt
- 10.5.5 South Africa
- 10.5.6 Nigeria
- 10.5.7 Turkiye
- 10.5.8 Morocco
- 10.6 Latin America
- 10.6.1 Brazil
- 10.6.2 Argentina
- 10.6.3 Chile
Chapter 11 Company Profiles
- 11.1 Ansaldo Energia
- 11.2 Bharat Heavy Electricals Limited
- 11.3 Chart Industries
- 11.4 Chola Turbo
- 11.5 Doosan Škoda Power
- 11.6 EBARA CORPORATION
- 11.7 Fuji Electric
- 11.8 GE Vernova
- 11.9 Hangzhou Turbine Power Group
- 11.10 Kawasaki Heavy Industries
- 11.11 MAN Energy Solutions
- 11.12 Mitsubishi Heavy Industries
- 11.13 NCON Turbo Tech
- 11.14 Shin Nippon Machinery
- 11.15 Siemens Energy
- 11.16 Sumitomo Heavy Industries
- 11.17 Toshiba Energy Systems & Solutions Corporation
- 11.18 Trillium Flow Technologies
- 11.19 Triveni Turbine
- 11.20 Turbotech Precision Engineering
 工業蒸氣渦輪市場:依燃料類型、配置、運轉模式及應用分類-2026-2032年全球市場預測
 多級蒸氣渦輪(高達 5000kW)市場規模、佔有率、成長和全球產業分析:按類型、應用和地區分類的見解,以及 2026-2034 年的預測。蒸氣渦輪市場:按類型、級數和應用分類-2026-2032年全球預測
 2026年全球蒸氣渦輪售後市場報告
 蒸汽輪機工業蒸氣加濕器市場按產品類型、最終用戶產業、工作壓力、安裝方式和分銷管道分類,全球預測(2026-2032年)工業電阻式蒸氣加濕器市場:依終端用戶產業、容量範圍、控制方式、通路和維護類型分類,全球預測(2026-2032年)全球蒸氣渦輪服務市場規模、佔有率、趨勢和成長分析報告(2026-2034年)2026年全球蒸氣渦輪市場報告
 全球蒸汽渦輪機市場:依技術、設計、排氣系統、應用、燃料和地區劃分-市場規模、產業動態、機會分析和預測(2026-2035 年)