


 |
市場調查報告書
商品編碼
1892793
汽車微型馬達市場機會、成長促進因素、產業趨勢分析及預測(2026-2035年)Automotive Micro Motors Market Opportunity, Growth Drivers, Industry Trend Analysis, and Forecast 2026 - 2035 |
||||||
2025年全球汽車微型馬達市場價值為177億美元,預計2035年將以4.1%的複合年成長率成長至264億美元。
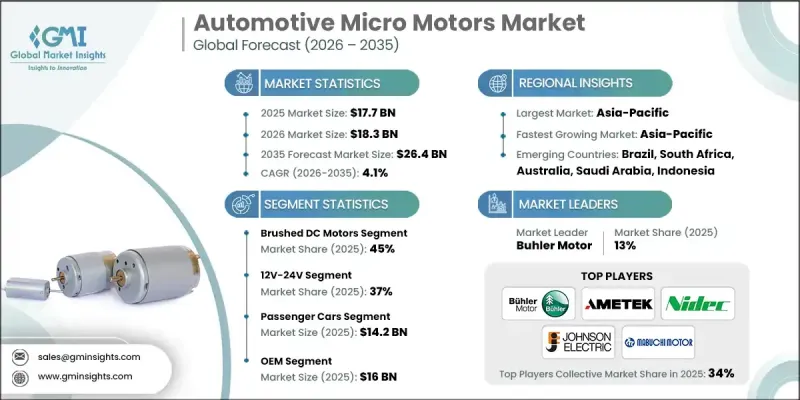
電機技術的進步、生產方式的變革以及行業需求的演變正在重塑微型電機的設計和製造方式。從有刷直流馬達到無刷直流(BLDC)馬達的轉變代表著重大的技術變革,其驅動力在於BLDC系統更高的效率、更長的使用壽命和更低的維護需求。隨著半導體成本的下降和大規模生產的增加,BLDC馬達在汽車應用中的成本效益日益凸顯。全球電機生產商不斷擴大的產能進一步提高了產品的可用性,並降低了整體生產成本,從而促進了先進電機技術在汽車行業的廣泛應用。
| 市場範圍 | |
|---|---|
| 起始年份 | 2025 |
| 預測年份 | 2026-2035 |
| 起始值 | 177億美元 |
| 預測值 | 264億美元 |
| 複合年成長率 | 4.1% |
包括NIDEC、Johnson Electric和Buhler Motor在內的多家領先的無刷直流馬達製造商已提高產能,以滿足汽車製造商日益成長的需求。這包括建立專門用於供應汽車應用微型馬達的額外工廠,從而強化了產業向新型電機技術的轉型。
2025年,有刷直流馬達市佔率佔比45%,預計2026年至2035年將以3.2%的複合年成長率成長。這些馬達仍然廣泛應用於各種汽車零件,包括車窗系統、後視鏡定位和座椅機構,尤其是在對成本較為敏感的車型類別中。然而,其機械換向方式存在固有的性能限制。
12V-24V馬達類別在2025年佔據37%的市場佔有率,預計到2035年將以3.5%的複合年成長率成長。此電壓範圍仍是汽車微型馬達應用中最常用的電壓範圍,支援電動車窗、座椅調整、天窗和基本鼓風機系統等功能。這些馬達的標準工作電壓仍然是12V和24V。
預計2025年,中國汽車微型馬達市場規模將達到46億美元。中國作為全球最大的汽車製造中心,人口成長、汽車保有量增加以及旨在加速汽車電氣化的扶持政策,共同推動了該地區微型馬達市場的強勁需求。
活躍於全球汽車微型馬達市場的公司包括AMETEK、Mabuchi Motor、Johnson Electric、Maxon Motors、NIDEC、Buhler Motor和Mitsuba。這些公司正透過策略性地擴大生產規模、提昇技術水準和豐富產品線來鞏固其競爭優勢。許多製造商正在擴大生產規模以滿足全球汽車OEM廠商日益成長的需求,同時投資自動化以提高產品品質並降低成本。對無刷直流馬達(BLDC馬達)研發的重視使各公司能夠順應產業趨勢,追求更高的效率和更長的使用壽命。此外,各公司還與汽車供應商建立合作關係,將馬達整合到更廣泛的車輛功能中。
目錄
第1章:方法論與範圍
第2章:執行概要
第3章:行業洞察
- 產業生態系分析
- 供應商格局
- 零件製造商
- 電機製造商和整合商
- 原始設備製造商和汽車製造商
- 售後市場通路
- 終端用戶和服務網路
- 成本結構
- 利潤率
- 每個階段的價值增加
- 垂直整合趨勢
- 顛覆者
- 供應商格局
- 對力的影響
- 成長促進因素
- 汽車電氣化和動力系統轉型日益普及
- 舒適便利功能的普及
- 整合先進安全系統和ADAS
- 嚴格的排放和燃油經濟法規
- 產業陷阱與挑戰
- 從有刷直流電機過渡到無刷直流電機
- 模組化和系統整合
- 市場機遇
- 人工智慧與預測導航
- 智慧型手機和應用程式投影系統
- 成長促進因素
- 技術趨勢與創新生態系統
- 目前技術
- 有刷直流馬達與無刷直流馬達技術
- 伺服馬達和步進馬達技術進步
- 線性執行器整合趨勢
- 無磁無稀土馬達研發
- 新興技術
- 數位孿生架構及實現
- 雲端運算與邊緣運算的權衡
- 空中下載 (OTA) 更新
- 韌體更新功能
- 目前技術
- 成長潛力分析
- 監管環境
- SAE國際標準
- 聯合國歐洲經濟委員會WP.29條例
- 監理合規成本分析
- 監理路線圖及未來要求
- 區域監管比較
- 北美洲
- 歐洲
- 亞太
- 拉丁美洲
- 中東和非洲
- 波特的分析
- PESTEL 分析
- 成本細分分析
- 價格趨勢
- 價格套利機會
- 價格侵蝕趨勢與商品化
- 原物料價格趨勢的影響
- 平均售價(ASP)趨勢
- 風險評估與緩解策略
- 風險識別與分類
- 合規與監理風險
- 技術與創新風險
- 風險緩解策略
- 專利分析
- 按地區分類的專利申請
- 專利授權率和時間表
- 技術專利分析
- 專利格局圖
- 產品線及研發路線圖
- 產品開發流程分析
- 主要參與者的技術路線圖
- 研發重點領域及投資重點
- 合作研發計劃
- 永續性和環境方面
- 導航系統的碳足跡
- 循環經濟戰略
- 永續導航功能
- 企業永續發展舉措
- 氣候變遷對航行的影響
- 市場採納與滲透分析
- 技術採納曲線分析
- 各區域的滲透率
- 按車輛細分市場分類的滲透率
- 功能採納分析
- 採用加速策略
- 客戶和最終用戶洞察
- 資格和認證要求
- OEM客戶細分
- OEM痛點與未滿足的需求
- 一級供應商客戶分析
- 情境規劃與敏感度分析
- 情境規劃框架
- 基本狀況
- 監管影響敏感性
- 新進入者和商業模式
- 監管影響敏感性
第4章:競爭格局
- 介紹
- 公司市佔率分析
- 北美洲
- 歐洲
- 亞太
- 拉丁美洲
- 中東和非洲
- 競爭定位矩陣
- 戰略展望矩陣
- 關鍵進展
- 併購
- 合作夥伴關係與合作
- 新產品發布
- 擴張計劃和資金
- 高階定位策略
- 競爭分析與獨特賣點
第5章:市場估算與預測:依汽車類型分類,2022-2035年
- 有刷直流電機
- 無刷直流電機
- 步進馬達
第6章:市場估算與預測:依電力消耗量分類,2022-2035年
- 3V-12V
- 12V-24V
- 25V-48V
- 超過48伏
第7章:市場估價與預測:依車輛類型分類,2022-2035年
- 搭乘用車
- SUV
- 轎車
- 掀背車
- 商用車輛
- 低容量性狀
- MCV
- C型肝炎
第8章:市場估算與預測:依應用領域分類,2022-2035年
- 電源視窗
- 擋風玻璃雨刷
- 電動輔助轉向(EPS)
- 座椅調節
- 後視鏡調整
- 天窗執行器
- 暖通空調系統
- 其他
第9章:市場估算與預測:依銷售管道分類,2022-2035年
- OEM
- 售後市場
第10章:市場估計與預測:依地區分類,2022-2035年
- 北美洲
- 美國
- 加拿大
- 歐洲
- 英國
- 德國
- 法國
- 義大利
- 西班牙
- 比利時
- 荷蘭
- 瑞典
- 俄羅斯
- 亞太地區
- 中國
- 印度
- 日本
- 澳洲
- 新加坡
- 韓國
- 越南
- 印尼
- 拉丁美洲
- 巴西
- 墨西哥
- 阿根廷
- MEA
- 南非
- 沙烏地阿拉伯
- 阿拉伯聯合大公國
第11章:公司簡介
- 全球參與者
- Continental
- Denso
- Garmin
- HARMAN International
- Hyundai Mobis
- Mitsubishi Electric
- Panasonic
- Robert Bosch
- Region players
- Alpine Electronics
- Clarion
- Desay SV Automotive
- JVCKENWOOD
- LG Electronics
- Marelli
- Pioneer
- Valeo
- Visteon
- 新興玩家
- Aisin Corporation
- Dynavin
- Luxoft
- NNG Software
- Preh Car Connect
- Vinland
The Global Automotive Micro Motors Market was valued at USD 17.7 billion in 2025 and is estimated to grow at a CAGR of 4.1% to reach USD 26.4 billion by 2035.
Advancements in motor technology, changing production methods, and evolving industry requirements are reshaping the way micro motors are designed and manufactured. The shift from brushed DC motors to brushless DC (BLDC) motors represents a major technological transition, driven by the improved efficiency, longer lifespan, and reduced maintenance needs of BLDC systems. As semiconductor costs decline and large-scale production increases, BLDC motors are becoming more cost-effective for automotive applications. Expanding manufacturing capacity across global motor producers is further enhancing availability and lowering overall production expenses, supporting broader adoption of advanced motor technologies throughout the automotive sector.
| Market Scope | |
|---|---|
| Start Year | 2025 |
| Forecast Year | 2026-2035 |
| Start Value | $17.7 Billion |
| Forecast Value | $26.4 Billion |
| CAGR | 4.1% |
Multiple leading BLDC motor manufacturers, including NIDEC, Johnson Electric, and Buhler Motor, have increased their production capabilities to meet rising demand from automakers. This includes the establishment of additional facilities dedicated to supplying micro motors for automotive applications, reinforcing the industry's transition toward newer motor technologies.
The brushed DC motors segment accounted for a 45% share in 2025 and is forecasted to grow at a CAGR of 3.2% from 2026 to 2035. These motors remain widely used in various vehicle components, including window systems, mirror positioning, and seating mechanisms, especially within cost-sensitive vehicle categories. However, their mechanical commutation creates inherent performance limitations.
The 12V-24V motor category held a 37% share in 2025 and is projected to grow at a CAGR of 3.5% through 2035. This voltage range remains the most common for automotive micro motor applications, supporting functions such as power windows, seat adjustments, sunroofs, and basic blower systems. The standard operating voltages for these motors continue to be 12V and 24V.
China Automotive Micro Motors Market generated USD 4.6 billion in 2025. The region benefits from its position as the world's largest vehicle manufacturing hub, coupled with population growth, increasing vehicle ownership, and supportive policies designed to accelerate automotive electrification. These factors drive strong demand for micro motors across various vehicle systems.
Companies active in the Global Automotive Micro Motors Market include AMETEK, Mabuchi Motor, Johnson Electric, Maxon Motors, NIDEC, Buhler Motor, and Mitsuba. Companies in the Automotive Micro Motors Market are reinforcing their competitive position through strategic manufacturing expansion, technology enhancements, and diversified product offerings. Many manufacturers are scaling production facilities to meet rising demand from global automotive OEMs, while also investing in automation to improve quality and reduce cost. Emphasis on BLDC motor development allows companies to align with industry trends favoring higher efficiency and longer-lasting components. Firms are also leveraging partnerships with automotive suppliers to integrate their motors into a broader range of vehicle functions.
Table of Contents
Chapter 1 Methodology & Scope
- 1.1 Research design
- 1.1.1 Research approach
- 1.1.2 Data collection methods
- 1.2 Base estimates and calculations
- 1.2.1 Base year calculation
- 1.2.2 Key trends for market estimates
- 1.3 Forecast
- 1.4 Primary research and validation
- 1.5 Some of the primary sources
- 1.6 Data mining sources
- 1.6.1 Secondary
- 1.6.1.1 Paid Sources
- 1.6.1.2 Public Sources
- 1.6.1.3 Sources, by region
- 1.6.1 Secondary
- 1.7 Inclusion & Exclusion
Chapter 2 Executive Summary
- 2.1 Industry 360° synopsis
- 2.2 Key market trends
- 2.2.1 Regional
- 2.2.2 Motor
- 2.2.3 Power Consumption
- 2.2.4 Vehicle
- 2.2.5 Application
- 2.2.6 Sales Channel
- 2.3 TAM Analysis, 2026-2035
- 2.4 CXO perspectives: Strategic imperatives
- 2.4.1 Key decision points for industry executives
- 2.4.2 Critical success factors for market players
- 2.5 Future outlook and strategic recommendations
Chapter 3 Industry Insights
- 3.1 Industry ecosystem analysis
- 3.1.1 Supplier landscape
- 3.1.1.1 Component manufacturers
- 3.1.1.2 Motor manufacturers & integrators
- 3.1.1.3 OEMs & vehicle manufacturers
- 3.1.1.4 Aftermarket distribution channels
- 3.1.1.5 End use & service networks
- 3.1.2 Cost structure
- 3.1.3 Profit margin
- 3.1.4 Value addition at each stage
- 3.1.5 Vertical integration trends
- 3.1.6 Disruptors
- 3.1.1 Supplier landscape
- 3.2 Impact on forces
- 3.2.1 Growth drivers
- 3.2.1.1 Rising vehicle electrification & powertrain shift
- 3.2.1.2 Proliferation of comfort & convenience features
- 3.2.1.3 Integration of advanced safety & ADAS
- 3.2.1.4 Stringent emission & fuel economy regulations
- 3.2.2 Industry pitfalls & challenges
- 3.2.2.1 Shift from Brushed DC to Brushless DC (BLDC) Motors
- 3.2.2.2 Modularization & system integration
- 3.2.3 Market opportunities
- 3.2.3.1 AI & predictive navigation
- 3.2.3.2 Smartphone & app projection systems
- 3.2.1 Growth drivers
- 3.3 Technology trends & innovation ecosystem
- 3.3.1 Current technologies
- 3.3.1.1 Brushed vs brushless DC motor technologies
- 3.3.1.2 Servo & Stepper motor advancements
- 3.3.1.3 Linear Actuator integration trends
- 3.3.1.4 Magnet-free & rare-earth-free motor development
- 3.3.2 Emerging technologies
- 3.3.2.1 Digital twin architecture & implementation
- 3.3.2.2 Cloud vs Edge processing trade-offs
- 3.3.2.3 Over-the-Air (OTA) updates
- 3.3.2.4 Firmware update capabilities
- 3.3.1 Current technologies
- 3.4 Growth potential analysis
- 3.5 Regulatory landscape
- 3.5.1 SAE international standards
- 3.5.2 UNECE WP.29 regulations
- 3.5.3 Regulatory compliance cost analysis
- 3.5.4 Regulatory roadmap & future requirements
- 3.5.5 Regional regulatory comparison
- 3.5.5.1 North America
- 3.5.5.2 Europe
- 3.5.5.3 Asia-Pacific
- 3.5.5.4 Latin America
- 3.5.5.5 Middle East & Africa
- 3.6 Porter's analysis
- 3.7 PESTEL analysis
- 3.8 Cost breakdown analysis
- 3.9 Price trends
- 3.9.1 Price arbitrage opportunities
- 3.9.2 Price erosion trends & commoditization
- 3.9.3 Impact of raw material price trends
- 3.9.4 Average Selling Price (ASP) Trends
- 3.10 Risk assessment & mitigation strategies
- 3.10.1 Risk identification & classification
- 3.10.2 Compliance & regulatory risks
- 3.10.3 Technology & innovation risks
- 3.10.4 Risk mitigation strategies
- 3.11 Patent analysis
- 3.11.1 Patent filings by region
- 3.11.2 Patent grant rates & timelines
- 3.11.3 Technology-specific patent analysis
- 3.11.4 Patent landscape mapping
- 3.12 Product Pipeline & R&D Roadmap
- 3.12.1 Product development pipeline analysis
- 3.12.2 Technology roadmap by key players
- 3.12.3 R&D focus areas & investment priorities
- 3.12.4 Collaborative R&D initiatives
- 3.13 Sustainability and environmental aspects
- 3.13.1 Carbon footprint of navigation systems
- 3.13.2 Circular economic strategies
- 3.13.3 Sustainable navigation features
- 3.13.4 Corporate sustainability initiatives
- 3.13.5 Climate change impact on navigation
- 3.14 Market adoption & penetration analysis
- 3.14.1 Technology adoption curve analysis
- 3.14.2 Penetration rates by region
- 3.14.3 Penetration rates by vehicle segment
- 3.14.4 Feature adoption analysis
- 3.14.5 Adoption acceleration strategies
- 3.15 Customer & End use insights
- 3.15.1 Qualification & certification requirements
- 3.15.2 OEM customer segmentation
- 3.15.3 OEM pain points & unmet needs
- 3.15.4 Tier-1 supplier customer analysis
- 3.16 Scenario planning & sensitivity analysis
- 3.16.1 Scenario planning framework
- 3.16.2 Base case scenario
- 3.16.3 Regulatory impact sensitivity
- 3.16.4 New entrants & business models
- 3.16.5 Regulatory impact sensitivity
Chapter 4 Competitive Landscape, 2025
- 4.1 Introduction
- 4.2 Company market share analysis
- 4.2.1 North America
- 4.2.2 Europe
- 4.2.3 Asia-Pacific
- 4.2.4 Latin America
- 4.2.5 Middle East & Africa
- 4.3 Competitive positioning matrix
- 4.4 Strategic outlook matrix
- 4.5 Key developments
- 4.5.1 Mergers & acquisitions
- 4.5.2 Partnerships & collaborations
- 4.5.3 New product launches
- 4.5.4 Expansion plans and funding
- 4.6 Premium positioning strategies
- 4.7 Competitive analysis and USPs
Chapter 5 Market Estimates & Forecast, By Motor, 2022 - 2035 ($Bn, Units)
- 5.1 Key trends
- 5.2 Brushed DC Motors
- 5.3 Brushless DC Motors
- 5.4 Stepper Motors
Chapter 6 Market Estimates & Forecast, By Power Consumption, 2022 - 2035 ($Bn, units)
- 6.1 Key trends
- 6.2 3V-12V
- 6.3 12V-24V
- 6.4 25V-48V
- 6.5 More than 48V
Chapter 7 Market Estimates & Forecast, By Vehicle, 2022 - 2035 ($Bn, Units)
- 7.1 Key trends
- 7.2 Passenger Cars
- 7.2.1 SUV
- 7.2.2 Sedan
- 7.2.3 Hatchback
- 7.3 Commercial Vehicles
- 7.3.1 LCV
- 7.3.2 MCV
- 7.3.3 HCV
Chapter 8 Market Estimates & Forecast, By Application, 2022 - 2035 ($Bn, Units)
- 8.1 Key trends
- 8.2 Power Windows
- 8.3 Windshield Wipers
- 8.4 Electric Power Steering (EPS)
- 8.5 Seat Adjustments
- 8.6 Mirror Adjustments
- 8.7 Sunroof Actuators
- 8.8 HVAC Systems
- 8.9 Others
Chapter 9 Market Estimates & Forecast, By Sales Channel, 2022 - 2035 ($Bn, Units)
- 9.1 Key trends
- 9.2 OEM
- 9.3 Aftermarket
Chapter 10 Market Estimates & Forecast, By Region, 2022 - 2035 ($Bn, Units)
- 10.1 North America
- 10.1.1 US
- 10.1.2 Canada
- 10.2 Europe
- 10.2.1 UK
- 10.2.2 Germany
- 10.2.3 France
- 10.2.4 Italy
- 10.2.5 Spain
- 10.2.6 Belgium
- 10.2.7 Netherlands
- 10.2.8 Sweden
- 10.2.9 Russia
- 10.3 Asia Pacific
- 10.3.1 China
- 10.3.2 India
- 10.3.3 Japan
- 10.3.4 Australia
- 10.3.5 Singapore
- 10.3.6 South Korea
- 10.3.7 Vietnam
- 10.3.8 Indonesia
- 10.4 Latin America
- 10.4.1 Brazil
- 10.4.2 Mexico
- 10.4.3 Argentina
- 10.5 MEA
- 10.5.1 South Africa
- 10.5.2 Saudi Arabia
- 10.5.3 UAE
Chapter 11 Company Profiles
- 11.1 Global players
- 11.1.1 Continental
- 11.1.2 Denso
- 11.1.3 Garmin
- 11.1.4 HARMAN International
- 11.1.5 Hyundai Mobis
- 11.1.6 Mitsubishi Electric
- 11.1.7 Panasonic
- 11.1.8 Robert Bosch
- 11.2 Region players
- 11.2.1 Alpine Electronics
- 11.2.2 Clarion
- 11.2.3 Desay SV Automotive
- 11.2.4 JVCKENWOOD
- 11.2.5 LG Electronics
- 11.2.6 Marelli
- 11.2.7 Pioneer
- 11.2.8 Valeo
- 11.2.9 Visteon
- 11.3 Emerging players
- 11.3.1 Aisin Corporation
- 11.3.2 Dynavin
- 11.3.3 Luxoft
- 11.3.4 NNG Software
- 11.3.5 Preh Car Connect
- 11.3.6 Vinland


