

 |
市場調查報告書
商品編碼
1892761
供應鏈視覺化軟體市場機會、成長促進因素、產業趨勢分析及預測(2026-2035年)Supply Chain Visibility Software Market Opportunity, Growth Drivers, Industry Trend Analysis, and Forecast 2026 - 2035 |
||||||
2025 年全球供應鏈視覺化軟體市場價值為 33 億美元,預計到 2035 年將以 13.4% 的複合年成長率成長至 109 億美元。
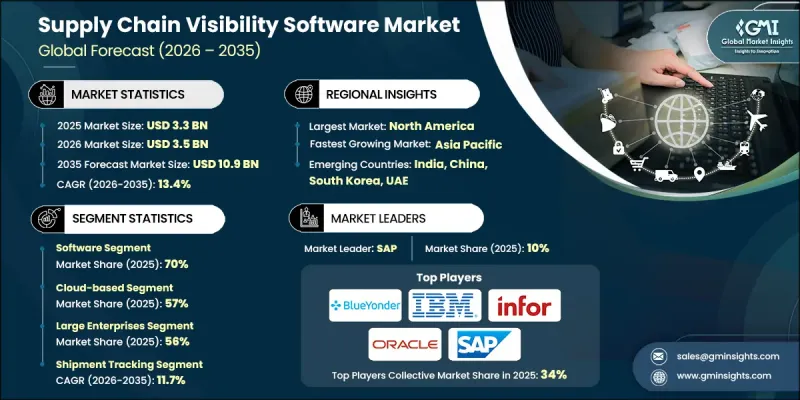
從傳統的人工追蹤方式向雲端原生數位平台的轉變正在推動其廣泛應用。疫情、地緣政治衝突和極端天氣事件等突發事件凸顯了傳統供應鏈的脆弱性,促使企業採用更先進的解決方案。人工智慧、機器學習和物聯網感測器正在實現預測性供應鏈智慧,使企業能夠預測需求、檢測異常情況並有效最佳化路線。區塊鏈和邊緣運算增強了可追溯性和合規性。日益嚴格的法規,包括歐盟的《企業永續發展盡職調查指令》、美國食品藥品監督管理局的《食品安全現代化法案》204、歐盟的《森林砍伐條例》以及《維吾爾族強迫勞動預防法》,正在加速這些技術的普及應用,因為企業力求整合供應商資料、碳核算和基於事件的追蹤,以避免處罰並提高透明度。
| 市場範圍 | |
|---|---|
| 起始年份 | 2025 |
| 預測年份 | 2026-2035 |
| 起始值 | 33億美元 |
| 預測值 | 109億美元 |
| 複合年成長率 | 13.4% |
到 2025 年,軟體領域將佔據 70% 的市場佔有率,預計到 2035 年將以 12.8% 的複合年成長率成長。軟體元件,包括分析儀表板、控制塔應用程式和視覺化平台,對於擷取、處理和顯示供應鏈資料至關重要。
雲端原生SaaS模式支援快速部署、成本效益和持續更新。到2025年,雲端SaaS市佔率將達到57%,預計2026年至2035年將以14.1%的複合年成長率成長。雲端解決方案提供即時存取、更有效率的協作、可擴展性、更低的初始成本以及更輕的IT管理負擔。
2024年,受電子商務擴張、複雜物流網路以及領先企業創新驅動,美國供應鏈視覺化軟體市場佔據了顯著佔有率。美國托運人、承運人和第三方物流供應商正在採用視覺化平台來提高透明度和營運效率。人工智慧驅動的分析和預測洞察在推動這一轉型中起著關鍵作用。諸如《食品安全現代化法案》(FSMA)第204條和《維吾爾族強迫勞動預防法》等監管要求進一步推動了視覺化平台的應用,以確保可追溯性和合規性。
目錄
第1章:方法論
第2章:執行概要
第3章:行業洞察
- 產業生態系分析
- 供應商格局
- 利潤率分析
- 成本結構
- 每個階段的價值增加
- 影響價值鏈的因素
- 中斷
- 產業影響因素
- 成長促進因素
- 供應鏈的數位轉型
- 電子商務的興起和複雜的全球貿易
- 風險管理和供應鏈韌性的必要性
- 監管、合規、永續性和可追溯性要求
- 產業擴張和關鍵產業成長
- 產業陷阱與挑戰
- 高昂的實施和整合成本
- 資料安全和隱私問題
- 市場機遇
- 新興市場的擴張
- 與物聯網和人工智慧技術的整合
- 基於雲端和SaaS的解決方案
- 注重永續性和可追溯性
- 成長促進因素
- 成長潛力分析
- 監管環境
- FDA FSMA 食品可追溯性要求
- 歐盟永續發展法規(CSRD、CSDD、ESPR)
- 數位產品護照(DPP)強制令
- 歐盟森林砍伐法規(EUDR)
- 軟體供應鏈安全(SBOM、NIST SSDF)
- 海關和貿易合規要求
- 資料隱私與主權法規(GDPR、CCPA)
- 產業特定法規(DSCSA、ITAR、HIPAA)
- 波特的分析
- PESTEL 分析
- 技術與創新格局
- 當前技術趨勢
- 控制塔架構演變
- 人工智慧和機器學習在預測分析的應用
- 物聯網與感測器整合(GPS、RFID、遠端資訊處理)
- 區塊鏈實現不可篡改的可追溯性
- 新興技術
- 數位孿生與仿真
- 用於即時處理的邊緣運算
- 供應鏈規劃人員的生成式人工智慧和輔助駕駛系統
- 5G連線和低延遲應用
- 當前技術趨勢
- 定價模型和總擁有成本
- SaaS訂閱定價
- 本地許可和維護
- 混合部署經濟學
- 實施和整合成本
- 整體擁有成本比較:雲端部署 vs 本機部署 vs 混合式部署
- 隱性成本與成本最佳化策略
- 價格趨勢與市場動態
- 專利分析
- 美國專利商標局 CPC 分類概覽(G06Q、G06K)
- 關鍵專利趨勢(2020-2025)
- 預測性可視性和路線最佳化專利
- 區塊鏈與可追溯性智慧財產權格局
- 頂級專利受讓人與創新領導者
- 按地域分類的專利申請趨勢
- 自由實施權考量
- 使用案例和成功故事
- 製造業:汽車一級供應商的可見性
- 零售:全通路庫存可見性
- 食品飲料:FDA FSMA合規實施
- 藥品:序列化與追溯
- 物流:即時運輸可視性
- 時尚:永續性和道德採購可追溯性
- 高科技:緩解零件短缺
- 永續性和環境方面
- 永續實踐
- 減少廢棄物策略
- 生產中的能源效率
- 環保舉措
- 碳足跡考量
- 投資報酬率及商業案例分析
- 可量化的收益和關鍵績效指標
- 物流成本降低(15-30%)
- 庫存最佳化(降低20-30%的庫存持有成本)
- 準時交貨率提升(10-25%)
- 異常管理效率(減少 40-60% 的人工操作)
- 顧客滿意度與顧客留存率的影響
- 實施時間表和價值實現時間
- 投資報酬率計算方法
- 依部署模型進行投資回收期分析
- 供應鏈與整合格局
- ERP整合(SAP、Oracle、Microsoft Dynamics)
- WMS 和 TMS 連接
- 營運商與第三方物流網路整合
- 物聯網設備和感測器接入
- API 和 EDI 標準
- 資料交換協定和格式
- 整合複雜性及最佳實踐
- 按地區分類的採用障礙和促進因素
- 北美洲
- 歐洲
- 亞太地區
- 拉丁美洲
- 中東和非洲
- 供應商版圖及分類
- 純粹的可見性專家
- ERP嵌入式解決方案
- 具有可見性的TMS/WMS供應商
- 多企業網路平台
- 垂直產業特定解決方案
- 新興技術專家
- 第三方物流/貨運代理平台
- 具有可見性的採購平台
- 產業特定採用模式
- 製造業:多層級供應商可視性重點
- 零售與電子商務:最後一公里配送及履約可見性
- 物流與第三方物流:運輸與資產追蹤
- 食品飲料:監管可追溯性(FDA FSMA)
- 醫療保健與製藥:序列化與冷鏈
- 汽車產業:準時制生產和N級供應商的可視性
- 時尚與服裝:永續性可追溯性
- 變革管理與組織準備
- 利害關係人協調與高階主管支持
- 跨職能團隊組建
- 流程重組與標準化
- 培訓與能力建設
- 供應商入駐與協作
- 績效指標和關鍵績效指標定義
- 持續改進與最佳化
第4章:競爭格局
- 介紹
- 公司市佔率分析
- 北美洲
- 歐洲
- 亞太地區
- 拉丁美洲
- MEA
- 主要市場參與者的競爭分析
- 競爭定位矩陣
- 戰略展望矩陣
- 關鍵進展
- 併購
- 合作夥伴關係與合作
- 新產品發布
- 擴張計劃和資金
- 創投與私募股權活動
- 併購趨勢與整合
- 策略夥伴關係與聯盟
- 依公司發展階段分類的融資情況(種子輪、AD輪、成長期)
- 投資的地理分佈
- 投資者格局及主要參與者
第5章:市場估算與預測:依組件分類,2022-2035年
- 軟體
- 服務
- 諮詢
- 執行
- 支援與維護
第6章:市場估算與預測:依部署模式分類,2022-2035年
- 雲
- 本地部署
第7章:市場估算與預測:依企業規模分類,2022-2035年
- 大型企業
- 中小企業
第8章:市場估算與預測:依應用領域分類,2022-2035年
- 訂單管理
- 資產追蹤
- 庫存管理
- 貨物追蹤
- 供應鏈規劃
- 其他
第9章:市場估算與預測:依最終用途分類,2022-2035年
- 零售和消費品
- 醫療保健和製藥
- 製造業
- 運輸和物流
- 汽車
- 航太與國防
- 食品和飲料
- 其他
第10章:市場估計與預測:依地區分類,2022-2035年
- 北美洲
- 美國
- 加拿大
- 歐洲
- 德國
- 英國
- 法國
- 義大利
- 西班牙
- 俄羅斯
- 北歐
- 葡萄牙
- 克羅埃西亞
- 亞太地區
- 中國
- 印度
- 日本
- 澳洲
- 韓國
- 新加坡
- 泰國
- 印尼
- 越南
- 拉丁美洲
- 巴西
- 墨西哥
- 阿根廷
- MEA
- 南非
- 沙烏地阿拉伯
- 阿拉伯聯合大公國
- 土耳其
第11章:公司簡介
- 全球參與者
- Amazon Web Services (AWS)
- Blue Yonder
- Google Cloud
- IBM
- Infor
- Manhattan Associates
- Microsoft
- Oracle
- Salesforce
- SAP
- 區域玩家
- CH Robinson Worldwide
- Coupa Software
- Descartes Systems
- E2open
- Epicor Software
- GEP
- Ivalua
- JAGGAER
- Kinaxis
- Logility
- 新興及小眾玩家
- FourKites
- project44
- Shippeo
- TraceLink
- Transporeon
The Global Supply Chain Visibility Software Market was valued at USD 3.3 billion in 2025 and is estimated to grow at a CAGR of 13.4% to reach USD 10.9 billion by 2035.
The shift from traditional manual tracking methods to cloud-native digital platforms is driving widespread adoption. Disruptions such as pandemics, geopolitical conflicts, and extreme weather events have highlighted vulnerabilities in conventional supply chains, prompting organizations to embrace more advanced solutions. Artificial intelligence, machine learning, and IoT sensors are enabling predictive supply chain intelligence, allowing companies to forecast demand, detect anomalies, and optimize routes efficiently. Blockchain and edge computing enhance traceability and regulatory compliance. Increasingly stringent regulations, including the EU's Corporate Sustainability Due Diligence Directive, the FDA's FSMA 204, the EU Deforestation Regulation, and the Uyghur Forced Labor Prevention Act, are accelerating adoption as organizations aim to integrate supplier data, carbon accounting, and event-based tracking to avoid penalties and improve transparency.
| Market Scope | |
|---|---|
| Start Year | 2025 |
| Forecast Year | 2026-2035 |
| Start Value | $3.3 Billion |
| Forecast Value | $10.9 Billion |
| CAGR | 13.4% |
The software segment held a 70% share in 2025 and is expected to grow at a CAGR of 12.8% through 2035. Software components, including analytics dashboards, control tower applications, and visibility platforms, are essential for capturing, processing, and displaying supply chain data.
Cloud-native SaaS models support rapid deployment, cost efficiency, and continuous updates. The cloud-based segment held a 57% share in 2025 and is forecasted to grow at a CAGR of 14.1% from 2026 to 2035. Cloud solutions offer real-time accessibility, improved collaboration, scalability, reduced upfront costs, and lower IT management burdens.
U.S. Supply Chain Visibility Software Market held a significant share in 2024, driven by e-commerce expansion, complex logistics networks, and innovation from leading companies. U.S. shippers, carriers, and third-party logistics providers are adopting visibility platforms to increase transparency and operational efficiency. AI-powered analytics and predictive insights are pivotal in enabling this transformation. Regulatory mandates such as the FSMA 204 and the Uyghur Forced Labor Prevention Act are further fueling adoption to ensure traceability and compliance.
Key players in the Supply Chain Visibility Software Market include Blue Yonder, Manhattan Associates, Project44, Oracle, SAP, IBM, Kinaxis, Infor, Descartes Systems, and FourKites. Companies in the Supply Chain Visibility Software Market are strengthening their presence through several strategies. They are investing heavily in AI, IoT, and blockchain integration to offer predictive analytics, real-time monitoring, and enhanced traceability. Strategic partnerships with logistics providers and third-party platforms expand reach and customer adoption. Cloud-based SaaS models are emphasized to reduce deployment time, provide scalability, and lower operational costs. Firms also focus on continuous software upgrades, customer training, and robust support services to enhance client satisfaction. Additionally, companies leverage analytics for insights into demand, supply risks, and regulatory compliance, ensuring they remain competitive and capable of supporting complex global supply chains.
Table of Contents
Chapter 1 Methodology
- 1.1 Market scope and definition
- 1.2 Research design
- 1.2.1 Research approach
- 1.2.2 Data collection methods
- 1.3 Data mining sources
- 1.3.1 Global
- 1.3.2 Regional/Country
- 1.4 Base estimates and calculations
- 1.4.1 Base year calculation
- 1.4.2 Key trends for market estimation
- 1.5 Primary research and validation
- 1.5.1 Primary sources
- 1.6 Forecast model
- 1.7 Research assumptions and limitations
Chapter 2 Executive Summary
- 2.1 Industry 3600 synopsis, 2022 - 2035
- 2.2 Key market trends
- 2.2.1 Regional
- 2.2.2 Component
- 2.2.3 Deployment Mode
- 2.2.4 Enterprise Size
- 2.2.5 Application
- 2.2.6 End Use
- 2.3 TAM Analysis, 2026-2035
- 2.4 CXO perspectives: Strategic imperatives
- 2.4.1 Executive decision points
- 2.4.2 Critical success factors
- 2.5 Future outlook and strategic recommendations
Chapter 3 Industry Insights
- 3.1 Industry ecosystem analysis
- 3.1.1 Supplier landscape
- 3.1.2 Profit margin analysis
- 3.1.3 Cost structure
- 3.1.4 Value addition at each stage
- 3.1.5 Factor affecting the value chain
- 3.1.6 Disruptions
- 3.2 Industry impact forces
- 3.2.1 Growth drivers
- 3.2.1.1 Digital transformation of supply chains
- 3.2.1.2 Rise of e-commerce and complex global trade
- 3.2.1.3 Need for risk management and supply-chain resilience
- 3.2.1.4 Regulatory, compliance, sustainability, and traceability requirements
- 3.2.1.5 Industry expansion and growth of key sectors
- 3.2.2 Industry pitfalls and challenges
- 3.2.2.1 High implementation and integration costs
- 3.2.2.2 Data security and privacy concerns
- 3.2.3 Market opportunities
- 3.2.3.1 Expansion in emerging markets
- 3.2.3.2 Integration with IoT and AI technologies
- 3.2.3.3 Cloud-based and SaaS solutions
- 3.2.3.4 Focus on sustainability and traceability
- 3.2.1 Growth drivers
- 3.3 Growth potential analysis
- 3.4 Regulatory landscape
- 3.4.1 FDA FSMA food traceability requirements
- 3.4.2 EU sustainability regulations (CSRD, CSDD, ESPR)
- 3.4.3 Digital product passport (DPP) mandates
- 3.4.4 EU deforestation regulation (EUDR)
- 3.4.5 Software supply chain security (SBOM, NIST SSDF)
- 3.4.6 Customs & trade compliance requirements
- 3.4.7 Data privacy & sovereignty regulations (GDPR, CCPA)
- 3.4.8 Industry-specific regulations (DSCSA, ITAR, HIPAA)
- 3.5 Porter's analysis
- 3.6 PESTEL analysis
- 3.7 Technology and innovation landscape
- 3.7.1 Current technological trends
- 3.7.1.1 Control tower architecture evolution
- 3.7.1.2 AI & machine learning for predictive analytics
- 3.7.1.3 IoT & sensor integration (GPS, RFID, telematics)
- 3.7.1.4 Blockchain for immutable traceability
- 3.7.2 Emerging technologies
- 3.7.2.1 Digital twins & simulation
- 3.7.2.2 Edge computing for real-time processing
- 3.7.2.3 Generative AI & copilots for supply chain planners
- 3.7.2.4 5G connectivity & low-latency applications
- 3.7.1 Current technological trends
- 3.8 Pricing models & total cost of ownership
- 3.8.1 SaaS subscription pricing
- 3.8.2 On-premise licensing & maintenance
- 3.8.3 Hybrid deployment economics
- 3.8.4 Implementation & integration costs
- 3.8.5 TCO comparison: cloud vs on-premise vs hybrid
- 3.8.6 Hidden costs & cost optimization strategies
- 3.8.7 Pricing trends & market dynamics
- 3.9 Patent analysis
- 3.9.1 USPTO CPC classification landscape (G06Q, G06K)
- 3.9.2 Key patent trends (2020-2025)
- 3.9.3 Predictive visibility & route optimization patents
- 3.9.4 Blockchain & traceability IP landscape
- 3.9.5 Top patent assignees & innovation leaders
- 3.9.6 Patent filing trends by geography
- 3.9.7 Freedom-to-operate considerations
- 3.10 Use cases & success stories
- 3.10.1 Manufacturing: automotive tier-N visibility
- 3.10.2 Retail: omni-channel inventory visibility
- 3.10.3 Food & beverage: FDA FSMA compliance implementation
- 3.10.4 Pharmaceuticals: serialization & track-and-trace
- 3.10.5 Logistics: real-time transportation visibility
- 3.10.6 Fashion: sustainability & ethical sourcing traceability
- 3.10.7 High-tech: component shortage mitigation
- 3.11 Sustainability and environmental aspects
- 3.11.1 Sustainable practices
- 3.11.2 Waste reduction strategies
- 3.11.3 Energy efficiency in production
- 3.11.4 Eco-friendly Initiatives
- 3.11.5 Carbon footprint considerations
- 3.12 ROI & business case analysis
- 3.12.1 Quantifiable benefits & KPIs
- 3.12.2 Logistics cost reduction (15-30%)
- 3.12.3 Inventory optimization (20-30% carrying cost reduction)
- 3.12.4 On-time delivery improvement (10-25%)
- 3.12.5 Exception management efficiency (40-60% manual reduction)
- 3.12.6 Customer satisfaction & retention impact
- 3.12.7 Implementation timeframes & time-to-value
- 3.12.8 ROI calculation methodologies
- 3.12.9 Payback period analysis by deployment model
- 3.13 Supply chain & integration landscape
- 3.13.1 ERP integration (SAP, Oracle, Microsoft Dynamics)
- 3.13.2 WMS & TMS connectivity
- 3.13.3 Carrier & 3PL network integration
- 3.13.4 IoT device & sensor onboarding
- 3.13.5 API & EDI standards
- 3.13.6 Data exchange protocols & formats
- 3.13.7 Integration complexity & best practices
- 3.14 Adoption barriers & enablers by region
- 3.14.1 North America
- 3.14.2 Europe
- 3.14.3 Asia Pacific
- 3.14.4 Latin America
- 3.14.5 Middle East & Africa
- 3.15 Vendor landscape & categorization
- 3.15.1 Pure-play visibility specialists
- 3.15.2 ERP-embedded solutions
- 3.15.3 TMS/WMS vendors with visibility
- 3.15.4 Multi-enterprise network platforms
- 3.15.5 Vertical-specific solutions
- 3.15.6 Emerging technology specialists
- 3.15.7 3PL/freight forwarder platforms
- 3.15.8 Procurement platforms with visibility
- 3.16 Industry-specific adoption patterns
- 3.16.1 Manufacturing: multi-tier supplier visibility focus
- 3.16.2 Retail & e-commerce: last-mile & fulfillment visibility
- 3.16.3 Logistics & 3PL: transportation & asset tracking
- 3.16.4 Food & beverage: regulatory traceability (FDA FSMA)
- 3.16.5 Healthcare & pharma: serialization & cold chain
- 3.16.6 Automotive: JIT & tier-N supplier visibility
- 3.16.7 Fashion & apparel: sustainability traceability
- 3.17 Change management & organizational readiness
- 3.17.1 Stakeholder alignment & executive sponsorship
- 3.17.2 Cross-functional team formation
- 3.17.3 Process redesign & standardization
- 3.17.4 Training & capability building
- 3.17.5 Supplier onboarding & collaboration
- 3.17.6 Performance metrics & KPI definition
- 3.17.7 Continuous improvement & optimization
Chapter 4 Competitive Landscape, 2025
- 4.1 Introduction
- 4.2 Company market share analysis
- 4.2.1 North America
- 4.2.2 Europe
- 4.2.3 Asia Pacific
- 4.2.4 LATAM
- 4.2.5 MEA
- 4.3 Competitive analysis of major market players
- 4.4 Competitive positioning matrix
- 4.5 Strategic outlook matrix
- 4.6 Key developments
- 4.6.1 Mergers & acquisitions
- 4.6.2 Partnerships & collaborations
- 4.6.3 New Product Launches
- 4.6.4 Expansion Plans and funding
- 4.6.4.1 Venture capital & private equity activity
- 4.6.4.2 M&A trends & consolidation
- 4.6.4.3 Strategic partnerships & alliances
- 4.6.4.4 Funding by company stage (seed, Series A-D, growth)
- 4.6.4.5 Geographic distribution of investments
- 4.6.4.6 Investor landscape & key players
Chapter 5 Market Estimates & Forecast, By Component, 2022-2035 ($Bn)
- 5.1 Key trends
- 5.2 Software
- 5.3 Services
- 5.3.1 Consulting
- 5.3.2 Implementation
- 5.3.3 Support & Maintenance
Chapter 6 Market Estimates & Forecast, By Deployment Mode, 2022-2035 ($Bn)
- 6.1 Key trends
- 6.2 Cloud
- 6.3 On-Premises
Chapter 7 Market Estimates & Forecast, By Enterprise Size, 2022-2035 ($Bn)
- 7.1 Key trends
- 7.2 Large enterprises
- 7.3 SME
Chapter 8 Market Estimates & Forecast, By Application, 2022-2035 ($Bn)
- 8.1 Key trends
- 8.2 Order management
- 8.3 Asset tracking
- 8.4 Inventory management
- 8.5 Shipment tracking
- 8.6 Supply chain planning
- 8.7 Others
Chapter 9 Market Estimates & Forecast, By End Use, 2022-2035 ($Bn)
- 9.1 Key trends
- 9.2 Retail and consumer goods
- 9.3 Healthcare and pharmaceuticals
- 9.4 Manufacturing
- 9.5 Transportation and logistics
- 9.6 Automotive
- 9.7 Aerospace and defense
- 9.8 Food and beverages
- 9.9 Others
Chapter 10 Market Estimates & Forecast, By Region, 2022 - 2035 ($Bn)
- 10.1 Key trends
- 10.2 North America
- 10.2.1 US
- 10.2.2 Canada
- 10.3 Europe
- 10.3.1 Germany
- 10.3.2 UK
- 10.3.3 France
- 10.3.4 Italy
- 10.3.5 Spain
- 10.3.6 Russia
- 10.3.7 Nordics
- 10.3.8 Portugal
- 10.3.9 Croatia
- 10.4 Asia Pacific
- 10.4.1 China
- 10.4.2 India
- 10.4.3 Japan
- 10.4.4 Australia
- 10.4.5 South Korea
- 10.4.6 Singapore
- 10.4.7 Thailand
- 10.4.8 Indonesia
- 10.4.9 Vietnam
- 10.5 Latin America
- 10.5.1 Brazil
- 10.5.2 Mexico
- 10.5.3 Argentina
- 10.6 MEA
- 10.6.1 South Africa
- 10.6.2 Saudi Arabia
- 10.6.3 UAE
- 10.6.4 Turkey
Chapter 11 Company Profiles
- 11.1 Global Players
- 11.1.1 Amazon Web Services (AWS)
- 11.1.2 Blue Yonder
- 11.1.3 Google Cloud
- 11.1.4 IBM
- 11.1.5 Infor
- 11.1.6 Manhattan Associates
- 11.1.7 Microsoft
- 11.1.8 Oracle
- 11.1.9 Salesforce
- 11.1.10 SAP
- 11.2 Regional Players
- 11.2.1 C.H. Robinson Worldwide
- 11.2.2 Coupa Software
- 11.2.3 Descartes Systems
- 11.2.4 E2open
- 11.2.5 Epicor Software
- 11.2.6 GEP
- 11.2.7 Ivalua
- 11.2.8 JAGGAER
- 11.2.9 Kinaxis
- 11.2.10 Logility
- 11.3 Emerging & Niche Players
- 11.3.1 FourKites
- 11.3.2 project44
- 11.3.3 Shippeo
- 11.3.4 TraceLink
- 11.3.5 Transporeon
 2026-2030年全球人工智慧感測器整合市場
 2026年全球企業數據視覺化平台市場報告
 資料視覺化市場報告:按組件、組織單元、部署類型、企業規模、最終用戶和地區分類(2026-2034 年)
 全球數據視覺化市場規模、佔有率、趨勢和成長分析報告(2026-2034)全球人工智慧感測器市場規模、佔有率、趨勢和成長分析報告(2026-2034)2026年全球數據視覺化生成式人工智慧(AI)市場報告
 供應鏈視覺化軟體市場預測:至 2034 年—按組件、部署類型、企業規模、最終用戶和地區分類的全球分析2026年全球數據數位化市場報告
 人工智慧心智圖工具市場:按部署類型、定價模式、技術組件、應用、部署模式和組織規模分類,全球預測,2026-2032年
 感測器資料分析市場分析及預測(至2035年):按類型、產品類型、服務、技術、組件、應用、設備、最終用戶和部署類型分類