


 |
市場調查報告書
商品編碼
1892647
循環經濟化學品市場機會、成長促進因素、產業趨勢分析及預測(2025-2034年)Circular Economy Chemicals Market Opportunity, Growth Drivers, Industry Trend Analysis, and Forecast 2025 - 2034 |
||||||
2024 年全球循環經濟化學品市場價值為 2,284 億美元,預計到 2034 年將以 13.5% 的複合年成長率成長至 8,123 億美元。
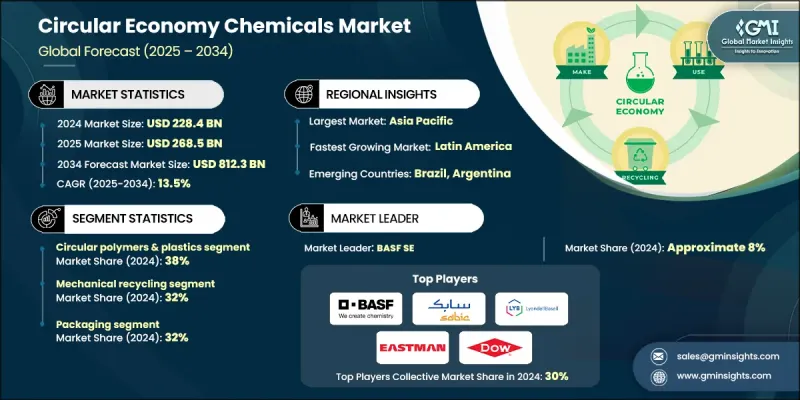
本產業涵蓋聚合物、樹脂、有機和無機化學品、中間體以及源自機械和化學回收、生物基原料和工業廢棄物回收的特殊化學品。隨著監管框架的不斷完善、永續發展承諾的日益強化以及先進回收技術的日益成熟,該行業的成長速度正在加快。三大變革正在重塑產業格局:針對難處理廢棄物的化學和先進回收工廠的大規模建設;主要工業垂直領域對循環商業模式的採用;以及認證體系和品質平衡方法的擴展,使企業能夠驗證循環成分並將其商業化。這些趨勢正在包裝、交通、電子和消費品等產業催生對循環化學品的龐大新需求。隨著各行業致力於脫碳和減少廢棄物,循環經濟化學品市場持續成長,企業正在探索創新途徑,以實現材料循環並減少對傳統化石基原料的依賴。
| 市場範圍 | |
|---|---|
| 起始年份 | 2024 |
| 預測年份 | 2025-2034 |
| 起始值 | 2284億美元 |
| 預測值 | 8123億美元 |
| 複合年成長率 | 13.5% |
2024年,循環聚合物和塑膠領域佔據了38%的市場佔有率,預計到2034年將以13.5%的複合年成長率成長。其主導地位源自於全球在包裝、建築、汽車零件、電子產品和家居用品等領域對塑膠的龐大消費量。減少塑膠廢棄物和提高回收率的壓力日益增大,也促使人們更加迫切地需要能夠同時滿足環境和工業性能要求的循環替代方案。
2024年,機械回收市佔率佔比達32%,預計2025年至2034年間將以11.8%的複合年成長率成長。此方法憑藉其成本效益和對消費後及工業後塑膠的廣泛適用性,保持領先地位。其相對簡單的加工流程使其成為眾多尋求經濟型回收方案的終端用戶產業的首選。
2024年,歐洲循環經濟化學品市場規模預計將達到617億美元,體現了其在全球循環經濟化學品領域的強大地位。該地區受益於先進的廢棄物管理系統、雄心勃勃的政策方針和完善的回收基礎設施。旨在提高回收率和改善產品循環性的各項綜合舉措,將繼續鞏固該地區在推動更永續的化學品生產和減少廢棄物方面所發揮的領導作用。
目錄
第1章:方法論與範圍
第2章:執行概要
第3章:行業洞察
- 產業生態系分析
- 供應商格局
- 利潤率
- 每個階段的價值增加
- 影響價值鏈的因素
- 中斷
- 產業影響因素
- 成長促進因素
- 產業陷阱與挑戰
- 市場機遇
- 成長潛力分析
- 監管環境
- 北美洲
- 歐洲
- 亞太地區
- 拉丁美洲
- 中東和非洲
- 波特的分析
- PESTEL 分析
- 價格趨勢
- 按地區
- 按類型
- 未來市場趨勢
- 技術與創新格局
- 當前技術趨勢
- 新興技術
- 專利格局
- 貿易統計(HS編碼)(註:僅提供重點國家的貿易統計資料)
- 主要進口國
- 主要出口國
- 永續性和環境方面
- 永續實踐
- 減少廢棄物策略
- 生產中的能源效率
- 環保舉措
- 碳足跡考量
第4章:競爭格局
- 介紹
- 公司市佔率分析
- 按地區
- 北美洲
- 歐洲
- 亞太地區
- 拉丁美洲
- MEA
- 按地區
- 公司矩陣分析
- 主要市場參與者的競爭分析
- 競爭定位矩陣
- 關鍵進展
- 併購
- 合作夥伴關係與合作
- 新產品發布
- 擴張計劃
第5章:市場估算與預測:依類型分類,2021-2034年
- 循環聚合物和塑膠
- 循環溶劑
- 回收金屬和無機化學品
- 生物化學品
- 二氧化碳基化學品
- 回收的特殊化學品
第6章:市場估算與預測:依製程分類,2021-2034年
- 機械回收
- 化學回收
- 生物/酵素法加工
- 二氧化碳捕集與利用(CCU)
- 生物精煉
- 溶劑回收與純化
第7章:市場估算與預測:依最終用途產業分類,2021-2034年
- 包裝
- 軟包裝
- 硬質包裝
- 工業及運輸包裝
- 可堆肥和可生物分解包裝
- 汽車與運輸
- 內部組件
- 外部及結構部件
- 引擎蓋下及動力系統
- 電氣和電子系統
- 塗層與表面保護
- 建築材料
- 絕緣材料
- 結構和飾面材料
- 黏合劑、密封劑和塗料
- 管道及基礎設施
- 紡織服裝
- 時尚與服裝
- 家用紡織品及家具
- 技術及工業紡織品
- 農業
- 農業薄膜
- 肥料和土壤改良劑
- 作物保護與農業化學品
- 灌溉與水資源管理
- 電學
- 消費性電子產品
- 工業電子及設備
- 儲能與電池
- 電線、電纜和電氣基礎設施
- 消費品及個人護理
- 個人護理產品
第8章:市場估算與預測:依地區分類,2021-2034年
- 北美洲
- 美國
- 加拿大
- 歐洲
- 德國
- 英國
- 法國
- 西班牙
- 義大利
- 歐洲其他地區
- 亞太地區
- 中國
- 印度
- 日本
- 澳洲
- 韓國
- 亞太其他地區
- 拉丁美洲
- 巴西
- 墨西哥
- 阿根廷
- 拉丁美洲其他地區
- 中東和非洲
- 沙烏地阿拉伯
- 南非
- 阿拉伯聯合大公國
- 中東和非洲其他地區
第9章:公司簡介
- BASF SE
- Borealis AG
- Braskem SA
- Carbios SA
- Covestro AG
- Dow Inc.
- DSM-Firmenich
- Eastman Chemical Company
- Evonik Industries AG
- INEOS Group
- LG Chem Ltd.
- Loop Industries Inc.
- LyondellBasell Industries NV
- Mitsubishi Chemical Group Corporation
- Mitsui Chemicals, Inc.
- Neste Oyj
- Reliance Industries Limited
- SABIC
- Solvay SA
- Veolia Environnement SA
The Global Circular Economy Chemicals Market was valued at USD 228.4 billion in 2024 and is estimated to grow at a CAGR of 13.5% to reach USD 812.3 billion by 2034.
This industry includes polymers, resins, organic and inorganic chemicals, intermediate materials, and specialty chemicals derived from mechanical and chemical recycling, bio-based feedstocks, and industrial waste recovery. Growth in this sector is accelerating as regulatory frameworks evolve, sustainability commitments intensify, and advanced recycling technologies reach greater maturity. Three major shifts are reshaping the landscape: the large-scale development of chemical and advanced recycling plants for difficult waste streams, the adoption of circular business models across major industrial verticals, and the expansion of certification systems and mass balance approaches that allow companies to verify and commercialize circular content. These trends are generating substantial new demand for circular chemicals across packaging, mobility, electronics, and consumer goods. As industries work toward decarbonization and reduced waste, the circular economy chemicals market continues to gain traction as companies explore innovative pathways to close material loops and reduce their dependence on traditional fossil-based feedstocks.
| Market Scope | |
|---|---|
| Start Year | 2024 |
| Forecast Year | 2025-2034 |
| Start Value | $228.4 Billion |
| Forecast Value | $812.3 Billion |
| CAGR | 13.5% |
The circular polymers and plastics segment held a 38% share in 2024 and is expected to grow at a CAGR of 13.5% through 2034. Their dominance stems from the immense global consumption of plastics across packaging, construction, automotive components, electronics, and household products. Rising pressure to reduce plastic waste and improve recycling rates has intensified the need for circular alternatives that can support both environmental and industrial performance requirements.
The mechanical recycling segment accounted for a 32% share in 2024 and is projected to grow at a CAGR of 11.8% between 2025 and 2034. This method maintains its leading position due to its cost-efficiency and practical applicability across post-consumer and post-industrial plastic streams. Its relatively straightforward processing methods make it a widely adopted solution for many end-use industries seeking economical recycling options.
Europe Circular Economy Chemicals Market generated USD 61.7 billion in 2024, reflecting its strong presence in the global circular economy chemicals sector. The region benefits from advanced waste management systems, ambitious policy directives, and extensive recycling infrastructure. Comprehensive initiatives aimed at increasing recycling rates and improving product circularity continue to support the region's leadership as it pushes toward more sustainable chemical production and waste reduction.
Key companies active in the Global Circular Economy Chemicals Market include BASF SE, Borealis AG, Braskem S.A., Carbios SA, Covestro AG, Dow Inc., DSM-Firmenich, Eastman Chemical Company, Evonik Industries AG, INEOS Group, LG Chem Ltd., Loop Industries Inc., LyondellBasell Industries N.V., Mitsubishi Chemical Group Corporation, Mitsui Chemicals, Inc., Neste Oyj, Reliance Industries Limited, SABIC, Solvay S.A., and Veolia Environnement S.A. Companies operating in the Global Circular Economy Chemicals Market are adopting several strategies to reinforce their competitive standing. Many are expanding partnerships with waste management firms to secure stable access to recycled feedstocks and enhance material traceability. Investments in advanced recycling technologies, such as depolymerization and solvent-based recovery, are helping companies improve output quality and broaden application potential. Firms are also scaling bio-based production capacities to diversify beyond fossil-derived inputs.
Table of Contents
Chapter 1 Methodology & Scope
- 1.1 Market scope and definition
- 1.2 Research design
- 1.2.1 Research approach
- 1.2.2 Data collection methods
- 1.3 Data mining sources
- 1.3.1 Global
- 1.3.2 Regional/Country
- 1.4 Base estimates and calculations
- 1.4.1 Base year calculation
- 1.4.2 Key trends for market estimation
- 1.5 Primary research and validation
- 1.5.1 Primary sources
- 1.6 Forecast model
- 1.7 Research assumptions and limitations
Chapter 2 Executive Summary
- 2.1 Industry 3600 synopsis
- 2.2 Key market trends
- 2.2.1 Regional
- 2.2.2 Type
- 2.2.3 Process
- 2.2.4 End Use Industry
- 2.3 TAM Analysis, 2025-2034
- 2.4 CXO perspectives: Strategic imperatives
- 2.4.1 Executive decision points
- 2.4.2 Critical success factors
- 2.5 Future Outlook and Strategic Recommendations
Chapter 3 Industry Insights
- 3.1 Industry ecosystem analysis
- 3.1.1 Supplier landscape
- 3.1.2 Profit margin
- 3.1.3 Value addition at each stage
- 3.1.4 Factor affecting the value chain
- 3.1.5 Disruptions
- 3.2 Industry impact forces
- 3.2.1 Growth drivers
- 3.2.2 Industry pitfalls and challenges
- 3.2.3 Market opportunities
- 3.3 Growth potential analysis
- 3.4 Regulatory landscape
- 3.4.1 North America
- 3.4.2 Europe
- 3.4.3 Asia Pacific
- 3.4.4 Latin America
- 3.4.5 Middle East & Africa
- 3.5 Porter's analysis
- 3.6 PESTEL analysis
- 3.7 Price trends
- 3.7.1 By region
- 3.7.2 By type
- 3.8 Future market trends
- 3.9 Technology and Innovation landscape
- 3.9.1 Current technological trends
- 3.9.2 Emerging technologies
- 3.10 Patent Landscape
- 3.11 Trade statistics (HS code) (Note: the trade statistics will be provided for key countries only)
- 3.11.1 Major importing countries
- 3.11.2 Major exporting countries
- 3.12 Sustainability and environmental aspects
- 3.12.1 Sustainable practices
- 3.12.2 Waste reduction strategies
- 3.12.3 Energy efficiency in production
- 3.12.4 Eco-friendly initiatives
- 3.13 Carbon footprint consideration
Chapter 4 Competitive Landscape, 2024
- 4.1 Introduction
- 4.2 Company market share analysis
- 4.2.1 By region
- 4.2.1.1 North America
- 4.2.1.2 Europe
- 4.2.1.3 Asia Pacific
- 4.2.1.4 LATAM
- 4.2.1.5 MEA
- 4.2.1 By region
- 4.3 Company matrix analysis
- 4.4 Competitive analysis of major market players
- 4.5 Competitive positioning matrix
- 4.6 Key developments
- 4.6.1 Mergers & acquisitions
- 4.6.2 Partnerships & collaborations
- 4.6.3 New Product Launches
- 4.6.4 Expansion Plans
Chapter 5 Market Estimates and Forecast, By Type, 2021-2034 (USD Billion) (Kilo Tons)
- 5.1 Key trends
- 5.2 Circular Polymers & Plastics
- 5.3 Circular Solvents
- 5.4 Recovered Metals & Inorganic Chemicals
- 5.5 Bio-Chemicals
- 5.6 CO2-Based Chemicals
- 5.7 Recovered Specialty Chemicals
Chapter 6 Market Estimates and Forecast, By Process, 2021-2034 (USD Billion) (Kilo Tons)
- 6.1 Key trends
- 6.2 Mechanical Recycling
- 6.3 Chemical Recycling
- 6.4 Biological/Enzymatic Processing
- 6.5 CO2 Capture & Utilization (CCU)
- 6.6 Biorefining
- 6.7 Solvent Recovery & Purification
Chapter 7 Market Estimates and Forecast, By End Use Industry, 2021-2034 (USD Billion) (Kilo Tons)
- 7.1 Key trends
- 7.2 Packaging
- 7.2.1 Flexible Packaging
- 7.2.2 Rigid Packaging
- 7.2.3 Industrial & Transport Packaging
- 7.2.4 Compostable & Biodegradable Packaging
- 7.3 Automotive & Transportation
- 7.3.1 Interior Components
- 7.3.2 Exterior & Structural Components
- 7.3.3 Under-the-Hood & Powertrain
- 7.3.4 Electrical & Electronic Systems
- 7.3.5 Coatings & Surface Protection
- 7.4 Construction & Building Materials
- 7.4.1 Insulation Materials
- 7.4.2 Structural & Finishing Materials
- 7.4.3 Adhesives, Sealants & Coatings
- 7.4.4 Piping & Infrastructure
- 7.5 Textiles & Apparel
- 7.5.1 Fashion & Apparel
- 7.5.2 Home Textiles & Furnishings
- 7.5.3 Technical & Industrial Textiles
- 7.6 Agriculture
- 7.6.1 Agricultural Films
- 7.6.2 Fertilizers & Soil Amendments
- 7.6.3 Crop Protection & Agricultural Chemicals
- 7.6.4 Irrigation & Water Management
- 7.7 Electronics & Electrical
- 7.7.1 Consumer Electronics
- 7.7.2 Industrial Electronics & Equipment
- 7.7.3 Energy Storage & Batteries
- 7.7.4 Wire, Cable & Electrical Infrastructure
- 7.8 Consumer Products & Personal Care
- 7.8.1 Personal Care Products
Chapter 8 Market Estimates and Forecast, By Region, 2021-2034 (USD Billion) (Kilo Tons)
- 8.1 Key trends
- 8.2 North America
- 8.2.1 U.S.
- 8.2.2 Canada
- 8.3 Europe
- 8.3.1 Germany
- 8.3.2 UK
- 8.3.3 France
- 8.3.4 Spain
- 8.3.5 Italy
- 8.3.6 Rest of Europe
- 8.4 Asia Pacific
- 8.4.1 China
- 8.4.2 India
- 8.4.3 Japan
- 8.4.4 Australia
- 8.4.5 South Korea
- 8.4.6 Rest of Asia Pacific
- 8.5 Latin America
- 8.5.1 Brazil
- 8.5.2 Mexico
- 8.5.3 Argentina
- 8.5.4 Rest of Latin America
- 8.6 Middle East and Africa
- 8.6.1 Saudi Arabia
- 8.6.2 South Africa
- 8.6.3 UAE
- 8.6.4 Rest of Middle East and Africa
Chapter 9 Company Profiles
- 9.1 BASF SE
- 9.2 Borealis AG
- 9.3 Braskem S.A.
- 9.4 Carbios SA
- 9.5 Covestro AG
- 9.6 Dow Inc.
- 9.7 DSM-Firmenich
- 9.8 Eastman Chemical Company
- 9.9 Evonik Industries AG
- 9.10 INEOS Group
- 9.11 LG Chem Ltd.
- 9.12 Loop Industries Inc.
- 9.13 LyondellBasell Industries N.V.
- 9.14 Mitsubishi Chemical Group Corporation
- 9.15 Mitsui Chemicals, Inc.
- 9.16 Neste Oyj
- 9.17 Reliance Industries Limited
- 9.18 SABIC
- 9.19 Solvay S.A.
- 9.20 Veolia Environnement S.A.
 溫度控制租賃解決方案市場:按產品類型、溫度範圍、租賃期限、銷售管道、最終用戶產業和應用分類-全球預測,2026-2032年廢油回收市場按原料類型、技術類型和最終用途分類,全球預測(2026-2032年)
 廢棄物回收服務市場分析及預測(至2035年):依類型、產品類型、服務、技術、應用、材料類型、製程、最終用戶、設備分類
 全球酒精飲料瓶回收市場規模、佔有率、趨勢和成長分析報告(2026-2034)
 2026年全球化學品市場報告:循環經濟視角
 全球廢棄物回收服務市場-按產品、應用、地區和競爭格局分類的產業規模、佔有率、趨勢、機會和預測(2021-2031年)
 紡織廢棄物回收機械市場機會、成長要素、產業趨勢分析及預測(2026年至2035年)
 2032年循環家具市場預測:按產品、材料、應用、最終用戶和地區分類的全球分析全球廢棄物堆肥技術市場預測(至2032年):按組件、部署模式、技術、應用、最終用戶和地區分類超當地語系化廢棄物收集和回收服務市場預測至2032年:按廢棄物類別、經營模式、技術、最終用戶和地區分類的全球分析