


 |
市場調查報告書
商品編碼
1885922
綠色氨市場機會、成長促進因素、產業趨勢分析及預測(2024-2032年)Green Ammonia Market Opportunity, Growth Drivers, Industry Trend Analysis, and Forecast 2024 - 2032 |
||||||
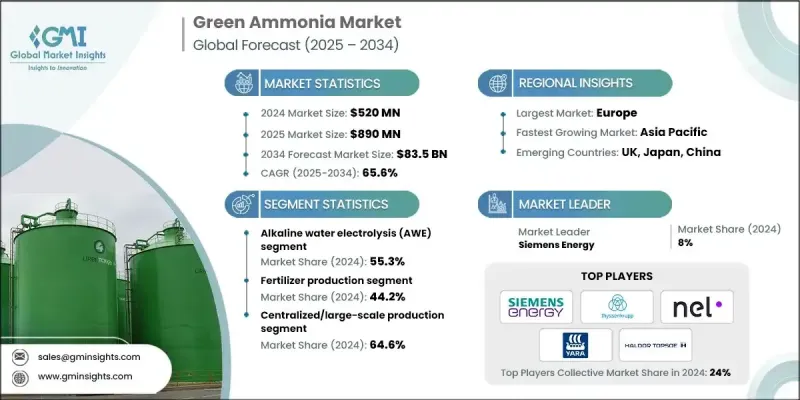
2024 年全球綠色氨市場價值為 5.2 億美元,預計到 2034 年將以 65.6% 的複合年成長率成長至 835 億美元。
綠色氨正迅速崛起為全球能源轉型的重要基石,在能源化工價值鏈中發揮關鍵作用,它能夠實現氫氣儲存、與再生能源耦合,並作為航運等難以脫碳產業的零碳燃料。其戰略意義在於利用現有的氨基礎設施加速規模化生產,同時實現脫碳目標。支持性的政策框架、氣候中和目標以及綠色能源認證體系推動了市場成長。技術進步,特別是再生能源驅動的電解氫氣技術,正在提高成本效益和營運效率。能源巨頭、化肥生產商和海營運運商的企業承諾進一步推動了投資,使綠色氨成為長期永續發展策略的關鍵要素。區域趨勢表明,亞太地區在再生能源產能和出口項目方面處於領先地位,而歐洲則受益於監管支持和已建立的綠色氫能走廊。
| 市場範圍 | |
|---|---|
| 起始年份 | 2024 |
| 預測年份 | 2025-2034 |
| 起始值 | 5.2億美元 |
| 預測值 | 835億美元 |
| 複合年成長率 | 65.6% |
2024年,鹼性水電解(AWE)市佔率達到55.3%,預計到2034年將以60.3%的複合年成長率成長。 AWE仍然是大型再生能源併網專案中最具成本效益和最成熟的技術。質子交換膜(PEM)電解具有運作靈活性和對再生能源電力波動的快速反應能力,使其成為併網和混合能源系統的理想選擇。
2024年,化肥生產領域佔44.2%的市場佔有率,預計到2034年將以56.2%的複合年成長率成長。以發酵為基礎的方法已成熟應用於生物平台化學品的生產,具有選擇性高、操作條件溫和、能夠高效大規模生產複雜分子等優點。
2024年,北美綠色氨市場佔全球市場佔有率的25.9%。該地區由於擁有豐富的可再生能源資源、支持性政策以及現有的氨基礎設施,正在崛起成為重要的生產中心,這些都有助於快速採用低碳替代品。
全球綠色氨市場的主要企業包括雅苒國際(Yara International)、西門子能源(Siemens Energy)、巴斯夫(BASF SE)、空氣產品公司(Air Products Inc.)、托普索(Haldor Topsoe)、曼恩能源解決方案(MAN Energy Solutions)、星火能源(Starfires)、德希ASA(Hydrogenics)、Hydrogenics、Kapsom、Hiringa Energy 和 Uniper ENGIE。市場參與者正透過投資研發來提高電解效率和降低生產成本,從而鞏固自身地位。他們正與再生能源供應商和工業用戶建立策略合作夥伴關係,以確保長期承購協議。各公司也正在探索模組化和大規模生產設施,以最佳化物流和基礎設施利用率。數位化監控和先進控制系統的整合正在提升營運性能和可靠性。此外,併購和合資企業也被用於擴大地域覆蓋範圍、加速商業化進程,並滿足成熟和新興綠色氨市場不斷成長的需求。
目錄
第1章:方法論與範圍
第2章:執行概要
第3章:行業洞察
- 產業生態系分析
- 供應商格局
- 利潤率
- 每個階段的價值增加
- 影響價值鏈的因素
- 中斷
- 產業影響因素
- 成長促進因素
- 全球脫碳目標與淨零排放承諾
- 海事產業向零碳燃料轉型
- 政府激勵和補貼計劃
- 產業陷阱與挑戰
- 高資本投資需求
- 技術成熟度與規模化挑戰
- 市場機遇
- 對現有氨生產設施進行改造
- 小型分散式生產系統
- 成長促進因素
- 成長潛力分析
- 監管環境
- 北美洲
- 歐洲
- 亞太地區
- 拉丁美洲
- 中東和非洲
- 波特的分析
- PESTEL 分析
- 價格趨勢
- 按地區
- 按電解槽技術類型
- 未來市場趨勢
- 技術與創新格局
- 當前技術趨勢
- 新興技術
- 專利格局
- 貿易統計(HS編碼)(註:僅提供重點國家的貿易統計資料)
- 主要進口國
- 主要出口國
- 永續性和環境方面
- 永續實踐
- 減少廢棄物策略
- 生產中的能源效率
- 環保舉措
- 碳足跡考量
第4章:競爭格局
- 介紹
- 公司市佔率分析
- 按地區
- 北美洲
- 歐洲
- 亞太地區
- 拉丁美洲
- MEA
- 按地區
- 公司矩陣分析
- 主要市場參與者的競爭分析
- 競爭定位矩陣
- 關鍵進展
- 併購
- 合作夥伴關係與合作
- 新產品發布
- 擴張計劃
第5章:市場估算與預測:依技術類型分類,2021-2034年
- 主要趨勢
- 鹼性水電解(AWE)
- 質子交換膜(PEM)電解
- 固態氧化物電解池(SOEC)
- 陰離子交換膜(AEM)
第6章:市場估算與預測:依應用領域分類,2021-2034年
- 主要趨勢
- 化肥生產
- 海事燃料與航運
- 氫載體及儲存
- 工業原料及化學品
- 發電與儲能
第7章:市場估算與預測:依生產方式分類,2021-2034年
- 主要趨勢
- 現場/分散式生產
- 集中式/大規模生產
第8章:市場估算與預測:依地區分類,2021-2034年
- 主要趨勢
- 北美洲
- 美國
- 加拿大
- 歐洲
- 德國
- 英國
- 法國
- 西班牙
- 義大利
- 歐洲其他地區
- 亞太地區
- 中國
- 印度
- 日本
- 澳洲
- 韓國
- 亞太其他地區
- 拉丁美洲
- 巴西
- 墨西哥
- 阿根廷
- 拉丁美洲其他地區
- 中東和非洲
- 沙烏地阿拉伯
- 南非
- 阿拉伯聯合大公國
- 中東和非洲其他地區
第9章:公司簡介
- Siemens Energy
- ThyssenKrupp AG
- Nel ASA (Hydrogenics)
- Yara International
- Haldor Topsoe
- Air Products Inc
- BASF SE
- Hiringa Energy
- Hydrogenics
- Kapsom
- MAN Energy Solutions
- Starfire Energy
- Technip Energies NV
- Uniper ENGIE
The Global Green Ammonia Market was valued at USD 520 million in 2024 and is estimated to grow at a CAGR of 65.6% to reach USD 83.5 billion by 2034.
Green ammonia is rapidly emerging as a cornerstone of the global energy transition, playing a critical role in energy-chemical value chains by enabling hydrogen storage, coupling with renewable energy, and serving as a zero-carbon fuel for hard-to-decarbonize sectors such as shipping. Its strategic importance lies in leveraging existing ammonia infrastructure to accelerate scale-up while meeting decarbonization targets. Market growth is propelled by supportive policy frameworks, climate neutrality goals, and certification schemes for green energy. Technological advancements, particularly in electrolysis-based hydrogen production powered by renewables, are improving cost efficiency and operational performance. Corporate commitments from energy majors, fertilizer producers, and maritime operators are further driving investment, positioning green ammonia as a key element of long-term sustainability strategies. Regional trends indicate Asia-Pacific leading in renewable capacity and export projects, while Europe benefits from regulatory support and established green hydrogen corridors.
| Market Scope | |
|---|---|
| Start Year | 2024 |
| Forecast Year | 2025-2034 |
| Start Value | $520 Million |
| Forecast Value | $83.5 Billion |
| CAGR | 65.6% |
The alkaline water electrolysis (AWE) segment held a 55.3% share in 2024 and is expected to grow at a CAGR of 60.3% through 2034. AWE remains the most cost-effective and mature technology for large-scale renewable energy-linked projects. Proton exchange membrane (PEM) electrolysis offers operational flexibility and rapid response to variable renewable electricity, making it ideal for grid-tied and hybrid energy systems.
The fertilizer production segment held a 44.2% share in 2024 and is projected to grow at a CAGR of 56.2% by 2034. Fermentation-based approaches are well-established for producing bio-platform chemicals, offering high selectivity, mild operating conditions, and efficient production of complex molecules at scale.
North America Green Ammonia Market accounted for a 25.9% share in 2024. The region is emerging as a key production hub due to abundant renewable energy resources, supportive policies, and existing ammonia infrastructure that facilitates rapid adoption of low-carbon alternatives.
Major companies in the Global Green Ammonia Market include Yara International, Siemens Energy, BASF SE, Air Products Inc., Haldor Topsoe, MAN Energy Solutions, Starfire Energy, Technip Energies NV, ThyssenKrupp AG, Nel ASA (Hydrogenics), Hydrogenics, Kapsom, Hiringa Energy, and Uniper ENGIE. Market players are strengthening their position by investing in R&D to improve electrolysis efficiency and reduce production costs. They are forming strategic partnerships with renewable energy providers and industrial consumers to secure long-term offtake agreements. Companies are also exploring modular and large-scale production facilities to optimize logistics and infrastructure utilization. Integration of digital monitoring and advanced control systems is enhancing operational performance and reliability. Additionally, mergers, acquisitions, and joint ventures are being employed to expand geographic footprint, accelerate commercialization, and capture growing demand in both established and emerging green ammonia markets.
Table of Contents
Chapter 1 Methodology & Scope
- 1.1 Market scope and definition
- 1.2 Research design
- 1.2.1 Research approach
- 1.2.2 Data collection methods
- 1.3 Data mining sources
- 1.3.1 Global
- 1.3.2 Regional/Country
- 1.4 Base estimates and calculations
- 1.4.1 Base year calculation
- 1.4.2 Key trends for market estimation
- 1.5 Primary research and validation
- 1.5.1 Primary sources
- 1.6 Forecast model
- 1.7 Research assumptions and limitations
Chapter 2 Executive Summary
- 2.1 Industry 360° synopsis
- 2.2 Key market trends
- 2.2.1 Regional
- 2.2.2 Technology type
- 2.2.3 Application
- 2.2.4 Production mode
- 2.3 TAM Analysis, 2025-2034
- 2.4 CXO perspectives: Strategic imperatives
- 2.4.1 Executive decision points
- 2.4.2 Critical success factors
- 2.5 Future Outlook and Strategic Recommendations
Chapter 3 Industry Insights
- 3.1 Industry ecosystem analysis
- 3.1.1 Supplier landscape
- 3.1.2 Profit margin
- 3.1.3 Value addition at each stage
- 3.1.4 Factor affecting the value chain
- 3.1.5 Disruptions
- 3.2 Industry impact forces
- 3.2.1 Growth drivers
- 3.2.1.1 Global decarbonization targets & net-zero commitments
- 3.2.1.2 Maritime industry's transition to zero-carbon fuels
- 3.2.1.3 Government incentives & subsidy programs
- 3.2.2 Industry pitfalls and challenges
- 3.2.2.1 High capital investment requirements
- 3.2.2.2 Technological maturity & scale-up challenges
- 3.2.3 Market opportunities
- 3.2.3.1 Retrofitting existing ammonia production facilities
- 3.2.3.2 Small-scale distributed production systems
- 3.2.1 Growth drivers
- 3.3 Growth potential analysis
- 3.4 Regulatory landscape
- 3.4.1 North America
- 3.4.2 Europe
- 3.4.3 Asia Pacific
- 3.4.4 Latin America
- 3.4.5 Middle East & Africa
- 3.5 Porter's analysis
- 3.6 PESTEL analysis
- 3.7 Price trends
- 3.7.1 By region
- 3.7.2 By electrolyzer technology type
- 3.8 Future market trends
- 3.9 Technology and Innovation landscape
- 3.9.1 Current technological trends
- 3.9.2 Emerging technologies
- 3.10 Patent Landscape
- 3.11 Trade statistics (HS code) ( Note: the trade statistics will be provided for key countries only)
- 3.11.1 Major importing countries
- 3.11.2 Major exporting countries
- 3.12 Sustainability and environmental aspects
- 3.12.1 Sustainable practices
- 3.12.2 Waste reduction strategies
- 3.12.3 Energy efficiency in production
- 3.12.4 Eco-friendly initiatives
- 3.13 Carbon footprint consideration
Chapter 4 Competitive Landscape, 2024
- 4.1 Introduction
- 4.2 Company market share analysis
- 4.2.1 By region
- 4.2.1.1 North America
- 4.2.1.2 Europe
- 4.2.1.3 Asia Pacific
- 4.2.1.4 LATAM
- 4.2.1.5 MEA
- 4.2.1 By region
- 4.3 Company matrix analysis
- 4.4 Competitive analysis of major market players
- 4.5 Competitive positioning matrix
- 4.6 Key developments
- 4.6.1 Mergers & acquisitions
- 4.6.2 Partnerships & collaborations
- 4.6.3 New Product Launches
- 4.6.4 Expansion Plans
Chapter 5 Market Estimates and Forecast, By Technology Type, 2021-2034 (USD Million)
- 5.1 Key trends
- 5.2 Alkaline water electrolysis (AWE)
- 5.3 Proton exchange membrane (PEM) electrolysis
- 5.4 Solid oxide electrolyzer cell (SOEC)
- 5.5 Anion exchange membrane (AEM)
Chapter 6 Market Estimates and Forecast, By Application, 2021-2034 (USD Million)
- 6.1 Key trends
- 6.2 Fertilizer production
- 6.3 Maritime fuel & shipping
- 6.4 Hydrogen carrier & storage
- 6.5 Industrial feedstock & chemicals
- 6.6 Power generation & energy storage
Chapter 7 Market Estimates and Forecast, By Production Mode, 2021-2034 (USD Million)
- 7.1 Key trends
- 7.2 On-site/distributed production
- 7.3 Centralized/large-scale production
Chapter 8 Market Estimates and Forecast, By Region, 2021-2034 (USD Million)
- 8.1 Key trends
- 8.2 North America
- 8.2.1 U.S.
- 8.2.2 Canada
- 8.3 Europe
- 8.3.1 Germany
- 8.3.2 UK
- 8.3.3 France
- 8.3.4 Spain
- 8.3.5 Italy
- 8.3.6 Rest of Europe
- 8.4 Asia Pacific
- 8.4.1 China
- 8.4.2 India
- 8.4.3 Japan
- 8.4.4 Australia
- 8.4.5 South Korea
- 8.4.6 Rest of Asia Pacific
- 8.5 Latin America
- 8.5.1 Brazil
- 8.5.2 Mexico
- 8.5.3 Argentina
- 8.5.4 Rest of Latin America
- 8.6 Middle East and Africa
- 8.6.1 Saudi Arabia
- 8.6.2 South Africa
- 8.6.3 UAE
- 8.6.4 Rest of Middle East and Africa
Chapter 9 Company Profiles
- 9.1 Siemens Energy
- 9.2 ThyssenKrupp AG
- 9.3 Nel ASA (Hydrogenics)
- 9.4 Yara International
- 9.5 Haldor Topsoe
- 9.6 Air Products Inc
- 9.7 BASF SE
- 9.8 Hiringa Energy
- 9.9 Hydrogenics
- 9.10 Kapsom
- 9.11 MAN Energy Solutions
- 9.12 Starfire Energy
- 9.13 Technip Energies NV
- 9.14 Uniper ENGIE
 綠色氨市場:2026-2032年全球市場預測(依生產技術、動力來源、工廠產能、儲存方式及應用分類)
 2026年全球綠色氨調峰機組前端工程設計(FEED)市場報告2026年全球綠色氨市場報告
 綠色氨市場規模、佔有率、成長及全球產業分析:按類型、應用和地區的洞察,2026-2034年的預測
 綠色氨:市場佔有率分析、產業趨勢與統計、成長預測(2026-2031)全球綠色氨市場規模、佔有率、趨勢和成長分析報告(2026-2034年)
 全球綠色氨市場:預測(至2034年)-依生產技術、再生能源來源、工廠產能、分銷/物流、應用、最終用戶和地區進行分析
 綠色氨市場-全球產業規模、佔有率、趨勢、機會及預測(依生產方法、最終用途、區域及競爭格局分類,2021-2031年)
 全球綠色氨市場,2026-2030年
 日本綠色氨市場報告(按技術(質子交換膜、鹼性水電解、固體氧化物電解)、最終用戶(發電、交通運輸、化肥、製冷及其他)和地區分類,2026-2034年)