

 |
市場調查報告書
商品編碼
1885911
資料中心基礎設施市場機會、成長促進因素、產業趨勢分析及預測(2025-2034年)Data Center Infrastructure Market Opportunity, Growth Drivers, Industry Trend Analysis, and Forecast 2025 - 2034 |
||||||
2024 年全球資料中心基礎設施市場價值為 682 億美元,預計到 2034 年將以 13.4% 的複合年成長率成長至 2,348 億美元。
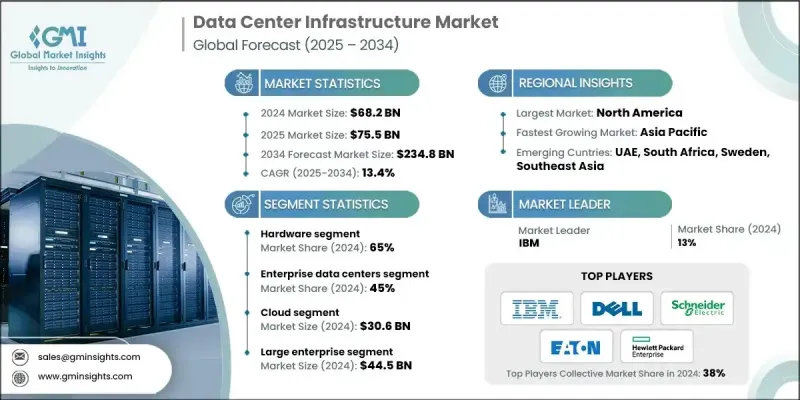
人工智慧工作負載的日益普及、超大規模雲端的成長以及企業數位轉型推動了市場擴張。對高密度機架、專用伺服器、GPU 和加速器的需求不斷成長,正在重塑電力分配、冷卻和網路互連的要求。政府推行的數位化、智慧城市和數據驅動治理等舉措,正在推動更多資料中心的建設,以提高在高工作負載需求下的效率、安全性和創新能力。業界正從傳統的 x86 架構轉向客製化晶片和專為人工智慧和機器學習任務量身定做的專用加速器。超大規模營運商正在投資採用客製化處理器和人工智慧加速器的專有伺服器設計,以最佳化效能、能源效率和整體擁有成本。邊緣資料中心的經濟效益與超大規模部署存在顯著差異,而對節能、低碳營運的追求正迫使營運商採用再生能源、熱能再利用策略以及更嚴格的能源績效標準。
| 市場範圍 | |
|---|---|
| 起始年份 | 2024 |
| 預測年份 | 2025-2034 |
| 起始值 | 682億美元 |
| 預測值 | 2348億美元 |
| 複合年成長率 | 13.4% |
硬體領域在2024年佔據65%的市場佔有率,預計從2025年到2034年將以12.7%的複合年成長率成長。該領域包括伺服器、儲存系統、網路設備、電源分配單元(PDU)、不間斷電源(UPS)、冷卻基礎設施、機架和機箱。硬體需要大量的資本投入和頻繁的技術更新換代,才能在不斷變化的工作負載中保持效率和效能。
企業資料中心在2024年佔據了45%的市場佔有率,預計在2025年至2034年間將以12.6%的複合年成長率成長。這些由企業內部營運、用於支援IT營運的設施仍然是最大的細分市場,但隨著企業向託管和公有雲平台遷移,其市場佔有率正在逐漸下降。許多企業資料中心由於基礎設施老舊和冷卻系統最佳化不足,其電源使用效率(PUE)值高於1.8-2.0,這為提高效率提供了空間。
北美資料中心基礎設施市場佔據38%的市場佔有率,預計2024年市場規模將達到263億美元。該地區受益於眾多超大規模營運商、科技公司、金融機構和數位基礎設施企業的強大佈局。受人工智慧基礎設施投資的推動,美國市場預計將快速擴張,資料中心電力需求預計將從2024年的約4吉瓦成長到2035年的123吉瓦。
全球資料中心基礎設施市場的主要參與者包括伊頓、聯想集團、惠普企業(HPE)、思科系統、ABB、IBM、戴爾、富士通、施耐德電氣和華為技術有限公司。這些企業正透過專注於高效能伺服器、先進冷卻解決方案和下一代網路設備的研發來鞏固其市場地位。與雲端服務供應商和企業客戶的策略合作有助於他們根據特定的工作負載需求客製化解決方案。向新興市場進行地域擴張以及收購科技新創公司也有助於擴大市場覆蓋範圍。此外,各公司也正在投資節能設計、低碳營運和人工智慧監控系統,以提高效能、降低營運成本並符合監管標準。提供全面的服務和維護合約以及培訓計劃,能夠進一步增強客戶忠誠度並鞏固競爭優勢。
目錄
第1章:方法論與範圍
第2章:執行概要
第3章:行業洞察
- 產業生態系分析
- 供應商格局
- 零件製造商
- 系統整合商和分銷商
- 設施營運商和服務提供者
- 最終用戶和企業
- 成本結構
- 利潤率
- 每個階段的價值增加
- 垂直整合趨勢
- 顛覆者
- 供應商格局
- 對力的影響
- 成長促進因素
- 人工智慧和超大規模運算需求
- 雲端遷移和持續的超大規模/邊緣部署
- 提高能源效率和電力可靠性的現代化改造
- 更重視永續發展和替代能源採購
- 產業陷阱與挑戰
- 電力和電網限制
- 供應鏈、成本上漲和技能短缺
- 市場機遇
- 客製化矽晶圓和架構轉變
- 邊緣密集化和分散式佈局
- 成長促進因素
- 技術趨勢與創新生態系統
- 目前技術
- 人工智慧最佳化基礎設施
- 液冷技術
- 後門熱交換器
- 晶片直接冷卻
- 新興技術
- 矽光子學與高速互連
- 量子運算基礎設施需求
- 神經形態運算基礎設施
- 模組化和預製資料中心
- 技術成熟度(TRL)評估
- TRL框架概述
- 液冷技術
- 人工智慧專用基礎設施
- 量子運算基礎設施
- 目前技術
- 成長潛力分析
- 監管環境
- 數據主權和本地化要求
- 環境與永續發展法規
- 建築規範與安全標準
- 區域監管比較
- 北美洲
- 歐洲
- 亞太
- 拉丁美洲
- 中東和非洲
- 波特的分析
- PESTEL 分析
- 專利分析
- 成本細分分析
- 價格趨勢
- 硬體組件價格趨勢
- 零售價與批發價
- 冷卻技術成本比較
- 總擁有成本(TCO)模型框架
- 電力和能源基礎設施
- 再生能源購電協議
- 各區域的電網容量限制
- 電力採購策略框架
- 區域電力可用性評估
- 專利分析
- 按技術領域分類的專利申請趨勢
- 軟體定義基礎設施專利
- 開源技術與專有技術分析
- 專利地理分佈
- 永續性和環境方面
- 循環經濟與電子垃圾管理
- 再生能源投資回報
- 範圍 1、2、3 排放追蹤
- 永續發展報告標準
- 投資與融資分析
- 創投趨勢
- 超大規模資本支出趨勢
- 託管服務提供者擴張投資
- 按技術類別分類的投資
- 永續發展掛鉤融資
- 用例分析及應用場景
- 人工智慧訓練基礎設施用例
- 加強學習基礎設施
- 高效能運算用例
- 5G邊緣應用
- 碳中和資料中心營運
- 客戶和最終用戶洞察
- 首席資訊長/技術長概況及優先事項
- 客戶旅程圖
- 客戶滿意度和淨推薦值
- 客戶痛點和未滿足的需求
- 市場採納與滲透分析
- 技術採納曲線
- 超融合基礎設施滲透
- 按行業垂直領域分類的滲透率
- 地理採納差異
第4章:競爭格局
- 介紹
- 公司市佔率分析
- 北美洲
- 歐洲
- 亞太
- 拉丁美洲
- 中東和非洲
- 競爭定位矩陣
- 戰略展望矩陣
- 關鍵進展
- 併購
- 合作夥伴關係與合作
- 新產品發布
- 擴張計劃和資金
- 高階定位策略
- 策略性OEM合作夥伴關係機會
- 競爭分析與獨特賣點
第5章:市場估算與預測:依組件分類,2021-2034年
- 主要趨勢
- 硬體
- 實體基礎設施硬體
- IT設備和伺服器
- 儲存系統和陣列
- 網路硬體元件
- 電源和散熱硬體
- 軟體
- 基礎設施管理軟體
- 虛擬化和虛擬機管理程式軟體
- 安全與合規軟體
- 監控和分析平台
- 自動化和編排工具
- 服務
- 專業服務
- 託管服務
第6章:市場估算與預測:依產品分類,2021-2034年
- 主要趨勢
- 冷卻
- 空氣冷卻系統
- 電腦房空調(CRAC)
- 電腦房空氣處理(CRAH)
- 行內冷卻單元
- 頂置式冷卻系統
- 液冷解決方案
- 晶片直接冷卻
- 浸沒式冷卻系統
- 後門熱交換器
- 液體分配單元
- 混合冷卻架構
- 冷卻配件和組件
- 空氣冷卻系統
- 力量
- UPS
- 電源分配單元(PDU)
- 發電機和備用電源
- 電力監控管理系統
- IT機架和機櫃
- 伺服器機架和機櫃
- 網路設備機櫃
- 刀鋒伺服器機箱
- 左心室/二尖瓣分佈
- 開關設備及配電盤
- 變壓器和電源調節
- 公車專用道系統
- 電氣保護裝置
- 網路裝置
- 乙太網路交換機
- InfiniBand 交換機
- 路由器和閘道器
- 負載平衡器和類比數位轉換器
- DCIM
第7章:市場估算與預測:依資料中心分類,2021-2034年
- 主要趨勢
- 企業資料中心
- 託管資料中心
- 超大規模資料中心
- 邊緣資料中心
第8章:市場估算與預測:依部署方式分類,2021-2034年
- 主要趨勢
- 雲
- 混合
- 現場
第9章:市場估算與預測:依組織規模分類,2021-2034年
- 主要趨勢
- 大型企業
- 中小企業
第10章:市場估計與預測:依應用領域分類,2021-2034年
- 主要趨勢
- 金融服務業
- 託管
- 能源
- 政府
- 衛生保健
- 製造業
- 資訊科技與電信
- 其他
第11章:市場估計與預測:按地區分類,2021-2034年
- 北美洲
- 美國
- 加拿大
- 歐洲
- 英國
- 德國
- 法國
- 義大利
- 西班牙
- 比利時
- 荷蘭
- 瑞典
- 俄羅斯
- 亞太地區
- 中國
- 印度
- 日本
- 澳洲
- 新加坡
- 韓國
- 越南
- 印尼
- 拉丁美洲
- 巴西
- 墨西哥
- 阿根廷
- MEA
- 南非
- 沙烏地阿拉伯
- 阿拉伯聯合大公國
第12章:公司簡介
- 全球參與者
- ABB
- Cisco Systems
- Dell Technologies
- Eaton
- Hewlett Packard Enterprise (HPE)
- IBM
- Lenovo
- NetApp
- Schneider Electric
- Vertiv
- Regional champions
- Fujitsu
- Huawei
- Inspur
- Legrand
- Rittal
- 新興參與者與創新者
- AMD
- Arista Networks
- Liquidstack
- Micron
- Pure Storage
- Samsung Electronics
- Seagate Technology
- Super Micro Computer
- Western Digital Corporation (WDC)
- Wiwynn
The Global Data Center Infrastructure Market was valued at USD 68.2 billion in 2024 and is estimated to grow at a CAGR of 13.4% to reach USD 234.8 billion by 2034.
The market expansion is fueled by increasing adoption of artificial intelligence workloads, hyperscale cloud growth, and enterprise digital transformation. Rising demand for high-density racks, purpose-built servers, GPUs, and accelerators is reshaping power distribution, cooling, and network interconnect requirements. Government initiatives promoting digitization, smart cities, and data-driven governance are driving the construction of more data centers to improve efficiency, safety, and innovation under heavy workload demands. The industry is shifting from traditional x86 architectures to custom silicon and specialized accelerators tailored for AI and machine learning tasks. Hyperscale operators are investing in proprietary server designs with custom processors and AI accelerators to optimize performance, power efficiency, and total cost of ownership. Edge data center economics differ significantly from hyperscale deployments, while the push for energy-efficient, low-carbon operations is forcing operators to adopt renewable power sourcing, heat-reuse strategies, and stricter energy performance standards.
| Market Scope | |
|---|---|
| Start Year | 2024 |
| Forecast Year | 2025-2034 |
| Start Value | $68.2 Billion |
| Forecast Value | $234.8 Billion |
| CAGR | 13.4% |
The hardware segment held a 65% share in 2024 and is expected to grow at a CAGR of 12.7% from 2025 to 2034. This segment includes servers, storage systems, networking equipment, power distribution units (PDUs), uninterruptible power supplies (UPS), cooling infrastructure, racks, and enclosures. Hardware requires significant capital investment and frequent technology refresh cycles to maintain efficiency and performance across evolving workloads.
The enterprise data centers segment accounted for a 45% share in 2024 and is anticipated to grow at a CAGR of 12.6% between 2025 and 2034. These facilities, operated internally by organizations to support IT operations, remain the largest segment but are gradually declining as enterprises migrate toward colocation and public cloud platforms. Many enterprise data centers operate with power usage effectiveness (PUE) values above 1.8-2.0 due to legacy infrastructure and under-optimized cooling systems, presenting opportunities for efficiency improvements.
North America Data Center Infrastructure Market held 38% share, valued at USD 26.3 billion in 2024. The region benefits from a strong presence of hyperscale operators, technology firms, financial institutions, and digital infrastructure. The U.S. market is expected to expand rapidly due to AI infrastructure investments, with demand for data center power projected to increase from around 4 GW in 2024 to 123 GW by 2035.
Key players in the Global Data Center Infrastructure Market include Eaton, Lenovo Group, Hewlett Packard Enterprise (HPE), Cisco Systems, ABB, IBM, Dell, Fujitsu, Schneider Electric, and Huawei Technologies. Companies in the Data Center Infrastructure Market are strengthening their presence by focusing on R&D for high-efficiency servers, advanced cooling solutions, and next-generation networking equipment. Strategic partnerships with cloud providers and enterprise clients help them tailor solutions to specific workload requirements. Geographic expansion into emerging markets and acquisitions of technology startups enhance market reach. Firms are also investing in energy-efficient designs, low-carbon operations, and AI-enabled monitoring systems to improve performance, reduce operating costs, and comply with regulatory standards. Offering comprehensive service and maintenance contracts alongside training programs further builds customer loyalty and reinforces competitive positioning.
Table of Contents
Chapter 1 Methodology & Scope
- 1.1 Research design
- 1.1.1 Research approach
- 1.1.2 Data collection methods
- 1.2 Base estimates and calculations
- 1.2.1 Base year calculation
- 1.2.2 Key trends for market estimates
- 1.3 Forecast
- 1.4 Primary research and validation
- 1.5 Some of the primary sources
- 1.6 Data mining sources
- 1.6.1 Secondary
- 1.6.1.1 Paid Sources
- 1.6.1.2 Public Sources
- 1.6.1.3 Sources, by region
- 1.6.1 Secondary
- 1.7 Inclusion & Exclusion
Chapter 2 Executive Summary
- 2.1 Industry 360° synopsis
- 2.2 Key market trends
- 2.2.1 Regional
- 2.2.2 Component
- 2.2.3 Data Center
- 2.2.4 Deployment
- 2.2.5 Organization Size
- 2.2.6 Application
- 2.3 TAM Analysis, 2025-2034
- 2.4 CXO perspectives: Strategic imperatives
- 2.4.1 Key decision points for industry executives
- 2.4.2 Critical success factors for market players
- 2.5 Future outlook and strategic recommendations
Chapter 3 Industry Insights
- 3.1 Industry ecosystem analysis
- 3.1.1 Supplier landscape
- 3.1.1.1 Component manufacturers
- 3.1.1.2 System integrators & distributors
- 3.1.1.3 Facility operators & service providers
- 3.1.1.4 End use & enterprises
- 3.1.2 Cost structure
- 3.1.3 Profit margin
- 3.1.4 Value addition at each stage
- 3.1.5 Vertical integration trends
- 3.1.6 Disruptors
- 3.1.1 Supplier landscape
- 3.2 Impact on forces
- 3.2.1 Growth drivers
- 3.2.1.1 AI & Hyperscale compute demand
- 3.2.1.2 Cloud migration & continued hyperscaler/edge rollouts
- 3.2.1.3 Modernization for energy efficiency & power resiliency
- 3.2.1.4 Greater focus on sustainability & alternative energy sourcing
- 3.2.2 Industry pitfalls & challenges
- 3.2.2.1 Power & grid constraints
- 3.2.2.2 Supply-chain, cost inflation and skills shortages
- 3.2.3 Market opportunities
- 3.2.3.1 Custom silicon & architecture shift
- 3.2.3.2 Edge densification & distributed footprint
- 3.2.1 Growth drivers
- 3.3 Technology trends & innovation ecosystem
- 3.3.1 Current technologies
- 3.3.1.1 AI-optimized infrastructure
- 3.3.1.2 Liquid cooling technologies
- 3.3.1.3 Rear-door heat exchangers
- 3.3.1.4 Direct-to-chip cooling
- 3.3.2 Emerging technologies
- 3.3.2.1 Silicon photonics & high-speed interconnects
- 3.3.2.2 Quantum computing infrastructure requirements
- 3.3.2.3 Neuromorphic computing infrastructure
- 3.3.2.4 Modular & prefabricated data centers
- 3.3.3 Technology readiness level (TRL) assessment
- 3.3.3.1 TRL framework overview
- 3.3.3.2 Liquid cooling technologies
- 3.3.3.3 AI-specific infrastructure
- 3.3.3.4 Quantum computing infrastructure
- 3.3.1 Current technologies
- 3.4 Growth potential analysis
- 3.5 Regulatory landscape
- 3.5.1 Data sovereignty & localization requirements
- 3.5.2 Environmental & sustainability regulations
- 3.5.3 Building codes & safety standards
- 3.5.4 Regional regulatory comparison
- 3.5.4.1 North America
- 3.5.4.2 Europe
- 3.5.4.3 Asia-Pacific
- 3.5.4.4 Latin America
- 3.5.4.5 Middle East & Africa
- 3.6 Porter's analysis
- 3.7 PESTEL analysis
- 3.8 Patent analysis
- 3.9 Cost breakdown analysis
- 3.10 Price trends
- 3.10.1 Hardware component pricing trends
- 3.10.2 Retail vs wholesale pricing
- 3.10.3 Cooling technology cost comparison
- 3.10.4 Total cost of ownership (TCO) model framework
- 3.11 Power & energy infrastructure
- 3.11.1 Renewable energy power purchase agreements
- 3.11.2 Grid capacity constraints by region
- 3.11.3 Power procurement strategy framework
- 3.11.4 Regional power availability assessment
- 3.12 Patent analysis
- 3.12.1 Patent filing trends by technology area
- 3.12.2 Software-defined infrastructure patents
- 3.12.3 Open-source vs proprietary technology analysis
- 3.12.4 Geographic patent distribution
- 3.13 Sustainability and environmental aspects
- 3.13.1 Circular economy & e-waste management
- 3.13.2 Renewable energy investment returns
- 3.13.3 Scope 1, 2, 3 emissions tracking
- 3.13.4 Sustainability reporting standards
- 3.14 Investment & funding analysis
- 3.14.1 Venture capital investment trends
- 3.14.2 Hyperscale capital expenditure trends
- 3.14.3 Colocation provider expansion investment
- 3.14.4 Investment by technology category
- 3.14.5 Sustainability-linked financing
- 3.15 Use case analysis & application scenarios
- 3.15.1 AI training infrastructure use cases
- 3.15.2 Reinforcement of learning infrastructure
- 3.15.3 High-performance computing use cases
- 3.15.4. 5 G edge applications
- 3.15.5 Carbon-neutral data center operations
- 3.16 Customer & End use insights
- 3.16.1 CIO/CTO profile & priorities
- 3.16.2 Customer journey mapping
- 3.16.3 Customer satisfaction & net promoter score
- 3.16.4 Customer pain points & unmet needs
- 3.17 Market adoption & penetration analysis
- 3.17.1 Adoption curve by technology
- 3.17.2 Hyperconverged infrastructure penetration
- 3.17.3 Penetration rate by industry vertical
- 3.17.4 Geographic adoption variance
Chapter 4 Competitive Landscape, 2024
- 4.1 Introduction
- 4.2 Company market share analysis
- 4.2.1 North America
- 4.2.2 Europe
- 4.2.3 Asia-Pacific
- 4.2.4 Latin America
- 4.2.5 Middle East & Africa
- 4.3 Competitive positioning matrix
- 4.4 Strategic outlook matrix
- 4.5 Key developments
- 4.5.1 Mergers & acquisitions
- 4.5.2 Partnerships & collaborations
- 4.5.3 New product launches
- 4.5.4 Expansion plans and funding
- 4.6 Premium positioning strategies
- 4.7 Strategic OEM partnership opportunities
- 4.8 Competitive analysis and USPs
Chapter 5 Market Estimates & Forecast, By Component, 2021 - 2034 ($Bn)
- 5.1 Key trends
- 5.2 Hardware
- 5.2.1 Physical infrastructure hardware
- 5.2.2 IT equipment and servers
- 5.2.3 Storage systems and arrays
- 5.2.4 Networking hardware components
- 5.2.5 Power and cooling hardware
- 5.3 Software
- 5.3.1 Infrastructure management software
- 5.3.2 Virtualization and hypervisor software
- 5.3.3 Security and compliance software
- 5.3.4 Monitoring and analytics platforms
- 5.3.5 Automation and orchestration tools
- 5.4 Services
- 5.4.1 Professional services
- 5.4.2 Managed services
Chapter 6 Market Estimates & Forecast, By Product, 2021 - 2034 ($Bn)
- 6.1 Key trends
- 6.2 Cooling
- 6.2.1 Air-based cooling systems
- 6.2.1.1 Computer room air conditioning (CRAC)
- 6.2.1.2 Computer room air handling (CRAH)
- 6.2.1.3 In-row cooling units
- 6.2.1.4 Overhead cooling systems
- 6.2.2 Liquid cooling solutions
- 6.2.2.1 Direct-to-chip cooling
- 6.2.2.2 Immersion cooling systems
- 6.2.2.3 Rear door heat exchangers
- 6.2.2.4 Liquid distribution units
- 6.2.3 Hybrid cooling architectures
- 6.2.4 Cooling accessories and components
- 6.2.1 Air-based cooling systems
- 6.3 Power
- 6.3.1 UPS
- 6.3.2 Power Distribution Units (PDUs)
- 6.3.3 Generators and backup power
- 6.3.4 Power monitoring and management system
- 6.4 IT racks & enclosures
- 6.4.1 Server racks and cabinets
- 6.4.2 Network equipment enclosures
- 6.4.3 Blade server chassis
- 6.5 LV/MV distribution
- 6.5.1 Switchgear and distribution panels
- 6.5.2 Transformers and power conditioning
- 6.5.3 Busway system
- 6.5.4 Electrical protection devices
- 6.6 Networking equipment
- 6.6.1 Ethernet switches
- 6.6.2 InfiniBand switches
- 6.6.3 Routers and gateways
- 6.6.4 Load balancers and ADCs
- 6.7 DCIM
Chapter 7 Market Estimates & Forecast, By Data Center, 2021 - 2034 ($Bn)
- 7.1 Key trends
- 7.2 Enterprise data centers
- 7.3 colocation data centers
- 7.4 hyperscale data centers
- 7.5 edge data centers
Chapter 8 Market Estimates & Forecast, By Deployment, 2021 - 2034 ($Bn)
- 8.1 Key trends
- 8.2 Cloud
- 8.3 Hybrid
- 8.4 On-premises
Chapter 9 Market Estimates & Forecast, By Organization Size, 2021 - 2034 ($Bn)
- 9.1 Key trends
- 9.2 Large Enterprise
- 9.3 SME
Chapter 10 Market Estimates & Forecast, By Application, 2021 - 2034 ($Bn)
- 10.1 Key trends
- 10.2 BFSI
- 10.3 Colocation
- 10.4 Energy
- 10.5 Government
- 10.6 Healthcare
- 10.7 Manufacturing
- 10.8 IT & telecom
- 10.9 Others
Chapter 11 Market Estimates & Forecast, By Region, 2021 - 2034 ($Bn)
- 11.1 North America
- 11.1.1 US
- 11.1.2 Canada
- 11.2 Europe
- 11.2.1 UK
- 11.2.2 Germany
- 11.2.3 France
- 11.2.4 Italy
- 11.2.5 Spain
- 11.2.6 Belgium
- 11.2.7 Netherlands
- 11.2.8 Sweden
- 11.2.9 Russia
- 11.3 Asia Pacific
- 11.3.1 China
- 11.3.2 India
- 11.3.3 Japan
- 11.3.4 Australia
- 11.3.5 Singapore
- 11.3.6 South Korea
- 11.3.7 Vietnam
- 11.3.8 Indonesia
- 11.4 Latin America
- 11.4.1 Brazil
- 11.4.2 Mexico
- 11.4.3 Argentina
- 11.5 MEA
- 11.5.1 South Africa
- 11.5.2 Saudi Arabia
- 11.5.3 UAE
Chapter 12 Company Profiles
- 12.1 Global players
- 12.1.1 ABB
- 12.1.2 Cisco Systems
- 12.1.3 Dell Technologies
- 12.1.4 Eaton
- 12.1.5 Hewlett Packard Enterprise (HPE)
- 12.1.6 IBM
- 12.1.7 Lenovo
- 12.1.8 NetApp
- 12.1.9 Schneider Electric
- 12.1.10 Vertiv
- 12.2 Regional champions
- 12.2.1 Fujitsu
- 12.2.2 Huawei
- 12.2.3 Inspur
- 12.2.4 Legrand
- 12.2.5 Rittal
- 12.3 Emerging players & innovators
- 12.3.1 AMD
- 12.3.2 Arista Networks
- 12.3.3 Liquidstack
- 12.3.4 Micron
- 12.3.5 Pure Storage
- 12.3.6 Samsung Electronics
- 12.3.7 Seagate Technology
- 12.3.8 Super Micro Computer
- 12.3.9 Western Digital Corporation (WDC)
- 12.3.10 Wiwynn
 2026年全球資料中心(DCIM)服務市場報告
 資料中心基礎設施管理(DCIM):市場佔有率分析、產業趨勢與統計資料、成長預測(2026-2031)
 全球資料中心基礎設施管理 (DCIM) 市場預測至 2034 年:按元件、功能、部署類型、資料中心類型、應用程式、最終用戶和地區分類全球資料中心電氣基礎設施服務市場預測(至2034年),依電氣系統類型、等級分類、電力容量、資料中心類別、最終使用者和地區分類全球資料中心電氣設備試運行市場:預測(至 2034 年)—按試運行類型、試運行級別、電氣系統、資料中心類型、服務供應商類型、最終用戶和地區進行分析全球超大規模資料中心擴建市場:預測(至 2034 年)-按元件、資料中心類型、部署方式、IT 架構、最終使用者和區域進行分析
 整合資料中心基礎設施市場 - 全球產業規模、佔有率、趨勢、機會及預測(按部署方式、組件、設施、地區和競爭格局分類),2021-2031年
 資料中心基礎設施市場規模、佔有率和成長分析(按產品、組件、資料中心、部署方式、企業規模、應用和地區分類)—產業預測,2026-2033年
 資料中心基礎設施管理 (DCIM) 市場機會、成長促進因素、產業趨勢分析及預測(2025-2034 年)
 資料中心基礎設施市場按組件、資料中心類型、產業和地區分類