


 |
市場調查報告書
商品編碼
1885909
車輛即服務市場機會、成長促進因素、產業趨勢分析及預測(2025-2034年)Vehicle as a Service Market Opportunity, Growth Drivers, Industry Trend Analysis, and Forecast 2025 - 2034 |
||||||
2024 年全球汽車即服務市場價值為 105 億美元,預計到 2034 年將以 20.7% 的複合年成長率成長至 773 億美元。
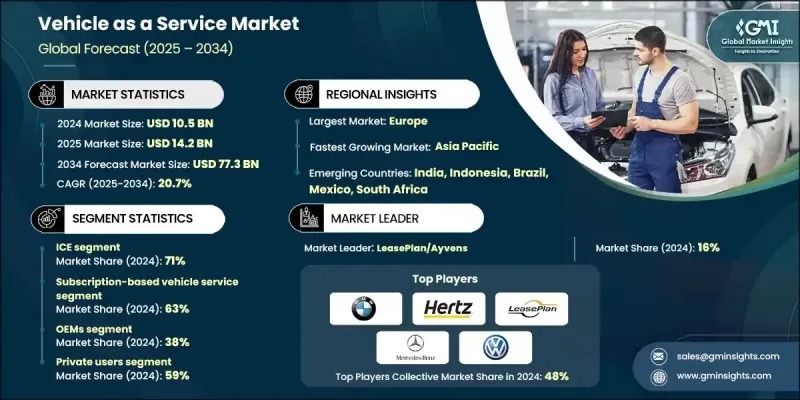
消費者和企業越來越重視車輛的使用,同時又不希望承擔車輛所有權的負擔,例如長期合約、保險、維護和高昂的購買成本。訂閱和按需付費模式透過提供靈活的按需出行解決方案,滿足了這些需求。城市化進程加快、科技普及以及數位平台的日益融合,正在推動車輛即服務(VaaS)的普及,尤其是在大都市地區。全球對電動車(EV)的大力推廣進一步加速了VaaS的成長,因為電動車隊具有營運成本更低、環境效益更佳以及潛在的政府激勵措施等優勢。企業也正在利用車隊即服務(Fleet-as-a-Service)模式來降低營運複雜性並避免資本支出,從而獲得車輛使用權,同時將維修、保險和車隊管理外包出去。隨著城市出行方式的演變,VaaS正逐漸成為提高成本效益、實現永續性和便利性的策略工具。
| 市場範圍 | |
|---|---|
| 起始年份 | 2024 |
| 預測年份 | 2025-2034 |
| 起始值 | 105億美元 |
| 預測值 | 773億美元 |
| 複合年成長率 | 20.7% |
2024年,基於訂閱的車輛服務市場佔據63%的市場佔有率,預計到2034年將以20.2%的複合年成長率成長。訂閱模式提供靈活、捆綁式且無需長期合約的車輛使用權,對消費者和企業都極具吸引力。按次付費服務則是針對偶爾用車的用戶,提供由需求演算法最佳化的單次行程定價。如今,整合出行平台將車輛即服務(VaaS)與公共交通和微出行解決方案相結合,實現了無縫的多模式規劃和統一支付。
預計到2024年,汽車OEM廠商將佔據38%的市場佔有率,並預計在2034年之前以20.1%的複合年成長率成長。 OEM廠商正利用品牌信任度、經銷商網路和車輛供應優勢推出出行服務。汽車科技平台則透過數位化優先的解決方案、簡化車輛取得流程和提升客戶體驗來推動成長。
預計2024年,美國車輛即服務市場規模將達27.4億美元。消費者對無車出行方式的需求日益成長,推動了訂閱和按需付費模式的發展。這些模式降低了車輛使用門檻,提供了更靈活的車型選擇,最佳化了車隊利用率,同時為服務提供者帶來持續收入並提升了客戶參與度。
車輛即服務 (VaaS) 市場的主要參與者包括寶馬、現代、梅賽德斯-奔馳、大眾、Sixt、赫茲、LeasePlan/Ayvens 和 Care by Volvo。為了鞏固自身地位,VaaS 市場的企業正致力於拓展訂閱和按次付費服務,將電動車整合到車隊中,並利用數位化平台打造無縫的客戶體驗。他們正與汽車製造商、科技公司和旅遊服務提供者建立策略聯盟,以擴大營運規模並提升服務覆蓋範圍。車隊最佳化、預測性維護和動態定價模式的運用旨在實現利潤最大化,而對電動車基礎設施和永續發展項目的投資則鞏固了其長期成長。此外,企業也透過精準行銷活動、會員忠誠度計畫和個人化服務選項來吸引和留住客戶,從而確保更穩固的市場地位和競爭優勢。
目錄
第1章:方法論
- 市場範圍和定義
- 研究設計
- 研究方法
- 資料收集方法
- 資料探勘來源
- 全球的
- 地區/國家
- 基準估算和計算
- 基準年計算
- 市場估算的關鍵趨勢
- 初步研究和驗證
- 原始資料
- 預測模型
- 研究假設和局限性
第2章:執行概要
第3章:行業洞察
- 產業生態系分析
- 供應商格局
- 利潤率
- 成本結構
- 每個階段的價值增加
- 影響價值鏈的因素
- 中斷
- 產業影響因素
- 成長促進因素
- 偏好靈活移動而非所有權
- 電動車普及率不斷提高,車隊電氣化程度也不斷提高。
- 企業車隊需求不斷成長
- 連網汽車和遠端資訊處理技術的進步
- 產業陷阱與挑戰
- 高額資本投資
- 監理和保險方面的挑戰
- 市場機遇
- 新興城市市場的擴張
- 與智慧城市和旅遊即服務 (MaaS) 平台整合
- 包含保險和維護的捆綁服務
- 專業電動車和商用車解決方案
- 成長促進因素
- 成長潛力分析
- 監管環境
- 北美洲
- 歐洲
- 亞太地區
- 拉丁美洲
- 中東和非洲
- 波特的分析
- PESTEL 分析
- 技術與創新格局
- 當前技術趨勢
- 遠端資訊處理與物聯網整合
- 人工智慧與預測分析
- 自動駕駛系統(SAE 3-5級)
- 新興技術
- 數位鑰匙和無鑰匙存取技術
- 用於智慧合約和支付的區塊鏈
- 5G 連接和 V2X 通訊
- 當前技術趨勢
- 價格趨勢
- 定價模式清晰度
- 按分鐘、按小時和按天計費
- 訂閱等級和隱藏費用
- 動態/高峰定價認知
- 全包價格與明細價格
- 價格敏感度
- 總擁有成本(TCO)
- 按服務類型分類的定價模式
- 成本比較:擁有權與虛擬航空即服務 (VaaS)
- 動態/高峰定價機制
- 訂閱等級評估
- 不同地區的定價差異
- 定價模式清晰度
- 成本細分分析
- 專利分析
- 永續性和環境方面
- 永續實踐
- 減少廢棄物策略
- 生產中的能源效率
- 環保舉措
- 碳足跡考量
- 消費者行為與採納模式
- 人口統計分析
- 採用虛擬即服務 (VaaS) 的動機
- 收養障礙
- 使用頻率和出行模式
- 多模式出行行為
- 品牌忠誠度和轉換
- 數位轉型與資料分析
- 車載資訊系統和物聯網資料
- 預測分析與機器學習
- 巨量資料基礎設施
- 資料隱私與安全
- API經濟與整合
- 客戶獲取與留存經濟學
- 客戶獲取成本 (CAC)
- 客戶生命週期價值(LTV)
- 單位經濟效益和獲利能力
- 流失率與留存率
- 會員忠誠計劃
- 補貼依賴性
- 供應鏈脆弱性與風險
- 車輛購買風險
- 電動車電池風險
- 充電基礎設施風險
- 技術與軟體風險
- 維護和服務風險
- 地緣政治和監管風險
第4章:競爭格局
- 介紹
- 公司市佔率分析
- 北美洲
- 歐洲
- 亞太地區
- 拉丁美洲
- MEA
- 主要市場參與者的競爭分析
- 競爭定位矩陣
- 戰略展望矩陣
- 關鍵進展
- 併購
- 合作夥伴關係與合作
- 新產品發布
- 擴張計劃和資金
- 產品和服務基準測試
- 服務模式比較
- 定價結構分析
- 技術平台功能
- 客戶體驗和使用者介面
- 車輛車隊構成和質量
- 供應商選擇標準
第5章:市場估算與預測:依引擎類型分類,2021-2034年
- 主要趨勢
- 電動車(EV)
- 電池電動車(BEV)
- 插電式混合動力車(PHEV)
- 內燃機(ICE)汽車
- 汽油
- 柴油引擎
第6章:市場估算與預測:依服務模式分類,2021-2034年
- 主要趨勢
- 基於訂閱的車輛服務
- 按使用量付費/按使用次數付費的車輛服務
- 車隊即服務 (FaaS)
- 電動汽車即服務
- 整合式旅遊即服務 (MaaS)
第7章:市場估算與預測:依服務提供者分類,2021-2034年
- 主要趨勢
- 汽車原廠設備製造商
- 汽車經銷商/經銷商集團
- 汽車科技新創公司與旅遊公司
- 汽車訂閱軟體供應商/平台供應商
- 租賃和金融服務公司
第8章:市場估算與預測:依最終用途分類,2021-2034年
- 主要趨勢
- 企業用戶
- 私人用戶
第9章:市場估價與預測:依車輛類型分類,2021-2034年
- 主要趨勢
- 搭乘用車
- 掀背車
- 轎車
- SUV
- 商用車輛
- 低容量性狀
- MCV
- C型肝炎
- 二輪車
- 特種及多用途車輛
第10章:市場估計與預測:依地區分類,2021-2034年
- 主要趨勢
- 北美洲
- 美國
- 加拿大
- 歐洲
- 德國
- 英國
- 法國
- 義大利
- 西班牙
- 北歐
- 俄羅斯
- 亞太地區
- 中國
- 印度
- 日本
- 韓國
- 澳新銀行
- 越南
- 印尼
- 拉丁美洲
- 巴西
- 墨西哥
- 阿根廷
- MEA
- 南非
- 沙烏地阿拉伯
- 阿拉伯聯合大公國
第11章:公司簡介
- Global companies
- ARI Fleet Management
- BMW
- Care by Volvo
- Element Fleet Management
- Hertz
- Hyundai
- LeasePlan/Ayvens
- Mercedes-Benz
- Penske Truck Leasing
- Ryder System
- Sixt
- Turo
- Volkswagen
- Waymo
- Wheels
- Zipcar
- 區域玩家
- Emkay
- Lime
- Merchants Fleet
- Mike Albert Fleet Solutions
- PacLease
- 新興玩家
- Finn Auto
- Porsche Drive
The Global Vehicle as a Service Market was valued at USD 10.5 billion in 2024 and is estimated to grow at a CAGR of 20.7% to reach USD 77.3 billion by 2034.
Consumers and businesses are increasingly prioritizing access to vehicles without the burdens of ownership, such as long-term commitments, insurance, maintenance, and high purchase costs. Subscription and pay-per-use models are meeting these needs by providing flexible, on-demand mobility solutions. Rising urbanization, tech-savvy populations, and the increasing integration of digital platforms are driving adoption, especially in metropolitan areas. The global push toward electric vehicles (EVs) is further accelerating VaaS growth, as EV fleets offer lower operational costs, environmental benefits, and potential government incentives. Organizations are also leveraging Fleet-as-a-Service models to reduce operational complexity and avoid capital expenditure, gaining access to vehicles while outsourcing maintenance, insurance, and fleet management. As urban mobility evolves, VaaS is emerging as a strategic tool for cost efficiency, sustainability, and convenience.
| Market Scope | |
|---|---|
| Start Year | 2024 |
| Forecast Year | 2025-2034 |
| Start Value | $10.5 Billion |
| Forecast Value | $77.3 Billion |
| CAGR | 20.7% |
The subscription-based vehicle service segment held a 63% share in 2024 and is expected to grow at a CAGR of 20.2% through 2034. Subscription models provide flexible, bundled, and commitment-free vehicle access, appealing to both consumers and businesses. Pay-per-use services target occasional users, offering cost-per-trip pricing optimized by demand algorithms. Integrated mobility platforms now combine VaaS with public transit and micromobility solutions, enabling seamless multimodal planning and unified payments.
The automotive OEMs segment held a 38% share in 2024 and is forecast to grow at a CAGR of 20.1% through 2034. OEMs are capitalizing on brand trust, dealer networks, and vehicle supply to launch mobility services. Auto-tech platforms are driving growth with digital-first solutions, streamlining vehicle access, and enhancing customer experience.
U.S. Vehicle as a Service Market reached USD 2.74 billion in 2024. Growing consumer preference for mobility without ownership is boosting subscription and pay-per-use models. These options reduce barriers to vehicle access, offer flexibility in vehicle type selection, and optimize fleet utilization, while generating recurring revenue and increasing customer engagement for providers.
Key players in the Vehicle as a Service Market include BMW, Hyundai, Mercedes-Benz, Volkswagen, Sixt, Hertz, LeasePlan/Ayvens, and Care by Volvo. To strengthen their position, companies in the Vehicle as a Service Market are focusing on expanding subscription and pay-per-use offerings, integrating EVs into fleets, and leveraging digital platforms for seamless customer experience. They are building strategic alliances with automotive manufacturers, tech firms, and mobility providers to scale operations and enhance service coverage. Fleet optimization, predictive maintenance, and dynamic pricing models are being adopted to maximize profitability, while investments in EV infrastructure and sustainability programs reinforce long-term growth. Companies are also using targeted marketing campaigns, loyalty programs, and personalized service options to attract and retain customers, ensuring a stronger market foothold and competitive advantage.
Table of Contents
Chapter 1 Methodology
- 1.1 Market scope and definition
- 1.2 Research design
- 1.2.1 Research approach
- 1.2.2 Data collection methods
- 1.3 Data mining sources
- 1.3.1 Global
- 1.3.2 Regional/Country
- 1.4 Base estimates and calculations
- 1.4.1 Base year calculation
- 1.4.2 Key trends for market estimation
- 1.5 Primary research and validation
- 1.5.1 Primary sources
- 1.6 Forecast model
- 1.7 Research assumptions and limitations
Chapter 2 Executive Summary
- 2.1 Industry 3600 synopsis
- 2.2 Key market trends
- 2.2.1 Regional
- 2.2.2 Engine
- 2.2.3 Service model
- 2.2.4 Service provider
- 2.2.5 End use
- 2.2.6 Vehicle
- 2.3 TAM analysis, 2025-2034
- 2.4 CXO perspectives: Strategic imperatives
- 2.4.1 Executive decision points
- 2.4.2 Critical success factors
- 2.5 Future outlook
- 2.6 Strategic recommendations
Chapter 3 Industry Insights
- 3.1 Industry ecosystem analysis
- 3.1.1 Supplier landscape
- 3.1.2 Profit margin
- 3.1.3 Cost structure
- 3.1.4 Value addition at each stage
- 3.1.5 Factor affecting the value chain
- 3.1.6 Disruptions
- 3.2 Industry impact forces
- 3.2.1 Growth drivers
- 3.2.1.1 Preference for flexible mobility over ownership
- 3.2.1.2 Growing EV adoption and fleet electrification
- 3.2.1.3 Rising corporate fleet demand
- 3.2.1.4 Connected vehicle and telematics advancements
- 3.2.2 Industry pitfalls and challenges
- 3.2.2.1 High capital investment
- 3.2.2.2 Regulatory and insurance challenges
- 3.2.3 Market opportunities
- 3.2.3.1 Expansion in emerging urban markets
- 3.2.3.2 Integration with smart cities and MaaS platforms
- 3.2.3.3 Bundled services with insurance and maintenance
- 3.2.3.4 Specialized EV and commercial vehicle solutions
- 3.2.1 Growth drivers
- 3.3 Growth potential analysis
- 3.4 Regulatory landscape
- 3.4.1 North America
- 3.4.2 Europe
- 3.4.3 Asia Pacific
- 3.4.4 Latin America
- 3.4.5 Middle East & Africa
- 3.5 Porter's analysis
- 3.6 PESTEL analysis
- 3.7 Technology and innovation landscape
- 3.7.1 Current technological trends
- 3.7.1.1 Telematics & IoT integration
- 3.7.1.2 Artificial intelligence & predictive analytics
- 3.7.1.3 Autonomous driving systems (SAE Level 3-5)
- 3.7.2 Emerging technologies
- 3.7.2.1 Digital key & keyless access technologies
- 3.7.2.2 Blockchain for smart contracts & payments
- 3.7.2.3 5G connectivity & V2X communication
- 3.7.1 Current technological trends
- 3.8 Price trends
- 3.8.1 Pricing model clarity
- 3.8.1.1 Per-minute vs hourly vs daily pricing
- 3.8.1.2 Subscription tiers & hidden fees
- 3.8.1.3 Dynamic/surge pricing perceptions
- 3.8.1.4 All-inclusive vs itemized pricing
- 3.8.2 Price sensitivity
- 3.8.3 Total cost of ownership (TCO)
- 3.8.4 Pricing models by service type
- 3.8.5 Cost comparison: ownership vs VaaS
- 3.8.6 Dynamic/surge pricing mechanisms
- 3.8.7 Subscription tier evaluation
- 3.8.8 Pricing variations across regions
- 3.8.1 Pricing model clarity
- 3.9 Cost breakdown analysis
- 3.10 Patent analysis
- 3.11 Sustainability and environmental aspects
- 3.11.1 Sustainable practices
- 3.11.2 Waste reduction strategies
- 3.11.3 Energy efficiency in production
- 3.11.4 Eco-friendly initiatives
- 3.11.5 Carbon footprint considerations
- 3.12 Consumer behavior & adoption patterns
- 3.12.1 Demographic analysis
- 3.12.2 Motivations for VaaS adoption
- 3.12.3 Barriers to adoption
- 3.12.4 Usage frequency & trip patterns
- 3.12.5 Multi-modal mobility behavior
- 3.12.6 Brand loyalty & switching
- 3.13 Digital transformation & data analytics
- 3.13.1 Telematics & IoT data
- 3.13.2 Predictive Analytics & ML
- 3.13.3 Big data infrastructure
- 3.13.4 Data privacy & security
- 3.13.5 API economy & integration
- 3.14 Customer acquisition & retention economics
- 3.14.1 Customer Acquisition Cost (CAC)
- 3.14.2 Customer Lifetime Value (LTV)
- 3.14.3 Unit economics & profitability
- 3.14.4 Churn & retention
- 3.14.5 Loyalty programs
- 3.14.6 Subsidy dependency
- 3.15 Supply chain vulnerabilities & risks
- 3.15.1 Vehicle procurement risks
- 3.15.2 EV battery risks
- 3.15.3 Charging infrastructure risks
- 3.15.4 Technology & software risks
- 3.15.5 Maintenance & service risks
- 3.15.6 Geopolitical & regulatory risks
Chapter 4 Competitive Landscape, 2024
- 4.1 Introduction
- 4.2 Company market share analysis
- 4.2.1 North America
- 4.2.2 Europe
- 4.2.3 Asia Pacific
- 4.2.4 LATAM
- 4.2.5 MEA
- 4.3 Competitive analysis of major market players
- 4.4 Competitive positioning matrix
- 4.5 Strategic outlook matrix
- 4.6 Key developments
- 4.6.1 Mergers & acquisitions
- 4.6.2 Partnerships & collaborations
- 4.6.3 New product launches
- 4.6.4 Expansion plans and funding
- 4.7 Product and service benchmarking
- 4.7.1 Service model comparison
- 4.7.2 Pricing structure analysis
- 4.7.3 Technology platform capabilities
- 4.7.4 Customer experience and user interface
- 4.7.5 Vehicle fleet composition and quality
- 4.8 Vendor selection criteria
Chapter 5 Market Estimates & Forecast, By Engine, 2021 - 2034 ($Mn)
- 5.1 Key trends
- 5.2 Electric vehicles (EVs)
- 5.2.1 Battery electric vehicles (BEVs)
- 5.2.2 Plug-in hybrid electric vehicles (PHEVs)
- 5.3 Internal combustion engine (ICE) vehicles
- 5.3.1 Gasoline
- 5.3.2 Diesel
Chapter 6 Market Estimates & Forecast, By Service Model, 2021 - 2034 ($Mn)
- 6.1 Key trends
- 6.2 Subscription-based vehicle service
- 6.3 Pay-per-use / usage-based vehicle service
- 6.4 Fleet-as-a-service (FaaS)
- 6.5 EV-as-a-service
- 6.6 Integrated mobility-as-a-service (MaaS)
Chapter 7 Market Estimates & Forecast, By Service Provider, 2021 - 2034 ($Mn)
- 7.1 Key trends
- 7.2 Automotive OEMs
- 7.3 Auto dealerships / dealer groups
- 7.4 Auto-tech startups & mobility companies
- 7.5 Car subscription software providers / platform providers
- 7.6 Leasing & financial services companies
Chapter 8 Market Estimates & Forecast, By End Use, 2021 - 2034 ($Mn)
- 8.1 Key trends
- 8.2 Enterprise users
- 8.3 Private users
Chapter 9 Market Estimates & Forecast, By Vehicle, 2021 - 2034 ($Mn)
- 9.1 Key trends
- 9.2 Passenger cars
- 9.2.1 Hatchback
- 9.2.2 Sedan
- 9.2.3 SUV
- 9.3 Commercial vehicles
- 9.3.1 LCV
- 9.3.2 MCV
- 9.3.3 HCV
- 9.4 Two-wheelers
- 9.5 Specialty & utility vehicles
Chapter 10 Market Estimates & Forecast, By Region, 2021 - 2034 ($Mn)
- 10.1 Key trends
- 10.2 North America
- 10.2.1 US
- 10.2.2 Canada
- 10.3 Europe
- 10.3.1 Germany
- 10.3.2 UK
- 10.3.3 France
- 10.3.4 Italy
- 10.3.5 Spain
- 10.3.6 Nordics
- 10.3.7 Russia
- 10.4 Asia Pacific
- 10.4.1 China
- 10.4.2 India
- 10.4.3 Japan
- 10.4.4 South Korea
- 10.4.5 ANZ
- 10.4.6 Vietnam
- 10.4.7 Indonesia
- 10.5 Latin America
- 10.5.1 Brazil
- 10.5.2 Mexico
- 10.5.3 Argentina
- 10.6 MEA
- 10.6.1 South Africa
- 10.6.2 Saudi Arabia
- 10.6.3 UAE
Chapter 11 Company Profiles
- 11.1 Global companies
- 11.1.1 ARI Fleet Management
- 11.1.2 BMW
- 11.1.3 Care by Volvo
- 11.1.4 Element Fleet Management
- 11.1.5 Hertz
- 11.1.6 Hyundai
- 11.1.7 LeasePlan/Ayvens
- 11.1.8 Mercedes-Benz
- 11.1.9 Penske Truck Leasing
- 11.1.10 Ryder System
- 11.1.11 Sixt
- 11.1.12 Turo
- 11.1.13 Volkswagen
- 11.1.14 Waymo
- 11.1.15 Wheels
- 11.1.16 Zipcar
- 11.2 Regional players
- 11.2.1 Emkay
- 11.2.2 Lime
- 11.2.3 Merchants Fleet
- 11.2.4 Mike Albert Fleet Solutions
- 11.2.5 PacLease
- 11.3 Emerging players
- 11.3.1 Finn Auto
- 11.3.2 Porsche Drive
 智慧交通控制市場預測至2034年-按組件、部署模式、技術、應用、最終用戶和地區分類的全球分析
 車輛即服務 (VaaS) 市場規模、佔有率和成長分析:按服務類型、車輛類型、最終用戶和地區分類-2026-2033 年產業預測
 乘用車市場規模、佔有率和成長分析:按燃料類型、車輛類型、分銷管道和地區分類-2026-2033年產業預測
 汽車市場機會、成長要素、產業趨勢分析及2026-2035年預測。
 2026年全球乘用車市場報告VaaS(車輛即服務)市場全球市場報告(2026年)
 2026-2034年全球乘用車智慧轉向系統市場規模、佔有率、趨勢及成長分析報告
 乘用車廢氣排放系統市場-全球產業規模、佔有率、趨勢、機會及預測(依燃料類型、後處理類型、零件類型、地區及競爭格局分類,2021-2031年)乘用車拖車桿市場 - 全球產業規模、佔有率、趨勢、機會、預測:按類型、銷售管道、地區和競爭格局分類,2021-2031年電動乘用車零件市場-全球產業規模、佔有率、趨勢、機會及預測(按車輛類型、動力類型、零件類型、地區和競爭格局分類,2021-2031年)