

 |
市場調查報告書
商品編碼
1885885
採購軟體市場機會、成長促進因素、產業趨勢分析及預測(2025-2034年)Procurement Software Market Opportunity, Growth Drivers, Industry Trend Analysis, and Forecast 2025 - 2034 |
||||||
2024 年全球採購軟體市場價值為 75 億美元,預計到 2034 年將以 9.2% 的複合年成長率成長至 178 億美元。
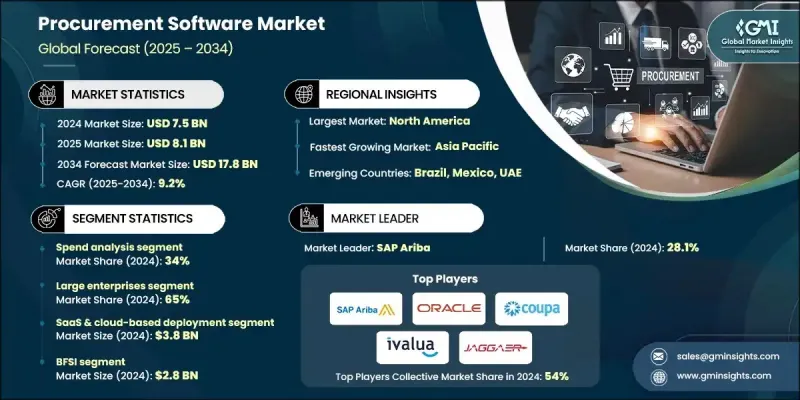
隨著各行各業(包括製造業、銀行、金融服務和保險業、醫療保健業、零售業和政府部門)優先考慮數位化營運、加強成本控制和提高供應鏈透明度,對採購技術的需求持續成長。企業正在加速採用基於雲端的採購生態系統,以簡化採購活動、加強合規性並實現支出管理的自動化。隨著營運效率和治理期望的提高,採購團隊正在轉向整合式數位平台,以加強與供應商的協作並最佳化合約生命週期。此外,減少人工流程、集中採購資料和提高全球供應鏈應變能力的普遍需求也推動了市場的擴張。
| 市場範圍 | |
|---|---|
| 起始年份 | 2024 |
| 預測年份 | 2025-2034 |
| 起始值 | 75億美元 |
| 預測值 | 178億美元 |
| 複合年成長率 | 9.2% |
先進技術正透過人工智慧驅動的分析、RPA賦能的自動化以及基於物聯網的供應鏈監控,重塑採購工作流程。這些功能能夠實現即時支出洞察、預測性分析以及跨供應商網路的自動化風險評估。機器學習模型、數位孿生和動態供應商績效儀錶板幫助企業更快做出數據驅動的決策,同時提升成本效益和營運靈活性。採用雲端電子採購解決方案、數位化合約管理和先進的供應商關係管理工具,進一步增強了整個採購流程的準確性、合規性和工作效率。
預計到2024年,支出分析將佔34%的市場佔有率,並預計在2034年之前以9%的複合年成長率成長。這一領域對於實現財務透明度和分析準確性至關重要。依靠人工智慧增強的支出智慧、結構化資料分類和預測性成本建模的企業可以減少非正規支出,並發現新的效率提升機會。這些工具能夠持續展現採購績效,其能力遠超過人工報告方法。
大型企業在2024年佔據了65%的市場佔有率,預計在2025年至2034年期間將以9.5%的複合年成長率成長。它們的領先地位源於對可擴展、互聯互通的採購系統的需求,以支持全球營運。這些企業依賴強大的工具來進行企業級支出追蹤、自動化供應商評估和跨區域採購。對人工智慧驅動的採購平台和雲端整合套件的大力投資,持續鞏固了它們的市場主導地位。
美國採購軟體市場佔88%的市場佔有率,預計2024年市場規模將達22億美元。美國強大的技術基礎、高度集中的採購軟體供應商以及企業數位轉型的快速發展,共同支撐了其領先的市場佔有率。美國企業越來越依賴雲端原生平台、人工智慧驅動的供應商分析和工作流程自動化技術,以提高採購的準確性和治理水準。政府主導的旨在促進安全數位化採購和提高透明度的舉措,進一步推動了公共和私營部門對採購軟體的採用。
採購軟體市場的主要參與者包括 Workday、Synertrade、SAP Ariba、Coupa、Oracle、GEP、Basware、Jaggaer、Ivalua 和 Zycus。採購軟體市場的各公司正在實施多種策略以鞏固其市場地位。許多公司正在擴展雲端原生架構並部署人工智慧驅動的分析,以提高整個採購週期的速度、準確性和決策智慧。供應商正在大力投資自動化技術,包括 RPA 和機器學習,以簡化重複性任務並提高使用者效率。與 ERP 供應商、財務軟體平台和供應鏈技術公司建立策略合作夥伴關係有助於擴展整合能力並創建統一的數位生態系統。各公司也正在優先考慮增強資料安全性、合規性功能和可自訂的採購模組,以滿足各種企業需求。
目錄
第1章:方法論與範圍
第2章:執行概要
第3章:行業洞察
- 產業生態系分析
- 供應商格局
- 利潤率
- 成本結構
- 每個階段的價值增加
- 影響價值鏈的因素
- 中斷
- 產業影響因素
- 成長促進因素
- 採購領域的數位轉型
- 人工智慧與分析整合
- 監理合規與風險管理
- 成本最佳化與效率
- 產業陷阱與挑戰
- 實施成本高且複雜
- 資料安全和隱私問題
- 市場機遇
- 中小企業採用率成長
- 永續和綠色採購
- 人工智慧和機器學習的融合
- 供應商協作與風險管理
- 成長促進因素
- 成長潛力分析
- 監管環境
- 採購中的人工智慧和機器學習
- 生成式人工智慧應用及變革性影響
- 機器人流程自動化 (RPA) 整合
- 用於供應商驗證和追溯的區塊鏈
- 物聯網 (IoT) 用於庫存和資產追蹤
- 進階分析與預測智慧
- 合約分析中的自然語言處理(NLP)
- 用於發票處理的電腦視覺和OCR技術
- 用於供應鏈模擬的數位孿生
- 邊緣運算和分散式採購
- 波特的分析
- PESTEL 分析
- 技術與創新格局
- 技術演進時程及里程碑
- 技術性能提升預測
- 成本削減路線圖和經濟目標
- 生產規模擴大時程和產能規劃
- 新興科技整合與融合
- 市場滲透情景及採納曲線
- 顛覆性技術威脅及市場影響
- 長期市場機會與策略遠見
- 技術轉移與商業化途徑
- 創新生態系與合作網路
- 價格趨勢
- 按地區
- 依產品
- 成本細分分析
- 專利分析
- 永續性和環境方面
- 永續實踐
- 減少廢棄物策略
- 生產中的能源效率
- 環保舉措
- 最佳情況
- 政府和公共部門電子採購重點
- 政府和公共部門電子採購重點
- 全球電子採購改革計劃
- 印度寶石(政府電子市場)
- 法國電子採購與電子發票改革
- 歐盟電子採購計劃
- 美國聯邦政府電子採購現代化
- 亞太地區電子化政府採購
- 拉丁美洲和新興市場
- 正在進行中的重大公共採購項目
- 公共部門數位化路線圖及投資
- 新興交付模式與架構演進
- 軟體即服務 (SaaS) 的演變
- 採購平台即服務 (PaaS)
- 管理式採購服務 (MPS)
- API優先的無頭採購架構
- 採購市場演變
- 嵌入式採購與採購即服務
- 模組化和可組合的採購套件
- 供應鏈及交付模式分析
- SaaS訂閱模式
- 實施與專業服務
- 託管服務與業務流程外包 (BPO) 整合
- 合作夥伴生態系統及通路策略
- 直接銷售模式與間接銷售模式
- 客戶成功與留存策略
- 用戶採納與變革管理
- 用戶採納率及挑戰
- 變革管理最佳實踐
- 培訓與賦能需求
- 一般買家與高級用戶的體驗
- 行動應用與現場採購
- 遊戲化與用戶參與策略
- 高階主管支持與利害關係人協調
- 購買者旅程與決策過程
- 採購軟體評估標準
- RFP及供應商選擇流程
- 概念驗證和試點項目
- 利害關係人協調與共識建立
- 自建、購買或合作決策
- 供應商評估評分卡和框架
- 合約談判及商業條款
- 採購成熟度模型與數位轉型路線圖
- 採購成熟度評估框架
- 數位採購轉型階段
- 路線圖制定與優先排序
- 快速見效與策略性舉措
- 能力建構與組織準備
- 轉型關鍵績效指標及成功指標
- 安全、合規與風險管理
- 網路安全威脅及緩解策略
- 資料安全和加密標準
- 存取控制和身分管理
- 審計追蹤和合規性報告
- 供應商風險管理與第三方安全
- 災難復原與業務連續性計劃
- 採購零信任架構
- 供應鏈網路風險管理
- 性能基準和服務水平協議
- 系統正常運作時間和可用性標準
- 反應時間和性能指標
- 支援與服務等級協議
- 供應商績效評分卡
- 行業基準比較
第4章:競爭格局
- 介紹
- 公司市佔率分析
- 北美洲
- 歐洲
- 亞太地區
- 拉丁美洲
- 中東和非洲
- 主要市場參與者的競爭分析
- 競爭定位矩陣
- 戰略展望矩陣
- 關鍵進展
- 併購
- 合作夥伴關係與合作
- 新產品發布
- 擴張計劃和資金
第5章:市場估算與預測:依軟體模組分類,2021-2034年
- 主要趨勢
- 支出分析
- 電子採購
- 電子採購
- 合約管理
- 供應商管理
- 其他
第6章:市場估算與預測:依組織規模分類,2021-2034年
- 主要趨勢
- 大型企業
- 中小企業
第7章:市場估算與預測:依部署模式分類,2021-2034年
- 主要趨勢
- SaaS 和雲端部署
- 混合
- 現場
第8章:市場估算與預測:依最終用途分類,2021-2034年
- 主要趨勢
- 金融服務業
- 政府和公共部門
- 製造業
- 醫療保健與生命科學
- 零售及消費品
- 電信
- 其他
第9章:市場估計與預測:依地區分類,2021-2034年
- 主要趨勢
- 北美洲
- 美國
- 加拿大
- 歐洲
- 英國
- 德國
- 法國
- 義大利
- 西班牙
- 比利時
- 荷蘭
- 瑞典
- 亞太地區
- 中國
- 印度
- 日本
- 澳洲
- 新加坡
- 韓國
- 越南
- 印尼
- 拉丁美洲
- 巴西
- 墨西哥
- 阿根廷
- MEA
- 阿拉伯聯合大公國
- 南非
- 沙烏地阿拉伯
第10章:公司簡介
- Global Player
- Basware
- Coupa Software
- GEP
- Ivalua
- JAGGAER
- Oracle
- SAP Ariba
- Tradeshift
- Workday
- Zycus
- Regional Player
- Anvil
- Beroe
- Cirtuo
- Esker
- Planergy
- Proactis
- Sievo
- SpendHQ
- Synertrade
- Zip
- 新興參與者
- Corcentric
- Kodiak Hub
- Medius
- Raindrop
- ZHENYUN
The Global Procurement Software Market was valued at USD 7.5 billion in 2024 and is estimated to grow at a CAGR of 9.2% to reach USD 17.8 billion by 2034.
Demand for procurement technology continues to rise as organizations prioritize digital-first operations, stronger cost control, and improved supply chain transparency across sectors, including manufacturing, BFSI, healthcare, retail, and government. Enterprises are accelerating the adoption of cloud-based procurement ecosystems to streamline sourcing activities, strengthen compliance, and automate spend management. As operational efficiency and governance expectations increase, procurement teams are shifting toward integrated digital platforms that enhance collaboration with suppliers and optimize contract lifecycles. The market's expansion is also supported by the widespread need to reduce manual processes, centralize procurement data, and improve responsiveness in global supply networks.
| Market Scope | |
|---|---|
| Start Year | 2024 |
| Forecast Year | 2025-2034 |
| Start Value | $7.5 Billion |
| Forecast Value | $17.8 Billion |
| CAGR | 9.2% |
Advanced technologies are reshaping procurement workflows through AI-driven analytics, RPA-enabled automation, and IoT-based supply chain monitoring. These capabilities enable real-time spend insights, predictive forecasting, and automated risk evaluation across supplier networks. Machine learning models, digital twins, and dynamic supplier performance dashboards help organizations make faster, data-backed decisions while elevating cost savings and operational agility. Adoption of cloud e-sourcing solutions, digital contract management, and sophisticated supplier relationship management tools further strengthens accuracy, compliance, and workflow efficiency throughout procurement operations.
The spend analysis held a 34% share in 2024 and is anticipated to grow at a CAGR of 9% through 2034. This segment is critical for achieving financial transparency and analytical accuracy. Companies relying on AI-enhanced spend intelligence, structured data classification, and predictive cost modeling can reduce unmanaged spending and uncover new efficiency opportunities. These tools provide continuous visibility into procurement performance, surpassing the capabilities of manual reporting methods.
The large enterprises held a 65% share in 2024 and will grow at a CAGR of 9.5% during 2025-2034. Their leadership stems from the need for scalable, interconnected procurement systems that support global operations. These organizations depend on robust tools for enterprise-wide spend tracking, automated supplier assessments, and multi-region sourcing. Strong investment in AI-led procurement platforms and cloud-integrated suites continues to reinforce their dominant position.
United States Procurement Software Market held an 88% share and generated USD 2.2 billion in 2024. The country's strong technological foundation, large concentration of procurement software providers, and rapidly advancing digital adoption among enterprises support its leading share. U.S. organizations are increasingly relying on cloud-native platforms, AI-enabled supplier analyses, and workflow automation technologies to enhance sourcing accuracy and governance. Government-driven initiatives promoting secure digital procurement and enhanced transparency further boost adoption across public and private sectors.
Key Procurement Software Market participants include Workday, Synertrade, SAP Ariba, Coupa, Oracle, GEP, Basware, Jaggaer, Ivalua, and Zycus. Companies in the Procurement Software Market are executing several strategies to reinforce their market position. Many are expanding cloud-native architectures and deploying AI-driven analytics to enhance speed, accuracy, and decision intelligence across procurement cycles. Vendors are investing heavily in automation technologies, including RPA and machine learning, to streamline repetitive tasks and improve user efficiency. Strategic partnerships with ERP providers, financial software platforms, and supply chain technology firms help broaden integration capabilities and create unified digital ecosystems. Firms are also prioritizing enhanced data security, regulatory compliance features, and customizable procurement modules to meet diverse enterprise needs.
Table of Contents
Chapter 1 Methodology & Scope
- 1.1 Market scope and definition
- 1.2 Research design
- 1.2.1 Research approach
- 1.2.2 Data collection methods
- 1.3 Data mining sources
- 1.3.1 Global
- 1.3.2 Regional/Country
- 1.4 Base estimates and calculations
- 1.4.1 Base year calculation
- 1.4.2 Key trends for market estimation
- 1.5 Primary research and validation
- 1.5.1 Primary sources
- 1.6 Forecast
- 1.7 Research assumptions and limitations
Chapter 2 Executive Summary
- 2.1 Industry 3600 synopsis, 2021 - 2034
- 2.2 Key market trends
- 2.2.1 Regional
- 2.2.2 Software module
- 2.2.3 Organization size
- 2.2.4 Deployment model
- 2.2.5 End use
- 2.3 TAM Analysis, 2025-2034
- 2.4 CXO perspectives: Strategic imperatives
- 2.4.1 Executive decision points
- 2.4.2 Critical success factors
- 2.5 Future outlook and strategic recommendations
Chapter 3 Industry Insights
- 3.1 Industry ecosystem analysis
- 3.1.1 Supplier Landscape
- 3.1.2 Profit Margin
- 3.1.3 Cost structure
- 3.1.4 Value addition at each stage
- 3.1.5 Factor affecting the value chain
- 3.1.6 Disruptions
- 3.2 Industry impact forces
- 3.2.1 Growth drivers
- 3.2.1.1 Digital transformation in procurement
- 3.2.1.2 AI & analytics integration
- 3.2.1.3 Regulatory compliance & risk management
- 3.2.1.4 Cost optimization & efficiency
- 3.2.2 Industry pitfalls and challenges
- 3.2.2.1 High implementation costs & complexity
- 3.2.2.2 Data security & privacy concerns
- 3.2.3 Market opportunities
- 3.2.3.1 SME adoption growth
- 3.2.3.2 Sustainable & green procurement
- 3.2.3.3 AI and machine learning integration
- 3.2.3.4 Supplier collaboration and risk management
- 3.2.1 Growth drivers
- 3.3 Growth potential analysis
- 3.4 Regulatory landscape
- 3.4.1 Artificial intelligence & machine learning in procurement
- 3.4.2 Generative ai applications & transformational impact
- 3.4.3 Robotic process automation (RPA) integration
- 3.4.4 Blockchain for supplier verification & traceability
- 3.4.5 Internet of things (IOT) for inventory & asset tracking
- 3.4.6 Advanced analytics & predictive intelligence
- 3.4.7 Natural language processing (NLP) for contract analysis
- 3.4.8 Computer vision & OCR for invoice processing
- 3.4.9 Digital twins for supply chain simulation
- 3.4.10 Edge computing & distributed procurement
- 3.5 Porter's analysis
- 3.6 PESTEL analysis
- 3.7 Technology and Innovation Landscape
- 3.7.1 Technology evolution timeline & milestones
- 3.7.2 Performance improvement projections by technology
- 3.7.3 Cost reduction roadmap & economic targets
- 3.7.4 Manufacturing scale-up timeline & capacity planning
- 3.7.5 Emerging technology integration & convergence
- 3.7.6 Market penetration scenarios & adoption curves
- 3.7.7 Disruptive technology threats & market impact
- 3.7.8 Long-term market opportunities & strategic vision
- 3.7.9 Technology transfer & commercialization pathways
- 3.7.10 Innovation ecosystem & collaboration networks
- 3.8 Price trends
- 3.8.1 By region
- 3.8.2 By product
- 3.9 Cost breakdown analysis
- 3.10 Patent analysis
- 3.11 Sustainability and Environmental Aspects
- 3.11.1 Sustainable practices
- 3.11.2 Waste reduction strategies
- 3.11.3 Energy efficiency in production
- 3.11.4 Eco-friendly initiatives
- 3.12 Best case scenarios
- 3.13 Government & public sector e-procurement focus
- 3.13.1 Government & public sector e-procurement focus
- 3.13.2 Global e-procurement reform initiatives
- 3.13.3 India gem (government e-marketplace)
- 3.13.4 France E-procurement & e-invoicing reforms
- 3.13.5 European union e-procurement initiatives
- 3.13.6 U.S. federal E-procurement modernization
- 3.13.7 Asia pacific E-government procurement
- 3.13.8 Latin America & emerging markets
- 3.13.9 Ongoing major public procurement projects
- 3.13.10 Public sector digitalization roadmaps & investment
- 3.14 Emerging delivery models & architectural evolution
- 3.14.1 Software-as-a-service (SAAS) Evolution
- 3.14.2 Platform-as-a-service (PAAS) for Procurement
- 3.14.3 Managed procurement services (MPS)
- 3.14.4 API-first & headless procurement architecture
- 3.14.5 Procurement marketplace evolution
- 3.14.6 Embedded procurement & procurement-as-a-service
- 3.14.7 Modular & composable procurement suites
- 3.15 Supply Chain & Delivery Model Analysis
- 3.15.1 SaaS subscription models
- 3.15.2 Implementation & professional services
- 3.15.3 Managed services & BPO integration
- 3.15.4 Partner ecosystem & channel strategy
- 3.15.5 Direct vs indirect sales models
- 3.15.6 Customer success & retention strategies
- 3.16 User Adoption & Change Management
- 3.16.1 User adoption rates & challenges
- 3.16.2 Change management best practices
- 3.16.3 Training & enablement requirements
- 3.16.4 Casual buyer vs power user experience
- 3.16.5 Mobile adoption & field procurement
- 3.16.6 Gamification & user engagement strategies
- 3.16.7 Executive sponsorship & stakeholder alignment
- 3.17 Buyer Journey & Decision-Making Process
- 3.17.1 Procurement software evaluation criteria
- 3.17.2 RFP & vendor selection process
- 3.17.3 Proof-of-concept & pilot programs
- 3.17.4 Stakeholder alignment & consensus building
- 3.17.5 Build vs buy vs partner decisions
- 3.17.6 Vendor evaluation scorecards & frameworks
- 3.17.7 Contract negotiation & commercial terms
- 3.18 Procurement maturity models & digital transformation roadmaps
- 3.18.1 Procurement maturity assessment frameworks
- 3.18.2 Digital procurement transformation stages
- 3.18.3 Roadmap development & prioritization
- 3.18.4 Quick wins vs strategic initiatives
- 3.18.5 Capability building & organizational readiness
- 3.18.6 Transformation KPIS & success metrics
- 3.19 Security, Compliance & Risk Management
- 3.19.1 Cybersecurity threats & mitigation strategies
- 3.19.2 Data security & encryption standards
- 3.19.3 Access control & identity management
- 3.19.4 Audit trails & compliance reporting
- 3.19.5 Vendor risk management & third-party security
- 3.19.6 Disaster recovery & business continuity planning
- 3.19.7 Zero trust architecture for procurement
- 3.19.8 Supply chain cyber risk management
- 3.20 Performance Benchmarks & SLAs
- 3.20.1 System uptime & availability standards
- 3.20.2 Response time & performance metrics
- 3.20.3 Support & service level agreements
- 3.20.4 Vendor performance scorecards
- 3.20.5 Industry benchmark comparisons
Chapter 4 Competitive Landscape, 2024
- 4.1 Introduction
- 4.2 Company market share analysis
- 4.2.1 North America
- 4.2.2 Europe
- 4.2.3 Asia Pacific
- 4.2.4 Latin America
- 4.2.5 Middle East & Africa
- 4.3 Competitive analysis of major market players
- 4.4 Competitive positioning matrix
- 4.5 Strategic outlook matrix
- 4.6 Key developments
- 4.6.1 Mergers & acquisitions
- 4.6.2 Partnerships & collaborations
- 4.6.3 New product launches
- 4.6.4 Expansion plans and funding
Chapter 5 Market Estimates & Forecast, By Software Module, 2021 - 2034 ($ Bn)
- 5.1 Key trends
- 5.2 Spend analysis
- 5.3 E-sourcing
- 5.4 E-procurement
- 5.5 Contract management
- 5.6 Supplier management
- 5.7 Others
Chapter 6 Market Estimates & Forecast, By Organization Size, 2021 - 2034 ($ Bn)
- 6.1 Key trends
- 6.2 Large Enterprises
- 6.3 SME
Chapter 7 Market Estimates & Forecast, By Deployment Model, 2021 - 2034 ($ Bn)
- 7.1 Key trends
- 7.2 SaaS & cloud-based deployment
- 7.3 Hybrid
- 7.4 On-premises
Chapter 8 Market Estimates & Forecast, By End Use, 2021 - 2034 ($ Bn)
- 8.1 Key trends
- 8.2 BFSI
- 8.3 Government & public sector
- 8.4 Manufacturing
- 8.5 Healthcare & life sciences
- 8.6 Retail & consumer goods
- 8.7 Telecommunications
- 8.8 Others
Chapter 9 Market Estimates & Forecast, By Region, 2021 - 2034 ($ Bn)
- 9.1 Key trends
- 9.2 North America
- 9.2.1 US
- 9.2.2 Canada
- 9.3 Europe
- 9.3.1 UK
- 9.3.2 Germany
- 9.3.3 France
- 9.3.4 Italy
- 9.3.5 Spain
- 9.3.6 Belgium
- 9.3.7 Netherlands
- 9.3.8 Sweden
- 9.4 Asia Pacific
- 9.4.1 China
- 9.4.2 India
- 9.4.3 Japan
- 9.4.4 Australia
- 9.4.5 Singapore
- 9.4.6 South Korea
- 9.4.7 Vietnam
- 9.4.8 Indonesia
- 9.5 Latin America
- 9.5.1 Brazil
- 9.5.2 Mexico
- 9.5.3 Argentina
- 9.6 MEA
- 9.6.1 UAE
- 9.6.2 South Africa
- 9.6.3 Saudi Arabia
Chapter 10 Company Profiles
- 10.1 Global Player
- 10.1.1 Basware
- 10.1.2 Coupa Software
- 10.1.3 GEP
- 10.1.4 Ivalua
- 10.1.5 JAGGAER
- 10.1.6 Oracle
- 10.1.7 SAP Ariba
- 10.1.8 Tradeshift
- 10.1.9 Workday
- 10.1.10 Zycus
- 10.2 Regional Player
- 10.2.1 Anvil
- 10.2.2 Beroe
- 10.2.3 Cirtuo
- 10.2.4 Esker
- 10.2.5 Planergy
- 10.2.6 Proactis
- 10.2.7 Sievo
- 10.2.8 SpendHQ
- 10.2.9 Synertrade
- 10.2.10 Zip
- 10.3 Emerging Players
- 10.3.1 Corcentric
- 10.3.2 Kodiak Hub
- 10.3.3 Medius
- 10.3.4 Raindrop
- 10.3.5 ZHENYUN
 2026年全球採購軟體市場報告
 建築採購軟體市場:依採購類型、部署模式、組織規模和應用程式分類-2026-2032年全球預測
 物聯網採購市場規模、佔有率和成長分析:按組件、應用、最終用戶產業和地區分類 - 2026-2033 年產業預測
 採購軟體市場分析及預測(至2035年):按類型、產品類型、服務、技術、組件、應用、流程、部署類型、最終用戶和功能分類
 採購軟體市場-全球產業規模、佔有率、趨勢、機會及預測(按部署類型、軟體類型、組織規模、垂直產業、地區和競爭格局分類,2021-2031年)
 日本採購軟體市場(按軟體類型、部署方式、組織規模、產業和地區分類,2026-2034 年)
 按解決方案類型、部署模式、組織規模、垂直行業、定價模式和地區分類的採購到付款市場規模、佔有率和成長分析 - 2026-2033 年行業預測
 全球採購軟體市場:市場規模、佔有率和趨勢分析(按軟體類型、部署方式、公司規模、最終用途和地區分類),細分市場預測(2025-2033 年)
 採購軟體市場規模、佔有率、成長分析(按部署、按軟體類型、按組織規模、按行業垂直和按地區)- 行業預測 2025-2032
 採購軟體市場,全球 2025-2029