


 |
市場調查報告書
商品編碼
1876529
汽車品質檢測人工智慧系統市場機會、成長促進因素、產業趨勢分析及預測(2025-2034年)Automotive Quality Inspection AI System Market Opportunity, Growth Drivers, Industry Trend Analysis, and Forecast 2025 - 2034 |
||||||
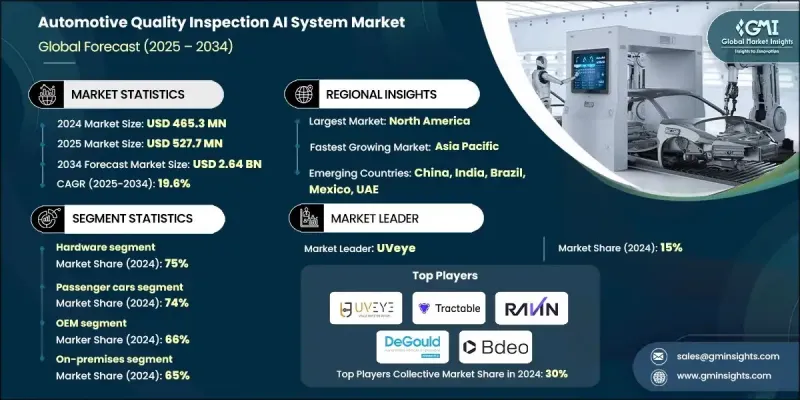
2024 年全球汽車品質檢測人工智慧系統市值為 4.653 億美元,預計到 2034 年將以 19.6% 的複合年成長率成長至 26.4 億美元。
汽車製造商正擴大採用人工智慧驅動的檢測系統,以實現零缺陷生產標準。這些技術能夠在製造的早期階段檢測出缺陷,從而確保產品的一致性和品質。自動化技術的應用減少了人為錯誤,提高了流程可靠性,並有助於生產無需返工或無缺陷的車輛。各地監管壓力促使製造商遵守嚴格的安全和品質標準,而人工智慧系統能夠對關鍵部件進行即時檢測,從而最大限度地降低召回風險。這些解決方案還能提高生產效率,使製造商能夠持續監控組裝線,即時識別缺陷,並迅速做出明智的決策,從而確保大批量生產的產品品質始終保持穩定可靠。
| 市場範圍 | |
|---|---|
| 起始年份 | 2024 |
| 預測年份 | 2025-2034 |
| 起始值 | 4.653億美元 |
| 預測值 | 26.4億美元 |
| 複合年成長率 | 19.6% |
預計到2024年,硬體領域將佔據75%的市場佔有率,這主要得益於市場對人工智慧相機、感測器和成像設備的需求,這些設備能夠實現精準的缺陷檢測和即時製程監控。先進的高解析度相機、3D感測器和LiDAR系統在生產線上的應用日益廣泛,顯著提升了精度和監控能力。具備邊緣運算功能的人工智慧硬體也越來越受歡迎,它能夠提供更強大的資料處理能力、更低的延遲以及更快的決策速度,且無需依賴集中式伺服器。
預計到2024年,乘用車市場將佔據74%的市場佔有率,這反映出全球強勁的需求以及生產線上人工智慧檢測技術的應用,從而確保產品完美無瑕。人工智慧技術有助於管理複雜的組裝流程,例如精密的電子整合和先進的車身製造,它可以檢測細微缺陷、減少人為錯誤、驗證品質控制流程,並在降低成本高昂的召回風險的同時,提升客戶滿意度。
2024年,美國汽車品質檢測人工智慧系統市場規模達1.565億美元。美國擁有成熟的汽車製造業,先進的機器人技術、整合智慧工廠以及廣泛的人工智慧驅動的品質檢測部署,使得裝配線上的即時缺陷檢測、預測性維護和流程最佳化成為可能。
全球汽車品質檢測人工智慧系統市場的主要企業包括 Monk.AI、Tractable、UVeye、Bdeo、Ravin.AI、Pave AI、Inspektlabs、Claim Genius、WeProov 和 DeGould。這些企業正採取多種策略來鞏固自身地位並擴大市場佔有率。他們加大研發投入,開發新一代人工智慧演算法和感測器技術,以提高缺陷偵測的準確性。與原始設備製造商 (OEM)、機器人整合商和智慧工廠供應商建立策略合作夥伴關係,拓展了部署機會。企業利用邊緣運算和雲端人工智慧平台來增強即時資料處理和預測分析能力。併購則用於拓展技術組合和全球影響力。此外,企業也重視客戶支援、培訓專案和客製化解決方案,以建立信任、確保產品應用,並與製造商建立長期策略合作關係,從而鞏固自身的競爭優勢。
目錄
第1章:方法論
- 市場範圍和定義
- 研究設計
- 研究方法
- 資料收集方法
- 資料探勘來源
- 全球的
- 地區/國家
- 基準估算和計算
- 基準年計算
- 市場估算的關鍵趨勢
- 初步研究和驗證
- 原始資料
- 預測模型
- 研究假設和局限性
第2章:執行概要
第3章:行業洞察
- 產業生態系分析
- 供應商格局
- 利潤率
- 成本結構
- 每個階段的價值增加
- 影響價值鏈的因素
- 中斷
- 產業影響因素
- 成長促進因素
- 對零缺陷製造的需求不斷成長
- 嚴格的安全和監管標準
- 需要即時品質保證
- 成本和時間最佳化
- 產業陷阱與挑戰
- 初始實施成本高
- 資料品質和模型訓練限制
- 市場機遇
- 不斷成長的電動車製造基地
- 發展中市場的擴張
- 基於雲端的AI檢測平台
- 跨產業應用
- 成長促進因素
- 成長潛力分析
- 監管環境
- 全球的
- 人工智慧系統安全架構要求
- 資料隱私法規合規性(GDPR、CCPA)
- 工業網路安全標準(ISO/SAE 21434)
- 威脅建模與風險評估
- 北美洲
- 歐洲
- 亞太地區
- 拉丁美洲
- 中東和非洲
- 全球的
- 波特的分析
- PESTEL 分析
- 技術與創新格局
- 當前技術趨勢
- 新興技術
- 價格趨勢
- 按地區
- 依產品
- 生產統計
- 生產中心
- 消費中心
- 進出口
- 成本細分分析
- 總擁有成本 (TCO) 計算
- 實施成本細分分析
- 營運節省量化
- 品質改善的財務影響
- 專利分析
- 永續性和環境方面
- 永續實踐
- 減少廢棄物策略
- 生產中的能源效率
- 環保舉措
- 碳足跡考量
- 可擴充性和多站點部署
- 全球製造網路需求
- 集中式與分散式人工智慧模型管理
- 跨工廠性能標準化
- 區域合規性和本地化需求
- 即時效能和延遲最佳化
- 生產線速度需求分析
- 邊緣運算架構設計
- 網路基礎設施與5G整合
- 硬體加速與GPU利用率
- 模型可解釋性和審計追蹤
- 監理合規文件要求
- 人工智慧決策的透明度和可解釋性
- 審計追蹤生成與管理
- 品質保證可追溯系統
- 數據品質和模型漂移管理
- 訓練資料品質保證
- 持續模型性能監測
- 模型重訓練與更新策略
- 數據漂移檢測與緩解
- 邊緣雲混合架構設計
- 供應商風險管理與供應鏈韌性
- 績效標竿管理與KPI管理
- 預測分析與預防措施
- 災難復原與業務連續性
第4章:競爭格局
- 介紹
- 公司市佔率分析
- 北美洲
- 歐洲
- 亞太地區
- 拉丁美洲
- MEA
- 主要市場參與者的競爭分析
- 競爭定位矩陣
- 戰略展望矩陣
- 關鍵進展
- 併購
- 合作夥伴關係與合作
- 新產品發布
- 擴張計劃和資金
- 策略舉措分析
- 供應商選擇標準
- 技術差異化戰略
第5章:市場估算與預測:依組件分類,2021-2034年
- 主要趨勢
- 硬體
- 人工智慧相機和成像設備
- 感測器和檢測單元
- 機器人及自動化設備
- 照明和計算系統
- 軟體
- 電腦視覺與影像軟體
- 機器學習/人工智慧模型
- 數據分析與報告平台
- 整合與監控軟體
第6章:市場估價與預測:依車輛類型分類,2021-2034年
- 主要趨勢
- 搭乘用車
- 轎車
- SUV
- 掀背車
- 商用車輛
- 輕型商用車
- 中型商用車 (MCV)
- 重型商用車 (HCV)
第7章:市場估計與預測:依應用領域分類,2021-2034年
- 主要趨勢
- 車身及油漆檢查
- 引擎及動力系統檢查
- 電子元件偵測
- 裝配線監控
第8章:市場估算與預測:依最終用途分類,2021-2034年
- 主要趨勢
- OEM
- 一級供應商
第9章:市場估算與預測:依部署模式分類,2021-2034年
- 主要趨勢
- 現場
- 基於雲端的
第10章:市場估計與預測:依地區分類,2021-2034年
- 主要趨勢
- 北美洲
- 美國
- 加拿大
- 歐洲
- 德國
- 英國
- 法國
- 義大利
- 西班牙
- 北歐
- 俄羅斯
- 波蘭
- 亞太地區
- 中國
- 印度
- 日本
- 韓國
- 澳新銀行
- 越南
- 泰國
- 拉丁美洲
- 巴西
- 墨西哥
- 阿根廷
- MEA
- 南非
- 沙烏地阿拉伯
- 阿拉伯聯合大公國
第11章:公司簡介
- Global companies
- Bdeo
- Cognex
- DeGould
- Inspektlabs
- Keyence
- Monk.AI
- Omron
- Pave AI
- Ravin.AI
- SICK
- Tractable
- UVeye
- WeProov
- Regional companies
- Dataspan
- Isra Vision (Atlas Copco)
- Robovis
- SECO
- Claim Genius
- Emerging companies
- Axelera AI
- Cincoze
- Datagon AI
- Datasensing
- NXP Semiconductor (AI Solutions)
- Plex by Rockwell Automation
- Robovision
- SinceVision
The Global Automotive Quality Inspection AI System Market was valued at USD 465.3 million in 2024 and is estimated to grow at a CAGR of 19.6% to reach USD 2.64 billion by 2034.
Automakers are increasingly adopting AI-driven inspection systems to achieve zero-defect production standards. These technologies detect defects at the earliest stages of manufacturing, ensuring product consistency and quality. The adoption of automation reduces human error, increases process reliability, and supports the production of vehicles free from rework or defects. Regulatory pressure across regions is pushing manufacturers to comply with stringent safety and quality standards, and AI systems provide real-time inspection of critical components to minimize recall risks. These solutions also enhance production efficiency, allowing manufacturers to monitor assembly lines continuously, identify flaws instantly, and make prompt, informed decisions, ensuring that high-volume manufacturing outputs remain uniform and reliable.
| Market Scope | |
|---|---|
| Start Year | 2024 |
| Forecast Year | 2025-2034 |
| Start Value | $465.3 Million |
| Forecast Value | $2.64 Billion |
| CAGR | 19.6% |
In 2024, the hardware segment held a 75% share, driven by demand for AI-enabled cameras, sensors, and imaging devices that enable precise defect detection and real-time process monitoring. Advanced high-resolution cameras, 3D sensors, and LiDAR systems are increasingly used in production lines, improving accuracy and monitoring capabilities. AI hardware with edge computing is becoming popular, offering enhanced data processing, lower latency, and faster decision-making independent of centralized servers.
The passenger car segment held a 74% share in 2024, reflecting strong global demand and the adoption of AI-based inspection in production lines to ensure flawless manufacturing. AI technologies help manage complex assembly processes, such as sophisticated electronics integration and advanced bodywork, detecting minor defects, reducing human error, validating quality control processes, and enhancing customer satisfaction while mitigating costly recalls.
U.S. Automotive Quality Inspection AI System Market generated USD 156.5 million in 2024. The country benefits from a mature automotive manufacturing sector with advanced robotics, integrated smart factories, and extensive AI-driven quality inspection deployments that enable real-time defect detection, predictive maintenance, and process optimization across assembly lines.
Leading companies in the Global Automotive Quality Inspection AI System Market include Monk.AI, Tractable, UVeye, Bdeo, Ravin.AI, Pave AI, Inspektlabs, Claim Genius, WeProov, and DeGould. Companies in the Global Automotive Quality Inspection AI System Market are adopting several strategies to strengthen their presence and expand market share. They are investing in R&D to develop next-generation AI algorithms and sensor technologies for higher defect detection accuracy. Strategic partnerships with OEMs, robotics integrators, and smart factory providers expand deployment opportunities. Firms are leveraging edge computing and cloud-based AI platforms to enhance real-time data processing and predictive analytics. Mergers and acquisitions are used to broaden technology portfolios and global reach. Additionally, companies emphasize customer support, training programs, and tailored solutions to build trust, ensure adoption, and create long-term strategic relationships with manufacturers, solidifying their competitive positioning.
Table of Contents
Chapter 1 Methodology
- 1.1 Market scope and definition
- 1.2 Research design
- 1.2.1 Research approach
- 1.2.2 Data collection methods
- 1.3 Data mining sources
- 1.3.1 Global
- 1.3.2 Regional/Country
- 1.4 Base estimates and calculations
- 1.4.1 Base year calculation
- 1.4.2 Key trends for market estimation
- 1.5 Primary research and validation
- 1.5.1 Primary sources
- 1.6 Forecast model
- 1.7 Research assumptions and limitations
Chapter 2 Executive Summary
- 2.1 Industry 360° synopsis
- 2.2 Key market trends
- 2.2.1 Regional
- 2.2.2 Component
- 2.2.3 Vehicle
- 2.2.4 Application
- 2.2.5 End Use
- 2.2.6 Deployment mode
- 2.3 TAM analysis, 2025-2034
- 2.4 CXO perspectives: Strategic imperatives
- 2.4.1 Executive decision points
- 2.4.2 Critical success factors
- 2.5 Future outlook and recommendations
Chapter 3 Industry Insights
- 3.1 Industry ecosystem analysis
- 3.1.1 Supplier landscape
- 3.1.2 Profit margin
- 3.1.3 Cost structure
- 3.1.4 Value addition at each stage
- 3.1.5 Factor affecting the value chain
- 3.1.6 Disruptions
- 3.2 Industry impact forces
- 3.2.1 Growth drivers
- 3.2.1.1 Rising demand for zero-defect manufacturing
- 3.2.1.2 Stringent safety and regulatory standards
- 3.2.1.3 Need for real-time quality assurance
- 3.2.1.4 Cost and time optimization
- 3.2.2 Industry pitfalls and challenges
- 3.2.2.1 High initial implementation cost
- 3.2.2.2 Data quality and model training limitations
- 3.2.3 Market opportunities
- 3.2.3.1 Growing EV manufacturing base
- 3.2.3.2 Expansion in developing markets
- 3.2.3.3 Cloud-based AI inspection platforms
- 3.2.3.4 Cross-industry applications
- 3.2.1 Growth drivers
- 3.3 Growth potential analysis
- 3.4 Regulatory landscape
- 3.4.1 Global
- 3.4.1.1 AI system security architecture requirements
- 3.4.1.2 Data privacy regulations compliance (GDPR, CCPA)
- 3.4.1.3 Industrial cybersecurity standards (ISO/SAE 21434)
- 3.4.1.4 Threat modeling & risk assessment
- 3.4.2 North America
- 3.4.3 Europe
- 3.4.4 Asia Pacific
- 3.4.5 Latin America
- 3.4.6 Middle East & Africa
- 3.4.1 Global
- 3.5 Porter's analysis
- 3.6 PESTEL analysis
- 3.7 Technology and innovation landscape
- 3.7.1 Current technological trends
- 3.7.2 Emerging technologies
- 3.8 Price trends
- 3.8.1 By region
- 3.8.2 By product
- 3.9 Production statistics
- 3.9.1 Production hubs
- 3.9.2 Consumption hubs
- 3.9.3 Export and import
- 3.10 Cost breakdown analysis
- 3.10.1 Total cost of ownership (TCO) calculations
- 3.10.2 Implementation cost breakdown analysis
- 3.10.3 Operational savings quantification
- 3.10.4 Quality improvement financial impact
- 3.11 Patent analysis
- 3.12 Sustainability and environmental aspects
- 3.12.1 Sustainable practices
- 3.12.2 Waste reduction strategies
- 3.12.3 Energy efficiency in production
- 3.12.4 Eco-friendly initiatives
- 3.13 Carbon footprint considerations
- 3.14 Scalability & multi-site deployment
- 3.14.1 Global manufacturing network requirements
- 3.14.2 Centralized vs. Distributed AI model management
- 3.14.3 Cross-plant performance standardization
- 3.14.4 Regional compliance & localization needs
- 3.15 Real-time performance & latency optimization
- 3.15.1 Production line speed requirements analysis
- 3.15.2 Edge computing architecture design
- 3.15.3. Network infrastructure & 5 G integration
- 3.15.4 Hardware acceleration & GPU utilization
- 3.16 Model explainability & audit trails
- 3.16.1 Regulatory compliance documentation requirements
- 3.16.2 Ai decision transparency & interpretability
- 3.16.3 Audit trail generation & management
- 3.16.4 Quality assurance traceability systems
- 3.17 Data quality & model drift management
- 3.17.1 Training data quality assurance
- 3.17.2 Continuous model performance monitoring
- 3.17.3 Model retraining & update strategies
- 3.17.4 Data drift detection & mitigation
- 3.18 Edge-cloud hybrid architecture design
- 3.19 Vendor risk management & supply chain resilience
- 3.20 Performance benchmarking & KPI management
- 3.21 Predictive analytics & preventive actions
- 3.22 Disaster recovery & business continuity
Chapter 4 Competitive Landscape, 2024
- 4.1 Introduction
- 4.2 Company market share analysis
- 4.2.1 North America
- 4.2.2 Europe
- 4.2.3 Asia Pacific
- 4.2.4 LATAM
- 4.2.5 MEA
- 4.3 Competitive analysis of major market players
- 4.4 Competitive positioning matrix
- 4.5 Strategic outlook matrix
- 4.6 Key developments
- 4.6.1 Mergers & acquisitions
- 4.6.2 Partnerships & collaborations
- 4.6.3 New product launches
- 4.6.4 Expansion plans and funding
- 4.7 Strategic initiatives analysis
- 4.8 Vendor selection criteria
- 4.9 Technology differentiation strategies
Chapter 5 Market Estimates & Forecast, By Component, 2021 - 2034 ($Mn, Units)
- 5.1 Key trends
- 5.2 Hardware
- 5.2.1 AI cameras & imaging devices
- 5.2.2 Sensors & detection units
- 5.2.3 Robotics & automation equipment
- 5.2.4 Lighting & computing systems
- 5.3 Software
- 5.3.1 Computer vision & imaging software
- 5.3.2 Machine learning / AI models
- 5.3.3 Data analytics & reporting platforms
- 5.3.4 Integration & monitoring software
Chapter 6 Market Estimates & Forecast, By Vehicle, 2021 - 2034 ($Mn, Units)
- 6.1 Key trends
- 6.2 Passenger cars
- 6.2.1 Sedan
- 6.2.2 SUV
- 6.2.3 Hatchback
- 6.3 Commercial vehicles
- 6.3.1 LCV (Light commercial vehicles)
- 6.3.2 MCV (Medium commercial vehicles)
- 6.3.3 HCV (Heavy commercial vehicles)
Chapter 7 Market Estimates & Forecast, By Application, 2021 - 2034 ($Mn, Units)
- 7.1 Key trends
- 7.2 Body & paint inspection
- 7.3 Engine & powertrain inspection
- 7.4 Electronics & component inspection
- 7.5 Assembly line monitoring
Chapter 8 Market Estimates & Forecast, By End Use, 2021 - 2034 ($Mn, Units)
- 8.1 Key trends
- 8.2 OEM
- 8.3 Tier-1 suppliers
Chapter 9 Market Estimates & Forecast, By Deployment Mode, 2021 - 2034 ($Mn, Units)
- 9.1 Key trends
- 9.2 On-premises
- 9.3 Cloud-based
Chapter 10 Market Estimates & Forecast, By Region, 2021 - 2034 ($Mn, Units)
- 10.1 Key trends
- 10.2 North America
- 10.2.1 US
- 10.2.2 Canada
- 10.3 Europe
- 10.3.1 Germany
- 10.3.2 UK
- 10.3.3 France
- 10.3.4 Italy
- 10.3.5 Spain
- 10.3.6 Nordics
- 10.3.7 Russia
- 10.3.8 Poland
- 10.4 Asia Pacific
- 10.4.1 China
- 10.4.2 India
- 10.4.3 Japan
- 10.4.4 South Korea
- 10.4.5 ANZ
- 10.4.6 Vietnam
- 10.4.7 Thailand
- 10.5 Latin America
- 10.5.1 Brazil
- 10.5.2 Mexico
- 10.5.3 Argentina
- 10.6 MEA
- 10.6.1 South Africa
- 10.6.2 Saudi Arabia
- 10.6.3 UAE
Chapter 11 Company Profiles
- 11.1 Global companies
- 11.1.1 Bdeo
- 11.1.2 Cognex
- 11.1.3 DeGould
- 11.1.4 Inspektlabs
- 11.1.5 Keyence
- 11.1.6 Monk.AI
- 11.1.7 Omron
- 11.1.8 Pave AI
- 11.1.9 Ravin.AI
- 11.1.10 SICK
- 11.1.11 Tractable
- 11.1.12 UVeye
- 11.1.13 WeProov
- 11.2 Regional companies
- 11.2.1 Dataspan
- 11.2.2 Isra Vision (Atlas Copco)
- 11.2.3 Robovis
- 11.2.4 SECO
- 11.2.5 Claim Genius
- 11.3 Emerging companies
- 11.3.1 Axelera AI
- 11.3.2 Cincoze
- 11.3.3 Datagon AI
- 11.3.4 Datasensing
- 11.3.5 NXP Semiconductor (AI Solutions)
- 11.3.6 Plex by Rockwell Automation
- 11.3.7 Robovision
- 11.3.8 SinceVision
 汽車技術檢驗與認證服務市場:2026-2032年全球市場預測(按服務類型、車輛類型、應用、最終用戶和檢驗方法分類)
 2026年全球汽車SMT生產線可追溯性市場報告2026年全球汽車測試、檢驗和認證(TIC)市場報告2026年全球汽車認證服務市場報告2026年全球汽車測試、檢驗和認證市場報告電動車測試、檢驗和認證市場:按服務類型、動力部件、測試等級和車輛類別分類-2026-2032年全球市場預測
 汽車TIC市場:全球產業分析、市場規模、市場佔有率及按服務、採購方式、應用、車輛類型、國家及地區分類的預測(2026年至2033年)全球靜電消除用電離棒市場:按產品類型、安裝方式、材料、技術、終端用戶產業和分銷管道分類的預測(2026-2032年)
 汽車認證服務市場 - 全球產業規模、佔有率、趨勢、機會及預測(按類型、車輛類型、應用、地區和競爭格局分類,2021-2031年)汽車電磁相容性測試和認證服務市場(按零件類型、動力傳動系統、服務類型、車輛類型和最終用戶分類)—2026-2032年全球預測