


 |
市場調查報告書
商品編碼
1871126
食品廢棄物中生物活性胜肽的市場機會、成長促進因素、產業趨勢分析及預測(2025-2034年)Bioactive Peptide from Food Waste Market Opportunity, Growth Drivers, Industry Trend Analysis, and Forecast 2025 - 2034 |
||||||
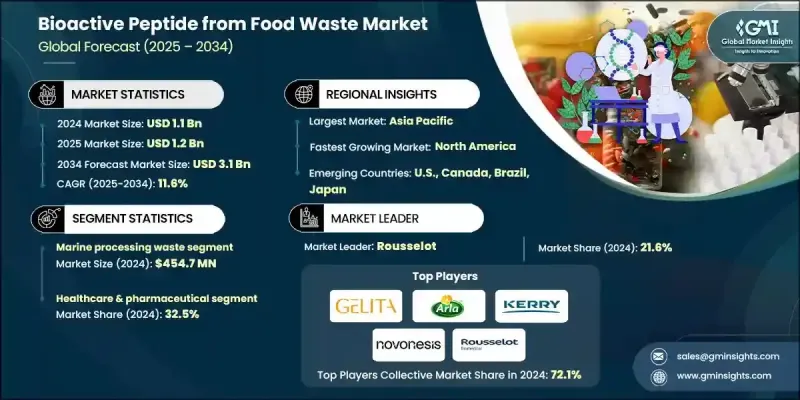
2024 年全球食品廢棄物生物活性胜肽市場價值為 11 億美元,預計到 2034 年將以 11.6% 的複合年成長率成長至 31 億美元。
從食品加工殘渣和廢棄原料中提取的生物活性胜肽正被擴大用於開發包括營養保健品、藥品和功能性食品在內的健康促進產品。人們對永續發展和環境保護的日益關注,促使各行業採用符合循環經濟目標的廢棄物資源化利用策略。世界各國政府正在推出支持性法規,以促進減少食物浪費並將其轉化為高附加價值產品。採用環保萃取方法,例如酶水解和先進的綠色技術,正在透過提高產量、提升純度和降低環境影響,改變這些胜肽的生產方式。這些創新正在推動市場需求,因為它們符合消費者對清潔標籤和永續性的偏好。來自食物廢棄物的生物活性胜肽因其已被證實具有的健康促進特性(例如抗氧化、抗菌和抗發炎活性),在功能性食品應用領域越來越受歡迎。消費者對預防性健康的日益重視,促使製造商開發先進的配方,以滿足消費者對天然有效健康解決方案日益成長的需求。
| 市場範圍 | |
|---|---|
| 起始年份 | 2024 |
| 預測年份 | 2025-2034 |
| 起始值 | 11億美元 |
| 預測值 | 31億美元 |
| 複合年成長率 | 11.6% |
2024年,海洋加工廢棄物領域創造了4.547億美元的產值。此領域包括魚類、水產養殖和貝類殘渣,富含生物活性分子,是生產高純度胜肽的重要來源。由於這些化合物具有很高的營養和治療潛力,它們在營養保健品、化妝品和功能性食品等行業中的應用日益廣泛。
2024年,醫療保健和製藥領域佔了32.5%的市場。這一主導地位歸功於生物活性胜肽在藥物研發、醫學營養和旨在治療慢性疾病的臨床製劑中日益廣泛的應用。人口老化和注重健康的消費者需求不斷成長,進一步推動了具有抗發炎、降血壓和抗氧化作用的生物活性化合物的應用。
2025年至2034年間,北美食品廢棄物生物活性胜肽市場將以11.5%的複合年成長率成長。市場成長得益於消費者對天然、健康和永續食品配料日益成長的需求。隨著注重健康的消費者擴大尋求功能性食品、膳食補充劑和營養保健品,該地區的製造商正加大對生物活性胜肽在食品和飲料創新中的應用投入。
在食品廢棄物生物活性胜肽市場中,領先的企業包括Arla Foods Ingredients Group、DSM-Firmenich、Fonterra (NZMP)、GELITA、Glanbia plc、Kerry Group plc、Novonesis、PB Leiner、Rousselot和Tessenderlo Group。這些企業正致力於策略合作、永續產品創新和先進萃取技術,以提升市場佔有率。領先的生產商正在投資綠色生產方法,以提高胜肽的品質並最大限度地減少對環境的影響。許多公司正在加強研發能力,以拓展產品組合,滿足以健康為中心的應用需求。與食品加工商和生物技術公司的合作也有助於有效利用廢棄物。此外,市場參與者正在採用以永續性和清潔標籤為核心的品牌策略,以吸引環保意識的消費者。
目錄
第1章:方法論與範圍
第2章:執行概要
第3章:行業洞察
- 產業生態系分析
- 供應商格局
- 利潤率
- 每個階段的價值增加
- 影響價值鏈的因素
- 中斷
- 產業影響因素
- 成長促進因素
- 日益關注循環經濟和廢棄物資源化利用
- 對天然和清潔標籤成分的需求不斷成長
- 支持食物垃圾利用的監管框架
- 產業陷阱與挑戰
- 消費者對廢棄物衍生原料的認知問題
- 品質控制與污染管理
- 市場機遇
- 新興市場中尚未開發的食物垃圾來源
- 與個性化營養趨勢的融合
- 成長促進因素
- 成長潛力分析
- 監管環境
- 北美洲
- 歐洲
- 亞太地區
- 拉丁美洲
- 中東和非洲
- 波特的分析
- PESTEL 分析
- 技術與創新格局
- 當前技術趨勢
- 新興技術
- 價格趨勢
- 按地區
- 來源
- 未來市場趨勢
- 專利格局
- 貿易統計(HS編碼)(註:僅提供重點國家的貿易統計資料)
- 主要進口國
- 主要出口國
- 永續性和環境方面
- 永續實踐
- 減少廢棄物策略
- 生產中的能源效率
- 環保舉措
- 碳足跡考量
第4章:競爭格局
- 介紹
- 公司市佔率分析
- 按地區
- 北美洲
- 歐洲
- 亞太地區
- 拉丁美洲
- MEA
- 按地區
- 公司矩陣分析
- 主要市場參與者的競爭分析
- 競爭定位矩陣
- 關鍵進展
- 併購
- 合作夥伴關係與合作
- 新產品發布
- 擴張計劃
第5章:市場估算與預測:依來源分類,2021-2034年
- 主要趨勢
- 乳製品廢棄物
- 乳清加工殘渣
- 乳酪生產副產品
- 牛奶加工廢料
- 肉類加工副產品
- 血液和血漿成分
- 皮革加工廢料
- 骨和軟骨殘餘物
- 動物內臟加工副產品
- 海洋處理廢料
- 魚類加工殘渣
- 貝類加工副產品
- 水產養殖廢棄物
- 植物性蛋白質殘基
- 油籽加工粕
- 糧食加工副產品
- 脈衝處理殘留物
- 蔬果加工廢料
第6章:市場估算與預測:依最終用途產業分類,2021-2034年
- 主要趨勢
- 醫療保健和製藥
- 營養保健品和膳食補充劑
- 治療藥物研發
- 醫學營養
- 臨床研究與開發
- 非處方藥
- 餐飲
- 功能性食品成分
- 蛋白質強化
- 天然防腐劑
- 風味增強
- 發酵產品
- 飲料強化
- 個人護理及化妝品
- 抗衰老護膚
- 保濕補水
- 頭髮護理與頭皮健康
- 傷口護理與癒合
- 防曬
- 男士儀容護理
- 動物飼料與營養
- 水產飼料
- 牲畜飼料添加劑
- 寵物食品和零食
- 家禽飼料
- 豬飼料
- 反芻動物飼料
- 農業與生物技術
- 生物促效劑
- 植物生長促進劑
- 土壤健康改善
- 作物保護
- 種子處理
- 運動營養與健身
- 運動前補充劑
- 運動後恢復
- 蛋白粉
- 能量棒和零食
- 水合產品
第7章:市場估計與預測:依地區分類,2021-2034年
- 主要趨勢
- 北美洲
- 美國
- 加拿大
- 歐洲
- 德國
- 英國
- 法國
- 西班牙
- 義大利
- 歐洲其他地區
- 亞太地區
- 中國
- 印度
- 日本
- 澳洲
- 韓國
- 亞太其他地區
- 拉丁美洲
- 巴西
- 墨西哥
- 阿根廷
- 拉丁美洲其他地區
- 中東和非洲
- 沙烏地阿拉伯
- 南非
- 阿拉伯聯合大公國
- 中東和非洲其他地區
第8章:公司簡介
- Arla Foods Ingredients Group
- DSM-Firmenich
- Fonterra (NZMP)
- GELITA
- Glanbia plc
- Kerry Group plc
- Novonesis
- PB Leiner
- Rousselot
- Tessenderlo Group
The Global Bioactive Peptide from Food Waste Market was valued at USD 1.1 Billion in 2024 and is estimated to grow at a CAGR of 11.6% to reach USD 3.1 Billion by 2034.
Bioactive peptides obtained from food processing residues and discarded raw materials are increasingly being utilized to develop health-promoting products, including nutraceuticals, pharmaceuticals, and functional foods. Growing attention toward sustainability and environmental protection has encouraged industries to adopt waste valorization strategies that align with circular economy goals. Governments across the world are introducing supportive regulations to promote food waste reduction and its conversion into value-added products. The use of eco-friendly extraction methods, such as enzymatic hydrolysis and advanced green technologies, is transforming the production of these peptides by enhancing yield, improving purity, and lowering environmental impact. These innovations are driving demand as they align with clean-label and sustainability preferences among consumers. Bioactive peptides from food waste are gaining traction in functional food applications due to their proven health-promoting properties, such as antioxidant, antimicrobial, and anti-inflammatory activities. Rising consumer awareness around preventive health has motivated manufacturers to develop advanced formulations that cater to the growing demand for natural and effective wellness solutions.
| Market Scope | |
|---|---|
| Start Year | 2024 |
| Forecast Year | 2025-2034 |
| Start Value | $1.1 Billion |
| Forecast Value | $3.1 Billion |
| CAGR | 11.6% |
The marine processing waste segment generated USD 454.7 million in 2024. This category, comprising fish, aquaculture, and shellfish residues, is rich in bioactive molecules, making it an essential source for high-purity peptide production. These compounds are increasingly used in industries such as nutraceuticals, cosmetics, and functional foods because of their high nutritional and therapeutic potential.
The healthcare and pharmaceutical segment accounted for a 32.5% share in 2024. This dominance is attributed to the growing use of bioactive peptides in drug development, medical nutrition, and clinical formulations aimed at managing chronic diseases. Increasing demand from aging populations and health-focused consumers has further strengthened the adoption of bioactive compounds with anti-inflammatory, antihypertensive, and antioxidant effects.
North America Bioactive Peptide from Food Waste Market will grow at a CAGR of 11.5% between 2025 and 2034. Market growth is supported by the rising preference for natural, healthy, and sustainable food ingredients. As health-conscious consumers increasingly seek functional foods, supplements, and nutraceutical products, manufacturers in the region are investing in bioactive peptide integration within food and beverage innovations.
Leading companies operating in Bioactive Peptide from Food Waste Market include Arla Foods Ingredients Group, DSM-Firmenich, Fonterra (NZMP), GELITA, Glanbia plc, Kerry Group plc, Novonesis, PB Leiner, Rousselot, and Tessenderlo Group. Companies are focusing on strategic collaborations, sustainable product innovations, and advanced extraction technologies to enhance their market presence. Leading manufacturers are investing in green production methods to improve peptide quality and minimize environmental impact. Many firms are strengthening their R&D capabilities to expand product portfolios catering to health-focused applications. Partnerships with food processors and biotech firms are also enabling efficient utilization of waste materials. Additionally, market players are adopting branding strategies centered on sustainability and clean-label claims to attract eco-conscious consumers.
Table of Contents
Chapter 1 Methodology & Scope
- 1.1 Market scope and definition
- 1.2 Research design
- 1.2.1 Research approach
- 1.2.2 Data collection methods
- 1.3 Data mining sources
- 1.3.1 Global
- 1.3.2 Regional/Country
- 1.4 Base estimates and calculations
- 1.4.1 Base year calculation
- 1.4.2 Key trends for market estimation
- 1.5 Primary research and validation
- 1.5.1 Primary sources
- 1.6 Forecast model
- 1.7 Research assumptions and limitations
Chapter 2 Executive Summary
- 2.1 Industry 3600 synopsis
- 2.2 Key market trends
- 2.2.1 Source trends
- 2.2.2 End use industry trends
- 2.2.3 Regional trends
- 2.3 TAM Analysis, 2025-2034
- 2.4 CXO perspectives: strategic imperatives
- 2.4.1 Executive decision points
- 2.4.2 Critical success factors
- 2.5 Future outlook and strategic recommendations
Chapter 3 Industry Insights
- 3.1 Industry ecosystem analysis
- 3.1.1 Supplier landscape
- 3.1.2 Profit margin
- 3.1.3 Value addition at each stage
- 3.1.4 Factor affecting the value chain
- 3.1.5 Disruptions
- 3.2 Industry impact forces
- 3.2.1 Growth drivers
- 3.2.1.1 Growing focus on circular economy & waste valorization
- 3.2.1.2 Rising demand for natural & clean-label ingredients
- 3.2.1.3 Supportive regulatory framework for food waste utilization
- 3.2.2 Industry pitfalls and challenges
- 3.2.2.1 Consumer perception issues with waste-derived ingredients
- 3.2.2.2 Quality control & contamination management
- 3.2.3 Market opportunities
- 3.2.3.1 Untapped food waste streams in emerging markets
- 3.2.3.2 Integration with personalized nutrition trends
- 3.2.1 Growth drivers
- 3.3 Growth potential analysis
- 3.4 Regulatory landscape
- 3.4.1 North America
- 3.4.2 Europe
- 3.4.3 Asia Pacific
- 3.4.4 Latin America
- 3.4.5 Middle East & Africa
- 3.5 Porter's analysis
- 3.6 PESTEL analysis
- 3.7 Technology and Innovation landscape
- 3.7.1 Current technological trends
- 3.7.2 Emerging technologies
- 3.8 Price trends
- 3.8.1 By region
- 3.8.2 By source
- 3.9 Future market trends
- 3.10 Patent Landscape
- 3.11 Trade statistics (HS code) ( Note: the trade statistics will be provided for key countries only)
- 3.11.1 Major importing countries
- 3.11.2 Major exporting countries
- 3.12 Sustainability and environmental aspects
- 3.12.1 Sustainable practices
- 3.12.2 Waste reduction strategies
- 3.12.3 Energy efficiency in production
- 3.12.4 Eco-friendly initiatives
- 3.13 Carbon footprint consideration
Chapter 4 Competitive Landscape, 2024
- 4.1 Introduction
- 4.2 Company market share analysis
- 4.2.1 By region
- 4.2.1.1 North America
- 4.2.1.2 Europe
- 4.2.1.3 Asia Pacific
- 4.2.1.4 LATAM
- 4.2.1.5 MEA
- 4.2.1 By region
- 4.3 Company matrix analysis
- 4.4 Competitive analysis of major market players
- 4.5 Competitive positioning matrix
- 4.6 Key developments
- 4.6.1 Mergers & acquisitions
- 4.6.2 Partnerships & collaborations
- 4.6.3 New product launches
- 4.6.4 Expansion plans
Chapter 5 Market Estimates and Forecast, By Source, 2021-2034 (USD Million) (Kilo Tons)
- 5.1 Key trends
- 5.2 Dairy waste streams
- 5.2.1 Whey processing residues
- 5.2.2 Cheese manufacturing byproducts
- 5.2.3 Milk processing waste
- 5.3 Meat processing byproducts
- 5.3.1 Blood & plasma fractions
- 5.3.2 Skin & hide processing waste
- 5.3.3 Bone & cartilage residues
- 5.3.4 Organ meat processing byproducts
- 5.4 Marine processing waste
- 5.4.1 Fish processing residues
- 5.4.2 Shellfish processing byproducts
- 5.4.3 Aquaculture waste streams
- 5.5 Plant protein residues
- 5.5.1 Oilseed processing meals
- 5.5.2 Grain processing byproducts
- 5.5.3 Pulse processing residues
- 5.5.4 Fruit & vegetable processing waste
Chapter 6 Market Estimates and Forecast, By End Use Industry, 2021-2034 (USD Million) (Kilo Tons)
- 6.1 Key trends
- 6.2 Healthcare & pharmaceutical
- 6.2.1 Nutraceutical & dietary supplement
- 6.2.2 Therapeutic drug development
- 6.2.3 Medical nutrition
- 6.2.4 Clinical research & development
- 6.2.5 Over-the-counter (OTC) medicine
- 6.3 Food & beverage
- 6.3.1 Functional food ingredient
- 6.3.2 Protein fortification
- 6.3.3 Natural preservative
- 6.3.4 Flavor enhancement
- 6.3.5 Fermented product
- 6.3.6 Beverage fortification
- 6.4 Personal care & cosmetics
- 6.4.1 Anti-aging skincare
- 6.4.2 Moisturizing & hydration
- 6.4.3 Hair care & scalp health
- 6.4.4 Wound care & healing
- 6.4.5 Sun protection
- 6.4.6 Men's grooming
- 6.5 Animal feed & nutrition
- 6.5.1 Aquaculture feed
- 6.5.2 Livestock feed supplement
- 6.5.3 Pet food & treats
- 6.5.4 Poultry feed
- 6.5.5 Swine feed
- 6.5.6 Ruminant feed
- 6.6 Agriculture & biotechnology
- 6.6.1 Bio-stimulant
- 6.6.2 Plant growth promoter
- 6.6.3 Soil health enhancement
- 6.6.4 Crop protection
- 6.6.5 Seed treatment
- 6.7 Sports nutrition & fitness
- 6.7.1 Pre-workout supplement
- 6.7.2 Post-workout recovery
- 6.7.3 Protein powder
- 6.7.4 Energy bar & snack
- 6.7.5 Hydration product
Chapter 7 Market Estimates and Forecast, By Region, 2021-2034 (USD Million) (Kilo Tons)
- 7.1 Key trends
- 7.2 North America
- 7.2.1 U.S.
- 7.2.2 Canada
- 7.3 Europe
- 7.3.1 Germany
- 7.3.2 UK
- 7.3.3 France
- 7.3.4 Spain
- 7.3.5 Italy
- 7.3.6 Rest of Europe
- 7.4 Asia Pacific
- 7.4.1 China
- 7.4.2 India
- 7.4.3 Japan
- 7.4.4 Australia
- 7.4.5 South Korea
- 7.4.6 Rest of Asia Pacific
- 7.5 Latin America
- 7.5.1 Brazil
- 7.5.2 Mexico
- 7.5.3 Argentina
- 7.5.4 Rest of Latin America
- 7.6 Middle East and Africa
- 7.6.1 Saudi Arabia
- 7.6.2 South Africa
- 7.6.3 UAE
- 7.6.4 Rest of Middle East and Africa
Chapter 8 Company Profiles
- 8.1 Arla Foods Ingredients Group
- 8.2 DSM-Firmenich
- 8.3 Fonterra (NZMP)
- 8.4 GELITA
- 8.5 Glanbia plc
- 8.6 Kerry Group plc
- 8.7 Novonesis
- 8.8 PB Leiner
- 8.9 Rousselot
- 8.10 Tessenderlo Group
