


 |
市場調查報告書
商品編碼
1858999
溶解氣體分析儀 (DGA) 市場機會、成長促進因素、產業趨勢分析及預測(2025-2034 年)Dissolved Gas Analyzer (DGA) Market Opportunity, Growth Drivers, Industry Trend Analysis, and Forecast 2025 - 2034 |
||||||
2024 年全球溶解氣體分析儀 (DGA) 市值為 5.78 億美元,預計到 2034 年將以 6.3% 的複合年成長率成長至 10.5 億美元。
電力產業和工業領域對老舊電力基礎設施高效監測的需求日益成長,推動了溶解氣體分析儀(DGA)市場的發展。 DGA透過分析絕緣油中溶解的氣體,在電力變壓器早期故障的檢測中發揮著至關重要的作用。隨著舊電網可靠性的下降,DGA系統正被廣泛採用,以預防設備故障、減少停機時間並最佳化維護計劃。電力公司優先考慮基於狀態的監測,以延長資產壽命並避免計劃外停電,這極大地促進了這些技術的應用。 DGA系統還支援預測性維護策略,這些策略與更廣泛的電網現代化工作一致,並確保長期電力穩定性。人們對變壓器診斷在提高永續性和可靠性方面的認知不斷提高,進一步鞏固了市場的發展勢頭,尤其是在電力公司和工業營運商面臨著提高正常運行時間和降低與老舊能源資產相關的營運風險的壓力之際。
| 市場範圍 | |
|---|---|
| 起始年份 | 2024 |
| 預測年份 | 2025-2034 |
| 起始值 | 5.78億美元 |
| 預測值 | 10.5億美元 |
| 複合年成長率 | 6.3% |
2024年,多氣體系統市佔率達到62%,預計2034年將維持6.4%的複合年成長率。這些系統旨在同時檢測和測量各種工業條件下的多種氣體類型。它們配備了先進的感測技術,可分析甲烷、一氧化碳、二氧化碳、氧氣和揮發性有機化合物(VOCs)等氣體,提供準確的即時資料,這對於確保運行安全和環境合規至關重要。其多功能性和可靠性使其成為工業監測和變壓器診斷的首選。
現代數位協議領域在2024年佔據了63%的市場佔有率,預計2025年至2034年將以6.4%的複合年成長率成長。 DNP3和IEC 61850等數位通訊標準正日益整合到智慧電網和數位變電站。這些協定能夠實現複雜電力系統中快速、安全且可擴展的資料傳輸,支援基於事件的通訊和即時系統監控。它們在增強不同設備生態系統間的互通性和預測分析方面發揮著重要作用,這是推動該領域成長的關鍵因素。
2024年,美國溶解氣體分析儀(DGA)市場規模達1.523億美元,反映出市場對變壓器健康監測工具的強勁需求。北美地區憑藉其老化的電網基礎設施、嚴格的監管標準以及對智慧電網技術的快速投資,繼續引領全球DGA市場。該地區也聚集了大量的DGA製造商和解決方案供應商,進一步推動了先進監測解決方案的創新和部署,從而保障電網可靠性。
在全球溶解氣體分析儀 (DGA) 市場中,西門子股份公司 (Siemens AG)、MTE Meter Test Equipment AG、GE Vernova Inc.、EMH Energie-Messtechnik GmbH、Vaisala Oyj、ABB Ltd.、LumaSense Technologies. Inc.、Doble Engineering Company、Qualitrol Company LLC 和思源電氣股份有限公司 (Sieyuan Electric Co. Ltd.) 等公司為主要參與者。這些公司正透過有針對性的創新、策略合作和產品組合拓展來鞏固其市場地位。許多企業正在投資下一代感測器技術和人工智慧分析,以提高氣體檢測系統的精度和即時性能。製造商還將他們的 DGA 產品與更廣泛的變壓器監測平台整合,從而提供端到端的診斷解決方案。一些公司專注於開發緊湊型模組化系統,以滿足現代變電站的空間限制。
目錄
第1章:方法論與範圍
第2章:執行概要
第3章:行業洞察
- 產業生態系分析
- 供應商格局
- 利潤率
- 每個階段的價值增加
- 影響價值鏈的因素
- 中斷
- 產業影響因素
- 成長促進因素
- 老化的電力基礎設施
- 電網可靠性的需求日益成長
- 監管和安全合規性
- 產業陷阱與挑戰
- 高初始投資
- 技術工人短缺和勞動市場波動
- 機會
- 成長促進因素
- 成長潛力分析
- 市場進入與定位策略
- 監管環境
- 主要市場趨勢和顛覆性因素
- 從離線實驗室分析轉向線上即時監測
- 與資產績效管理 (APM) 和人工智慧平台整合
- 更重視電網可靠性和韌性
- 再生能源併網和基礎設施老化是需求促進因素。
- 向整體性、多參數變壓器監測過渡
- 技術和創新格局
- 當前技術趨勢
- 下一代感測器技術(PAS、NDIR、固態)
- 邊緣運算助力車載診斷和更快警報
- 先進的軟體和人工智慧驅動的診斷演算法
- 模組化設計和增強的連接性(IEC 61850)
- 免維護且低耗材的系統
- 新興技術
- 先進光學感測:整合光纖實現非侵入式監測
- 人工智慧與數位孿生技術的融合:增強故障預測和資產模擬
- 車隊整體健康評估的數據分析:從單一資產到電網層級洞察
- 替代絕緣液:開發適用於酯類油和其他環保液體的DGA解決方案
- 當前技術趨勢
- 2024年定價分析
- 產品成本
- 單氣體系統
- 多氣體系統
- 組件/訂閱費用
- 載氣鋼瓶(例如,氬氣,用於氣相層析儀)
- 年度軟體和數據分析訂閱(按資產計)
- 原物料供應中的實際產能限制與感知產能限制
- 產品成本
- 供應商價格上漲趨勢驗證未來市場趨勢
- 人工智慧驅動的預測性維護與自主電網管理
- 採用資料生成代理即服務 (DaaS) 和訂閱模式
- 風險評估與緩解
- 監理合規風險
- 產能限制影響分析
- 技術轉型風險
- 價格波動和成本上漲風險
- 波特五力分析
- PESTEL 分析
第4章:競爭格局
- 介紹
- 介紹
- 公司市佔率分析
- 按地區
- 北美洲
- 歐洲
- 亞太地區
- MEA
- 拉丁美洲
- 按地區
- 公司矩陣分析
- 主要市場參與者的競爭分析
- 競爭定位矩陣
- 關鍵進展
- 併購
- 合作夥伴關係與合作
- 新產品發布
- 擴張計劃
第5章:市場估算與預測:依產品類型分類,2021-2034年
- 單氣體系統
- 多氣體系統
- 其他
第6章:市場估算與預測:依安裝類型分類,2021-2034年
- 永久線上系統
- 攜帶式現場單元
- 實驗室整合系統
- 其他
第7章:市場估算與預測:依開採類型分類,2021-2034年
- 真空抽取
- 頂空萃取
- 脫硫柱法
- 其他
第8章:市場估算與預測:依流體類型分類,2021-2034年
- 礦物油系統
- 天然酯體系
- 合成酯體系
- 矽油系統
- 其他
第9章:市場估算與預測:依功率等級分類,2021-2034年
- 100-500兆伏安
- 501-800兆伏安
- 801 - 1200 兆伏安
- 其他
第10章:市場估計與預測:依協議系統分類,2021-2034年
- 傳統協定系統
- 現代數位協議系統
- 其他
第11章:市場估計與預測:依最終用途產業分類,2021-2034年
- 能源與電力
- 化學
- 礦業
- 石油和天然氣
- 紙漿和造紙
- 其他
第12章:市場估算與預測:依配銷通路,2021-2034年
- 間接銷售
- 直銷
第13章:市場估計與預測:依地區分類,2021-2034年
- 主要趨勢
- 北美洲
- 美國
- 加拿大
- 歐洲
- 英國
- 德國
- 法國
- 義大利
- 西班牙
- 俄羅斯
- 亞太地區
- 中國
- 印度
- 日本
- 韓國
- 澳洲
- 拉丁美洲
- 巴西
- 墨西哥
- MEA
- 南非
- 沙烏地阿拉伯
- 阿拉伯聯合大公國
第14章:公司簡介
- ABB Ltd
- GE Vernova Inc.
- Siemens AG
- Hitachi Energy Ltd
- Qualitrol Company LLC
- Doble Engineering Company
- Vaisala Oyj
- MTE Meter Test Equipment AG
- Weidmann Electrical Technology AG
- Advanced Energy Industries Inc.
- Sieyuan Electric Co Ltd
- Gatron GmbH
- Morgan Schaffer
- EMH Energie-Messtechnik
- LumaSense Technologies
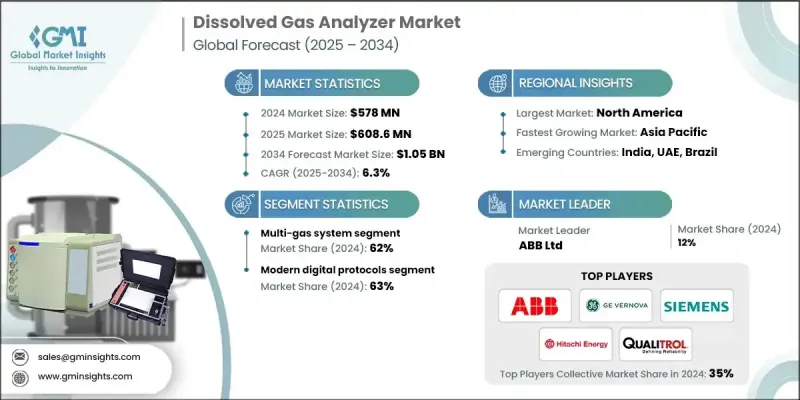
The Global Dissolved Gas Analyzer (DGA) Market was valued at USD 578 million in 2024 and is estimated to grow at a CAGR of 6.3% to reach USD 1.05 billion by 2034.
The growth is fueled by the rising need for efficient monitoring of aging power infrastructure across utilities and industrial sectors. Dissolved gas analyzers (DGAs) are instrumental in detecting early-stage faults in power transformers by analyzing gases dissolved in insulating oils. As aging grids struggle with reliability, DGA systems are being adopted to prevent equipment failures, reduce downtime, and optimize maintenance schedules. Utilities are prioritizing condition-based monitoring to extend asset life and avoid unplanned outages, which is driving strong adoption of these technologies. DGA systems also support predictive maintenance strategies that align with broader grid modernization efforts and ensure long-term power stability. The increasing awareness of transformer diagnostics for improved sustainability and reliability further reinforces the market's forward momentum, especially as utility providers and industrial operators face pressure to improve uptime and reduce operational risks tied to older energy assets.
| Market Scope | |
|---|---|
| Start Year | 2024 |
| Forecast Year | 2025-2034 |
| Start Value | $578 Million |
| Forecast Value | $1.05 Billion |
| CAGR | 6.3% |
In 2024, the multi-gas system segment held a 62% share and is expected to maintain growth at a CAGR of 6.4% through 2034. These systems are designed to simultaneously detect and measure multiple gas types across various industrial conditions. Equipped with advanced sensing technologies, they can analyze gases such as methane, carbon monoxide, carbon dioxide, oxygen, and VOCs, offering accurate real-time data essential for ensuring operational safety and environmental compliance. Their versatility and reliability make them the preferred choice in industrial monitoring and transformer diagnostics.
The modern digital protocols segment accounted for a 63% share in 2024 and is anticipated to grow at a CAGR of 6.4% from 2025 to 2034. Digital communication standards such as DNP3 and IEC 61850 are increasingly integrated into smart grids and digital substations. These protocols enable fast, secure, and scalable data transmission across complex power systems, supporting event-based communication and real-time system monitoring. Their role in enhancing interoperability and predictive analytics across diverse device ecosystems is a key factor driving growth in this segment.
U.S. Dissolved Gas Analyzer (DGA) Market generated USD 152.3 million in 2024, reflecting strong demand for transformer health monitoring tools. North America continues to lead the global DGA market due to its aging grid infrastructure, high regulatory standards, and rapid investments in smart grid technologies. The region also hosts a dense concentration of DGA manufacturers and solution providers, further bolstering innovation and deployment of advanced monitoring solutions to maintain grid reliability.
Key companies shaping the Global Dissolved Gas Analyzer (DGA) Market include Siemens AG, MTE Meter Test Equipment AG, GE Vernova Inc., EMH Energie-Messtechnik GmbH, Vaisala Oyj, ABB Ltd., LumaSense Technologies, Hitachi Energy Ltd, Gatron GmbH, Morgan Schaffer, Weidmann Electrical Technology AG, Advanced Energy Industries Inc., Doble Engineering Company, Qualitrol Company LLC, and Sieyuan Electric Co. Ltd. Companies in the Dissolved Gas Analyzer (DGA) Market are strengthening their market position through targeted innovation, strategic partnerships, and portfolio expansion. Many players are investing in next-gen sensor technologies and AI-powered analytics to enhance the accuracy and real-time performance of gas detection systems. Manufacturers are also integrating their DGA products with broader transformer monitoring platforms, providing end-to-end diagnostic solutions. Several firms focus on developing compact and modular systems to meet the space constraints of modern substations.
Table of Contents
Chapter 1 Methodology & Scope
- 1.1 Market scope and definition
- 1.2 Research design
- 1.2.1 Research approach
- 1.2.2 Data collection methods
- 1.3 Data mining sources
- 1.3.1 Global
- 1.3.2 Regional/Country
- 1.4 Base estimates and calculations
- 1.4.1 Base year calculation
- 1.4.2 Key trends for market estimation
- 1.5 Primary research and validation
- 1.5.1 Primary sources
- 1.6 Forecast model
- 1.7 Research assumptions and limitations
Chapter 2 Executive Summary
- 2.1 Industry 3600 synopsis
- 2.2 Key market trends
- 2.2.1 Regional
- 2.2.2 Product type
- 2.2.3 Fluid type
- 2.2.4 Protocol systems
- 2.2.5 Extraction type
- 2.2.6 Installation type
- 2.2.7 Power rating
- 2.2.8 End use industry
- 2.2.9 Distribution channel
- 2.3 CXO perspectives: strategic imperatives
- 2.3.1 Key decision points for industry executives
- 2.3.2 Critical success factors for market players
- 2.4 Future outlook and strategic recommendations
- 2.5 Strategic recommendations
- 2.5.1 Supply chain diversification strategy
- 2.5.2 Product portfolio enhancement
- 2.5.3 Partnership and alliance opportunities
- 2.5.4 Cost management and pricing strategy
- 2.6 Decision framework
- 2.6.1 Investment priority matrix
- 2.6.2 Risk-adjusted ROI analysis
Chapter 3 Industry Insights
- 3.1 Industry ecosystem analysis
- 3.1.1 Supplier Landscape
- 3.1.2 Profit Margin
- 3.1.3 Value addition at each stage
- 3.1.4 Factor affecting the value chain
- 3.1.5 Disruptions
- 3.2 Industry Impact forces
- 3.2.1 Growth drivers
- 3.2.1.1 Aging power infrastructure
- 3.2.1.2 Rising demand for grid reliability
- 3.2.1.3 Regulatory and safety compliance
- 3.2.2 Industry pitfalls & challenges
- 3.2.2.1 High initial investment
- 3.2.2.2 Skilled labor shortage and workforce volatility
- 3.2.3 Opportunities
- 3.2.1 Growth drivers
- 3.3 Growth potential analysis
- 3.4 Market entry and positioning strategy
- 3.5 Regulatory landscape
- 3.5.1 North America
- 3.5.2 Europe
- 3.5.3 Asia Pacific
- 3.5.4 Latin America
- 3.5.5 MEA
- 3.6 Major market trends and disruptions
- 3.6.1 Shift from offline lab analysis to online, real-time monitoring
- 3.6.2 Integration with asset performance management (APM) & AI platforms
- 3.6.3 Increased focus on grid reliability and resilience
- 3.6.4 Demand driven by renewable energy integration and aging infrastructure
- 3.6.5 Transition to holistic, multi-parameter transformer monitoring
- 3.7 Technological and innovation landscape
- 3.7.1 Current technological trends
- 3.7.1.1 Next-generation sensor technologies (PAS, NDIR, solid-state)
- 3.7.1.2 Edge computing for onboard diagnostics and faster alerts
- 3.7.1.3 Advanced software and AI-driven diagnostic algorithms
- 3.7.1.4 Modular designs and enhanced connectivity (IEC 61850)
- 3.7.1.5 Maintenance-free and low-consumable systems
- 3.7.2 Emerging technologies
- 3.7.2.1 Advanced optical sensing: Integrating fiber optics for non-invasive monitoring
- 3.7.2.2 AI and digital twin integration: Enhancing fault prediction and asset simulation
- 3.7.2.3 Data analytics for fleet-wide health assessment: From single-asset to grid-level insights
- 3.7.2.4 Alternative insulating fluids: Developing DGA solutions for ester oils and other eco-friendly liquids
- 3.7.1 Current technological trends
- 3.8 Pricing analysis, 2024
- 3.8.1 Product cost
- 3.8.1.1 Single-Gas Systems
- 3.8.1.2 Multi-Gas Systems
- 3.8.2 Component/ Subscription cost
- 3.8.2.1 Carrier Gas Cylinder (e.g., Argon, for GC-based units)
- 3.8.2.2 Annual Software & Data Analytics Subscription (per asset)
- 3.8.3 Real vs. perceived capacity constraints in supply of raw materials
- 3.8.1 Product cost
- 3.9 Supplier price increase validation future market trends
- 3.9.1 AI-driven predictive maintenance and autonomous grid management
- 3.9.2 Adoption of DGA-as-a-Service (DaaS) and subscription-based models
- 3.10 Risk assessment and mitigation
- 3.10.1 Regulatory compliance risks
- 3.10.2 Capacity constraint impact analysis
- 3.10.3 Technology transition risks
- 3.10.4 Pricing volatility and cost escalation risks
- 3.11 Porter's five forces analysis
- 3.12 PESTEL analysis
Chapter 4 Competitive Landscape, 2024
- 4.1 Introduction
- 4.2 Introduction
- 4.3 Company market share analysis
- 4.3.1 By region
- 4.3.1.1 North America
- 4.3.1.2 Europe
- 4.3.1.3 Asia Pacific
- 4.3.1.4 MEA
- 4.3.1.5 LATAM
- 4.3.1 By region
- 4.4 Company matrix analysis
- 4.5 Competitive analysis of major market players
- 4.6 Competitive positioning matrix
- 4.7 Key developments
- 4.7.1 Mergers & acquisitions
- 4.7.2 Partnerships & collaborations
- 4.7.3 New Product Launches
- 4.7.4 Expansion Plans
Chapter 5 Market Estimates & Forecast, By Product Type, 2021 - 2034 (USD Million) (Thousand Units)
- 5.1 Single-Gas Systems
- 5.2 Multi-Gas Systems
- 5.3 Others
Chapter 6 Market Estimates & Forecast, By Installation Type, 2021 - 2034 (USD Million) (Thousand Units)
- 6.1 Permanent Online Systems
- 6.2 Portable Field Units
- 6.3 Laboratory Integration Systems
- 6.4 Others
Chapter 7 Market Estimates & Forecast, By Extraction Type, 2021 - 2034 (USD Million) (Thousand Units)
- 7.1 Vacuum extraction
- 7.2 Headspace extraction
- 7.3 Stripper column method
- 7.4 Others
Chapter 8 Market Estimates & Forecast, By Fluid Type, 2021 - 2034 (USD Million) (Thousand Units)
- 8.1 Mineral Oil Systems
- 8.2 Natural Ester Systems
- 8.3 Synthetic Ester Systems
- 8.4 Silicone Fluid Systems
- 8.5 Others
Chapter 9 Market Estimates & Forecast, By Power Rating, 2021 - 2034 (USD Million) (Thousand Units)
- 9.1 100 - 500 MVA
- 9.2 501 - 800 MVA
- 9.3 801 - 1200 MVA
- 9.4 Others
Chapter 10 Market Estimates & Forecast, By Protocol Systems, 2021 - 2034 (USD Million) (Thousand Units)
- 10.1 Legacy Protocol Systems
- 10.2 Modern Digital Protocol Systems
- 10.3 Others
Chapter 11 Market Estimates & Forecast, By End Use Industry, 2021 - 2034 (USD Million) (Thousand Units)
- 11.1 Energy & Power
- 11.2 Chemical
- 11.3 Mining
- 11.4 Oil & Gas
- 11.5 Pulp & Paper
- 11.6 Others
Chapter 12 Market Estimates & Forecast, By Distribution Channel, 2021 - 2034 (USD Million) (Thousand Units)
- 12.1 Indirect sales
- 12.2 Direct sales
Chapter 13 Market Estimates & Forecast, By Region, 2021 - 2034 (USD Million) (Thousand Units)
- 13.1 Key trends
- 13.2 North America
- 13.2.1 U.S.
- 13.2.2 Canada
- 13.3 Europe
- 13.3.1 UK
- 13.3.2 Germany
- 13.3.3 France
- 13.3.4 Italy
- 13.3.5 Spain
- 13.3.6 Russia
- 13.4 Asia Pacific
- 13.4.1 China
- 13.4.2 India
- 13.4.3 Japan
- 13.4.4 South Korea
- 13.4.5 Australia
- 13.5 Latin America
- 13.5.1 Brazil
- 13.5.2 Mexico
- 13.6 MEA
- 13.6.1 South Africa
- 13.6.2 Saudi Arabia
- 13.6.3 UAE
Chapter 14 Company Profiles
- 14.1 ABB Ltd
- 14.2 GE Vernova Inc.
- 14.3 Siemens AG
- 14.4 Hitachi Energy Ltd
- 14.5 Qualitrol Company LLC
- 14.6 Doble Engineering Company
- 14.7 Vaisala Oyj
- 14.8 MTE Meter Test Equipment AG
- 14.9 Weidmann Electrical Technology AG
- 14.10 Advanced Energy Industries Inc.
- 14.11 Sieyuan Electric Co Ltd
- 14.12 Gatron GmbH
- 14.13 Morgan Schaffer
- 14.14 EMH Energie-Messtechnik
- 14.15 LumaSense Technologies


