

 |
市場調查報告書
商品編碼
1844253
自助服務分析市場機會、成長動力、產業趨勢分析及 2025 - 2034 年預測Self-Service Analytics Market Opportunity, Growth Drivers, Industry Trend Analysis, and Forecast 2025 - 2034 |
||||||
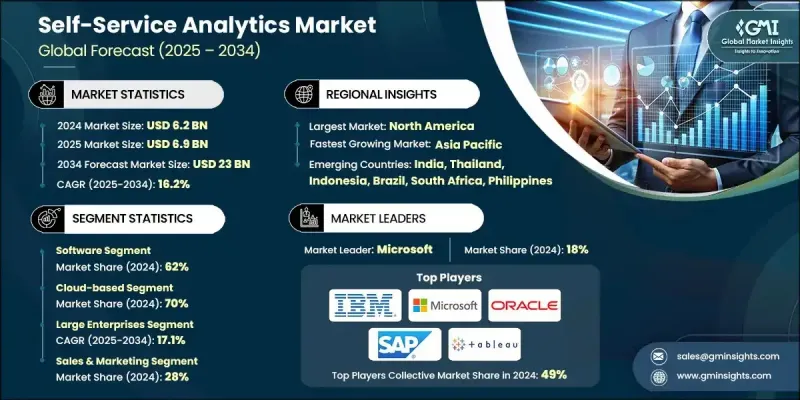
2024 年全球自助服務分析市場價值為 62 億美元,預計到 2034 年將以 16.2% 的複合年成長率成長至 230 億美元。
這一快速成長的動力源於企業對更快、更獨立的資料存取和分析日益成長的需求。自助式分析使員工能夠自主探索、視覺化和解讀資料,從而消除對 IT 部門的傳統依賴,並實現即時的數據驅動決策。隨著企業轉向敏捷營運,對支援快速洞察和競爭適應能力的工具的需求持續成長。資料民主化和跨職能資料存取的廣泛推動,正在將分析轉變為策略規劃的核心組成部分。此外,企業也意識到自助式分析是擴展決策規模並提高營運效率的關鍵推動力。
| 市場範圍 | |
|---|---|
| 起始年份 | 2024 |
| 預測年份 | 2025-2034 |
| 起始值 | 62億美元 |
| 預測值 | 230億美元 |
| 複合年成長率 | 16.2% |
隨著自動化、物聯網整合和永續雲端技術的不斷進步,越來越多的公司正在採用智慧自助式分析平台。這些系統可以減輕IT負擔,降低營運成本,並支援跨部門的預測性和即時分析。隨著節能雲端運算的日益普及,各行各業都擴大採用這種技術,並優先考慮合規性、效能和長期數位轉型。對永續性和治理改進的追求也使自助式分析成為企業資料策略中負責任創新的前沿。
2024年,軟體領域佔據62%的市場佔有率,預計到2034年將以16.7%的複合年成長率成長。軟體的主導地位歸功於人工智慧工具、高級視覺化和自然語言介面的日益普及,這些技術加速了業務決策和預測。這些平台在北美、亞太和歐洲等地區廣泛應用,這些地區的法規、資料可存取性和可擴展架構要求日益提高。企業之所以青睞這些軟體解決方案,是因為它們易於部署、相容雲,並且能夠整合到混合IT生態系統中。
2024年,基於雲端的部署細分市場佔據了70%的佔有率,預計在2025年至2034年期間將以17%的複合年成長率成長。基於雲端的自助服務分析之所以受歡迎,源自於其可擴展性、經濟實惠性和遠端存取能力,使其成為動態工作環境和即時營運的理想選擇。企業正在採用雲端部署模式,以實現靈活性、降低硬體依賴性和成本管理。訂閱模式的廣泛採用,加上對多雲營運的支持,對於希望保持敏捷性和競爭力的中小型企業尤其具有吸引力。
2024年,北美自助服務分析市場佔據49%的市場佔有率,這得益於廣泛的企業數位化、強大的雲端基礎設施以及透過資料自主賦能團隊的高度重視。美國和加拿大的組織擴大轉向去中心化分析方法,以簡化決策並減少IT瓶頸。高級分析解決方案的廣泛應用使北美成為自助服務分析領域創新和快速應用的中心。
自助服務分析市場的主要參與者包括亞馬遜網路服務 (AWS)、Qlik Technologies、SAS、SAP、微軟、IBM、Tableau Software (Salesforce)、TIBCO Software、甲骨文和 Sisense。為了提升影響力,自助服務分析領域的領先公司正在採取多項策略措施。許多公司專注於透過人工智慧功能、自動化資料準備和自然語言查詢來擴展其產品功能,以簡化使用者體驗。與雲端生態系統的整合以及對混合基礎設施的支援使公司能夠滿足各種企業需求。與其他技術供應商和雲端平台的合作有助於擴大覆蓋範圍並增強相容性。
目錄
第1章:方法論
- 市場範圍和定義
- 研究設計
- 研究方法
- 資料收集方法
- 資料探勘來源
- 全球的
- 地區/國家
- 基礎估算與計算
- 基準年計算
- 市場評估的主要趨勢
- 初步研究和驗證
- 主要來源
- 預測模型
- 研究假設和局限性
第 2 章:執行摘要
第3章:行業洞察
- 產業生態系統分析
- 供應商格局
- 利潤率分析
- 成本結構
- 每個階段的增值
- 影響價值鏈的因素
- 中斷
- 產業衝擊力
- 成長動力
- 對數據驅動決策的需求不斷成長
- 基於雲端的分析平台的擴展
- 人工智慧與自然語言處理(NLP)的融合
- 各行各業的數位轉型日益加深
- 減少 IT 依賴的需求日益增加
- 產業陷阱與挑戰
- 數據品質與治理問題
- 與遺留系統的整合複雜性
- 市場機會
- 人工智慧與機器學習整合
- 中小型企業採用
- 產業特定解決方案開發
- 嵌入式分析擴展
- 新興市場滲透
- 邊緣和物聯網分析應用程式
- 成長動力
- 成長潛力分析
- 監管格局
- GDPR資料保護合規性
- CCPA隱私法規的影響
- NIST網路安全框架
- 行業特定的資料法規
- 國際資料傳輸要求
- 人工智慧治理與道德準則
- 審計與合規報告標準
- 波特的分析
- PESTEL分析
- 技術和創新格局
- 當前的技術趨勢
- 人工智慧與機器學習整合
- 自然語言處理的進展
- 自動化資料準備的演變
- 即時和串流分析
- 雲端原生架構創新
- 新興技術
- 行動分析技術
- 嵌入式分析功能
- 數據視覺化創新
- API 和整合技術
- 未來科技場景
- 全自動分析
- 對話式人工智慧分析
- 擴增實境資料視覺化
- 量子計算分析
- 情境規劃框架
- 當前的技術趨勢
- 價格趨勢分析
- 按解決方案類型分類的歷史定價演變
- 區域價格差異
- 訂閱與永久授權定價
- 基於用戶與基於容量的定價
- 功能層級定價策略
- 總擁有成本分析
- 成本分解分析
- 軟體授權和訂閱費用
- 實施和整合費用
- 培訓和管理成本
- 資料基礎設施和儲存成本
- 持續維護和支持
- 合規與治理費用
- 專利分析
- 永續性和環境方面
- 永續實踐
- 減少廢棄物的策略
- 生產中的能源效率
- 環保舉措
- 碳足跡考慮
- 資料治理與品質管理
- 資料存取控制和安全
- 數據品質保證協議
- 主資料管理整合
- 數據沿襲和可追溯性
- 隱私保護機制
- 審計追蹤和合規性監控
- 資料管理計劃
- 投資格局分析
- 分析領域的創投
- 企業投資與收購活動
- 政府 IT 現代化資金
- 學術研究投資
- 企業分析預算分配
- 以投資類型進行的投資報酬率分析
- 技術開發資金
- 客戶行為分析
- 分析工具選擇標準
- 使用者採用和參與模式
- 自助服務與 IT 主導的分析偏好
- 培訓和支援要求
- 成功指標和關鍵績效指標追蹤
- 預算分配決策
- 區域偏好差異
- 市場進入壁壘
- 技術開發的複雜性
- 資料整合和相容性挑戰
- 使用者體驗設計要求
- 監理合規成本
- 客戶信任與品牌認知
- 合作夥伴關係和通路發展
- 風險評估框架
- 資料安全和隱私風險
- 監理合規風險
- 技術過時的風險
- 供應商鎖定和依賴風險
- 數據品質與治理風險
- 用戶採用和變更管理風險
- 整合和相容性風險
- 數位轉型整合
- 企業分析策略協調
- 雲端遷移的影響
- 數據策略與治理演變
- 敏捷分析開發
- DevOps 和 DataOps 整合
- 組織變革管理
- 使用者體驗與設計
- 直覺的介面設計原則
- 拖曳功能
- 視覺化分析最佳實踐
- 行動用戶體驗最佳化
- 無障礙與包容性設計
- 使用者反饋和迭代周期
第4章:競爭格局
- 介紹
- 公司市佔率分析
- 北美洲
- 歐洲
- 亞太地區
- 拉丁美洲
- 多邊環境協定
- 主要市場參與者的競爭分析
- 競爭定位矩陣
- 戰略展望矩陣
- 關鍵進展
- 併購
- 夥伴關係與合作
- 新產品發布
- 擴張計劃和資金
第5章:市場估計與預測:依組件分類,2021 - 2034 年
- 主要趨勢
- 軟體
- 數據發現和視覺化工具
- 報告工具
- 資料整合和 ETL 工具
- 進階分析
- 服務
- 諮詢
- 培訓與支援
- 託管服務
第6章:市場估計與預測:依部署模式,2021 - 2034 年
- 主要趨勢
- 本地
- 基於雲端
第7章:市場估計與預測:依組織規模,2021 - 2034 年
- 主要趨勢
- 大型企業
- 中小型企業(SME)
第 8 章:市場估計與預測:按應用,2021 - 2034 年
- 主要趨勢
- 銷售與行銷
- 金融
- 營運與供應鏈
- 人力資源
- 客戶服務
- 其他
第9章:市場估計與預測:依最終用途,2021 - 2034
- 主要趨勢
- 銀行、金融服務和保險(BFSI)
- 零售與電子商務
- 醫療保健和生命科學
- 製造業
- IT和電信
- 政府和公共部門
- 教育
- 能源和公用事業
- 其他(接待、交通等)
第 10 章:市場估計與預測:按地區,2021 年至 2034 年
- 主要趨勢
- 北美洲
- 美國
- 加拿大
- 歐洲
- 德國
- 英國
- 法國
- 義大利
- 西班牙
- 北歐人
- 俄羅斯
- 葡萄牙
- 克羅埃西亞
- 亞太地區
- 中國
- 印度
- 日本
- 澳洲
- 韓國
- 新加坡
- 泰國
- 印尼
- 菲律賓
- 拉丁美洲
- 巴西
- 墨西哥
- 阿根廷
- 多邊環境協定
- 南非
- 沙烏地阿拉伯
- 阿拉伯聯合大公國
第 11 章:公司簡介
- 全球參與者
- Adobe
- Amazon Web Services
- IBM
- Microsoft
- Oracle
- Qlik Technologies
- SAP
- SAS
- Tableau Software (Salesforce)
- 區域參與者
- Alteryx
- Databricks
- Dataiku
- Domo
- Looker
- Palantir
- Sisense
- Snowflake
- ThoughtSpot
- TIBCO Software
- 新興玩家
- Chartio
- Grafana Labs
- Hex Technologies
- Klipfolio
- Metabase
- Mode Analytics
- Observable
- Periscope Data
- Retool
- Zoho
The Global Self-Service Analytics Market was valued at USD 6.2 billion in 2024 and is estimated to grow at a CAGR of 16.2% to reach USD 23 billion by 2034.
The rapid growth is fueled by the rising demand for faster, independent data access and analysis across enterprises. Self-service analytics empowers employees to explore, visualize, and interpret data on their own, eliminating the traditional reliance on IT departments and enabling real-time, data-driven decisions. As businesses shift toward agile operations, the demand for tools that support rapid insights and competitive adaptability continues to rise. The widespread push toward data democratization and cross-functional data access is transforming analytics into a core component of strategic planning. Additionally, enterprises are recognizing self-service analytics as a crucial enabler for scaling decision-making while improving operational efficiency.
| Market Scope | |
|---|---|
| Start Year | 2024 |
| Forecast Year | 2025-2034 |
| Start Value | $6.2 Billion |
| Forecast Value | $23 Billion |
| CAGR | 16.2% |
With ongoing advancements in automation, IoT integration, and sustainable cloud technologies, more companies are incorporating intelligent self-service analytics platforms. These systems reduce the burden on IT, lower operational expenses, and enable predictive and real-time analysis across departments. As energy-efficient cloud computing becomes more prevalent, the market sees increased adoption across industries prioritizing compliance, performance, and long-term digital transformation. The push for sustainability and improved governance has also placed self-service analytics at the forefront of responsible innovation in enterprise data strategy.
In 2024, the software segment held a 62% share, with expectations to grow at a CAGR of 16.7% through 2034. Software dominance is attributed to the growing adoption of artificial intelligence tools, advanced visualizations, and natural language interfaces that accelerate business decision-making and forecasting. These platforms are used in regions such as North America, Asia-Pacific, and Europe, where regulations, data accessibility, and scalable architecture requirements are increasing. Companies prefer these software solutions due to their ease of deployment, cloud compatibility, and ability to integrate into hybrid IT ecosystems.
The cloud-based deployments segment held a 70% share in 2024 and is estimated to grow at a 17% CAGR between 2025 and 2034. The popularity of cloud-based self-service analytics stems from its scalability, affordability, and remote accessibility, making it ideal for dynamic work environments and real-time operations. Businesses are embracing cloud deployment models for flexibility, reduced hardware dependencies, and cost management. The widespread adoption of subscription models, paired with support for multi-cloud operations, is especially appealing to mid-sized and smaller organizations looking to remain agile and competitive.
North America Self-Service Analytics Market held 49% share in 2024, attributed to widespread enterprise digitization, robust cloud infrastructure, and a strong emphasis on empowering teams through data autonomy. Organizations in the U.S. and Canada are increasingly moving toward decentralized analytics approaches to streamline decisions and reduce IT bottlenecks. The widespread use of advanced analytics solutions has positioned North America as a hub for innovation and rapid adoption in the self-service analytics space.
Key players operating in the Self-Service Analytics Market include Amazon Web Services, Qlik Technologies, SAS, SAP, Microsoft, IBM, Tableau Software (Salesforce), TIBCO Software, Oracle, and Sisense. To enhance their presence, leading companies in the self-service analytics sector are adopting several strategic initiatives. Many are focusing on expanding their product capabilities with AI-powered features, automated data prep, and natural language querying to simplify the user experience. Integration with cloud ecosystems and support for hybrid infrastructures allow firms to cater to varied enterprise needs. Partnerships with other tech providers and cloud platforms help in broadening reach and enhancing compatibility.
Table of Contents
Chapter 1 Methodology
- 1.1 Market scope and definition
- 1.2 Research design
- 1.2.1 Research approach
- 1.2.2 Data collection methods
- 1.3 Data mining sources
- 1.3.1 Global
- 1.3.2 Regional/Country
- 1.4 Base estimates and calculations
- 1.4.1 Base year calculation
- 1.4.2 Key trends for market estimation
- 1.5 Primary research and validation
- 1.5.1 Primary sources
- 1.6 Forecast model
- 1.7 Research assumptions and limitations
Chapter 2 Executive Summary
- 2.1 Industry 3600 synopsis, 2021 - 2034
- 2.2 Key market trends
- 2.2.1 Regional
- 2.2.2 Components
- 2.2.3 Deployment Mode
- 2.2.4 Enterprise Size
- 2.2.5 Application
- 2.2.6 End Use
- 2.3 TAM Analysis, 2025-2034
- 2.4 CXO perspectives: Strategic imperatives
- 2.4.1 Executive decision points
- 2.4.2 Critical success factors
- 2.5 Future outlook and strategic recommendations
Chapter 3 Industry Insights
- 3.1 Industry ecosystem analysis
- 3.1.1 Supplier landscape
- 3.1.2 Profit margin analysis
- 3.1.3 Cost structure
- 3.1.4 Value addition at each stage
- 3.1.5 Factor affecting the value chain
- 3.1.6 Disruptions
- 3.2 Industry impact forces
- 3.2.1 Growth drivers
- 3.2.1.1 Rising demand for data-driven decision-making
- 3.2.1.2 Expansion of cloud-based analytics platforms
- 3.2.1.3 Integration of AI and natural language processing (NLP)
- 3.2.1.4 Growing digital transformation across industries
- 3.2.1.5 Increasing need for reduced IT dependency
- 3.2.2 Industry pitfalls and challenges
- 3.2.2.1 Data quality and governance issues
- 3.2.2.2 Integration complexity with legacy systems
- 3.2.3 Market opportunities
- 3.2.3.1 AI & machine learning integration
- 3.2.3.2 Small & medium business adoption
- 3.2.3.3 Industry-specific solution development
- 3.2.3.4 Embedded analytics expansion
- 3.2.3.5 Emerging market penetration
- 3.2.3.6 Edge & IoT analytics applications
- 3.2.1 Growth drivers
- 3.3 Growth potential analysis
- 3.4 Regulatory landscape
- 3.4.1 GDPR data protection compliance
- 3.4.2 CCPA privacy regulation impact
- 3.4.3 NIST cybersecurity framework
- 3.4.4 Industry-specific data regulations
- 3.4.5 International data transfer requirements
- 3.4.6 AI governance & ethics guidelines
- 3.4.7 Audit & compliance reporting standards
- 3.5 Porter’s analysis
- 3.6 PESTEL analysis
- 3.7 Technology and innovation landscape
- 3.7.1 Current technological trends
- 3.7.1.1 Artificial intelligence & machine learning integration
- 3.7.1.2 Natural language processing advances
- 3.7.1.3 Automated data preparation evolution
- 3.7.1.4 Real-time & streaming analytics
- 3.7.1.5 Cloud-native architecture innovation
- 3.7.2 Emerging technologies
- 3.7.2.1 Mobile analytics technology
- 3.7.2.2 Embedded analytics capabilities
- 3.7.2.3 Data visualization innovation
- 3.7.2.4 API & integration technology
- 3.7.3 Future technology scenarios
- 3.7.3.1 Fully automated analytics
- 3.7.3.2 Conversational AI analytics
- 3.7.3.3 Augmented reality data visualization
- 3.7.3.4 Quantum computing analytics
- 3.7.3.5 Scenario planning framework
- 3.7.1 Current technological trends
- 3.8 Price trends analysis
- 3.8.1 Historical pricing evolution by solution type
- 3.8.2 Regional price variations
- 3.8.3 Subscription vs perpetual license pricing
- 3.8.4 User-based vs capacity-based pricing
- 3.8.5 Feature tier pricing strategies
- 3.8.6 Total cost of ownership analysis
- 3.9 Cost breakdown analysis
- 3.9.1 Software licensing & subscription costs
- 3.9.2 Implementation & integration expenses
- 3.9.3 Training & management costs
- 3.9.4 Data infrastructure & storage costs
- 3.9.5 Ongoing maintenance & support
- 3.9.6 Compliance & governance expenses
- 3.10 Patent analysis
- 3.11 Sustainability and environmental aspects
- 3.11.1 Sustainable practices
- 3.11.2 Waste reduction strategies
- 3.11.3 Energy efficiency in production
- 3.11.4 Eco-friendly Initiatives
- 3.11.5 Carbon footprint considerations
- 3.12 Data governance & quality management
- 3.12.1 Data access control & security
- 3.12.2 Data quality assurance protocols
- 3.12.3 Master data management integration
- 3.12.4 Data lineage & traceability
- 3.12.5 Privacy protection mechanisms
- 3.12.6 Audit trail & compliance monitoring
- 3.12.7 Data stewardship programs
- 3.13 Investment landscape analysis
- 3.13.1 Venture capital investment in analytics
- 3.13.2 Corporate investment & acquisition activity
- 3.13.3 Government IT modernization funding
- 3.13.4 Academic research investment
- 3.13.5 Enterprise analytics budget allocation
- 3.13.6 ROI analysis by investment type
- 3.13.7 Technology development funding
- 3.14 Customer behavior analysis
- 3.14.1 Analytics tool selection criteria
- 3.14.2 User adoption & engagement patterns
- 3.14.3 Self-service vs IT-led analytics preferences
- 3.14.4 Training & support requirements
- 3.14.5 Success metrics & KPI tracking
- 3.14.6 Budget allocation decisions
- 3.14.7 Regional preference variations
- 3.15 Market entry barriers
- 3.15.1 Technology development complexity
- 3.15.2 Data integration & compatibility challenges
- 3.15.3 User experience design requirements
- 3.15.4 Regulatory compliance costs
- 3.15.5 Customer trust & brand recognition
- 3.15.6 Partnership & channel development
- 3.16 Risk assessment framework
- 3.16.1 Data security & privacy risks
- 3.16.2 Regulatory compliance risks
- 3.16.3 Technology obsolescence risks
- 3.16.4 Vendor lock-in & dependency risks
- 3.16.5 Data quality & governance risks
- 3.16.6 User adoption & change management risks
- 3.16.7 Integration & compatibility risks
- 3.17 Digital transformation integration
- 3.17.1 Enterprise analytics strategy alignment
- 3.17.2 Cloud migration impact
- 3.17.3 Data strategy & governance evolution
- 3.17.4 Agile analytics development
- 3.17.5 DevOps & DataOps integration
- 3.17.6 Organizational change management
- 3.18 User experience & design
- 3.18.1 Intuitive interface design principles
- 3.18.2 Drag-and-drop functionality
- 3.18.3 Visual analytics best practices
- 3.18.4 Mobile user experience optimization
- 3.18.5 Accessibility & inclusive design
- 3.18.6 User feedback & iteration cycles
Chapter 4 Competitive Landscape, 2024
- 4.1 Introduction
- 4.2 Company market share analysis
- 4.2.1 North America
- 4.2.2 Europe
- 4.2.3 Asia Pacific
- 4.2.4 LATAM
- 4.2.5 MEA
- 4.3 Competitive analysis of major market players
- 4.4 Competitive positioning matrix
- 4.5 Strategic outlook matrix
- 4.6 Key developments
- 4.6.1 Mergers & acquisitions
- 4.6.2 Partnerships & collaborations
- 4.6.3 New Product Launches
- 4.6.4 Expansion Plans and funding
Chapter 5 Market Estimates & Forecast, By Component, 2021 - 2034 (USD Mn)
- 5.1 Key trends
- 5.2 Software
- 5.2.1 Data discovery & visualization tools
- 5.2.2 Reporting tools
- 5.2.3 Data integration & ETL tools
- 5.2.4 Advanced analytics
- 5.3 Services
- 5.3.1 Consulting
- 5.3.2 Training & support
- 5.3.3 Managed services
Chapter 6 Market Estimates & Forecast, By Deployment Mode, 2021 - 2034 (USD Mn)
- 6.1 Key trends
- 6.2 On-premises
- 6.3 Cloud-based
Chapter 7 Market Estimates & Forecast, By Organization Size, 2021 - 2034 (USD Mn)
- 7.1 Key trends
- 7.2 Large enterprises
- 7.3 Small & medium enterprises (SMEs)
Chapter 8 Market Estimates & Forecast, By Application, 2021 - 2034 (USD Mn)
- 8.1 Key trends
- 8.2 Sales & marketing
- 8.3 Finance
- 8.4 Operations & supply chain
- 8.5 Human resources
- 8.6 Customer service
- 8.7 Others
Chapter 9 Market Estimates & Forecast, By End Use, 2021 - 2034 (USD Mn)
- 9.1 Key trends
- 9.2 Banking, financial services & insurance (BFSI)
- 9.3 Retail & e-commerce
- 9.4 Healthcare & life sciences
- 9.5 Manufacturing
- 9.6 It & telecom
- 9.7 Government & public sector
- 9.8 Education
- 9.9 Energy & utilities
- 9.10 Others (hospitality, transportation, etc.)
Chapter 10 Market Estimates & Forecast, By Region, 2021 - 2034 (USD Mn)
- 10.1 Key trends
- 10.2 North America
- 10.2.1 US
- 10.2.2 Canada
- 10.3 Europe
- 10.3.1 Germany
- 10.3.2 UK
- 10.3.3 France
- 10.3.4 Italy
- 10.3.5 Spain
- 10.3.6 Nordics
- 10.3.7 Russia
- 10.3.8 Portugal
- 10.3.9 Croatia
- 10.4 Asia Pacific
- 10.4.1 China
- 10.4.2 India
- 10.4.3 Japan
- 10.4.4 Australia
- 10.4.5 South Korea
- 10.4.6 Singapore
- 10.4.7 Thailand
- 10.4.8 Indonesia
- 10.4.9 Philippines
- 10.5 Latin America
- 10.5.1 Brazil
- 10.5.2 Mexico
- 10.5.3 Argentina
- 10.6 MEA
- 10.6.1 South Africa
- 10.6.2 Saudi Arabia
- 10.6.3 UAE
Chapter 11 Company Profiles
- 11.1 Global Players
- 11.1.1 Adobe
- 11.1.2 Amazon Web Services
- 11.1.3 Google
- 11.1.4 IBM
- 11.1.5 Microsoft
- 11.1.6 Oracle
- 11.1.7 Qlik Technologies
- 11.1.8 SAP
- 11.1.9 SAS
- 11.1.10 Tableau Software (Salesforce)
- 11.2 Regional Players
- 11.2.1 Alteryx
- 11.2.2 Databricks
- 11.2.3 Dataiku
- 11.2.4 Domo
- 11.2.5 Looker
- 11.2.6 Palantir
- 11.2.7 Sisense
- 11.2.8 Snowflake
- 11.2.9 ThoughtSpot
- 11.2.10 TIBCO Software
- 11.3 Emerging Players
- 11.3.1 Chartio
- 11.3.2 Grafana Labs
- 11.3.3 Hex Technologies
- 11.3.4 Klipfolio
- 11.3.5 Metabase
- 11.3.6 Mode Analytics
- 11.3.7 Observable
- 11.3.8 Periscope Data
- 11.3.9 Retool
- 11.3.10 Zoho
 客戶自助服務軟體市場:2026-2032年全球市場預測(依部署模式、通路類型、應用程式類型、組織規模及產業分類)
 2026年全球客戶自助服務軟體市場報告
 全球自助式分析市場:預測(至 2034 年)-按分析功能、使用者技能等級、部署方式、資料來源連接方式、最終使用者和地區分類的分析市場
 自助式分析市場 - 全球產業規模、佔有率、趨勢、機會及預測(按部署類型、應用、垂直產業、地區和競爭格局分類,2021-2031 年)
 自助服務分析市場規模、佔有率和趨勢分析報告:按組件、應用、部署、公司規模、最終用途、地區和細分市場預測,2025 年至 2033 年
 客戶自助服務軟體:市場佔有率分析、產業趨勢、統計數據和成長預測(2025-2030 年)客戶自助服務軟體市場規模、佔有率、趨勢分析報告:按解決方案、按服務、按部署、按最終用途、按地區、按細分市場、預測,2025-2030 年