

 |
市場調查報告書
商品編碼
1833425
矽基液晶 (LCoS) 市場機會、成長動力、產業趨勢分析及 2025 - 2034 年預測Liquid Crystal on Silicon (LCoS) Market Opportunity, Growth Drivers, Industry Trend Analysis, and Forecast 2025 - 2034 |
||||||
2024 年全球矽基液晶市場價值為 35 億美元,預計到 2034 年將以 15.2% 的複合年成長率成長至 143 億美元。
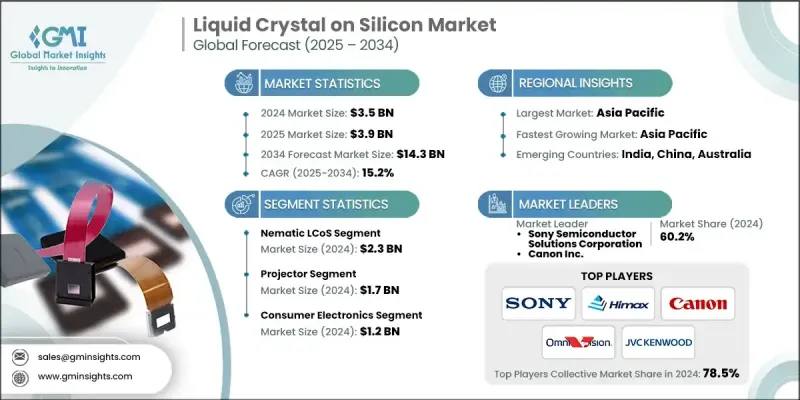
由於高效能顯示技術的快速發展以及AR/VR在各行各業的廣泛應用,市場需求正在加速成長。沉浸式應用的興起,加上對4K解析度和緊湊型節能顯示器的投資不斷增加,正在推動LCoS的廣泛應用。抬頭顯示器在汽車和航太領域的不斷擴展,進一步支撐了市場對可靠、高解析度、節省空間且易於整合的投影系統的需求。 LCoS顯示器以其卓越的影像清晰度和低功耗而聞名,在安全和態勢感知至關重要的軍事和民用應用中正變得越來越重要。此外,對個人化數位體驗的需求,尤其是在教育、娛樂和專業培訓領域,正在為各個終端應用領域開闢新的成長途徑。
| 市場範圍 | |
|---|---|
| 起始年份 | 2024 |
| 預測年份 | 2025-2034 |
| 起始值 | 35億美元 |
| 預測值 | 143億美元 |
| 複合年成長率 | 15.2% |
2025年至2034年間,頭戴式顯示器市場的複合年成長率為17.8%。這一成長得益於國防、模擬、培訓、醫療保健和遊戲等領域對空間計算和混合實境體驗日益成長的需求。為了保持競爭力,製造商正致力於提升顯示器性能、最大限度地降低延遲,並最佳化人體工學設計,以便在高精度環境中長期使用。
2024年,消費性電子市場規模達12億美元。隨著智慧型穿戴裝置、小型投影機和沈浸式頭戴裝置對高清視覺效果的需求不斷成長,該市場規模將持續擴張。 LCoS顯示器因其在清晰解析度、緊湊尺寸和高能效之間的平衡而備受青睞,成為消費性電子應用的首選。各企業正加大研發力度,致力於提升影像保真度、最佳化功耗,並將人工智慧驅動的顯示智慧融入下一代電子產品,以滿足使用者的期望。
2024年,美國矽基液晶 (LCoS) 市場規模達8.653億美元。強勁的研發活動、強大的智慧財產權框架以及醫療保健和沈浸式技術等技術驅動型產業的快速創新,共同支撐著美國市場的發展動能。力求在該市場保持競爭力的公司正在利用策略合作、提升產品差異化,並拓展精準成像和用戶體驗至關重要的各個領域的應用。
全球矽基液晶 (LCoS) 市場的主要活躍公司包括 VueReal、Santec Holdings Corporation、佳能公司、KOPIN Corporation Stora Enso、MicroVision, Inc、Lightelligence、OMNIVISION、索尼半導體解決方案公司、精工愛普生公司、JVCKENWOOD USA Corporation、HOLOEY、ADInict. Technologies、CamOptics Hinojosa Group、Himax Technologies 和 Hamamatsu Photonics KK。 LCoS 市場的領導者正在大力投資研發,以設計更小、更節能、更解析度的顯示模組。他們正在與汽車、國防、醫療保健和娛樂領域的公司建立長期戰略合作夥伴關係,以擴大其影響力。
目錄
第1章:方法論與範圍
第2章:執行摘要
第3章:行業洞察
- 產業生態系統分析
- 供應商概況
- 利潤率
- 成本結構
- 每個階段的增值
- 影響價值鏈的因素
- 中斷
- 產業衝擊力
- 成長動力
- 顯示技術的進步
- 擴增實境和虛擬實境(AR/VR)的需求不斷成長
- 教育和企業部門的成長
- 汽車和HUD(平視顯示器)的採用
- 擴大在投影和工業顯示領域的應用
- 產業陷阱與挑戰
- 複雜的製造程序
- 來自替代技術的競爭
- 市場機會
- 成長動力
- 成長潛力分析
- 監管格局
- 北美洲
- 歐洲
- 亞太地區
- 拉丁美洲
- 中東和非洲
- 波特的分析
- PESTEL分析
- 技術和創新格局
- 當前的技術趨勢
- 新興技術
- 價格趨勢
- 按地區
- 按產品
- 定價策略
- 新興商業模式
- 合規性要求
- 永續性措施
- 消費者情緒分析
- 專利和智慧財產權分析
- 地緣政治與貿易動態
第4章:競爭格局
- 介紹
- 公司市佔率分析
- 按地區
- 北美洲
- 歐洲
- 亞太地區
- 拉丁美洲
- 中東和非洲
- 市場集中度分析
- 按地區
- 關鍵參與者的競爭基準
- 財務績效比較
- 收入
- 利潤率
- 研發
- 產品組合比較
- 產品範圍廣度
- 科技
- 創新
- 地理位置比較
- 全球足跡分析
- 服務網路覆蓋
- 各地區市場滲透率
- 競爭定位矩陣
- 領導者
- 挑戰者
- 追蹤者
- 利基市場參與者
- 戰略展望矩陣
- 財務績效比較
- 2021-2024 年關鍵發展
- 併購
- 夥伴關係與合作
- 技術進步
- 擴張和投資策略
- 永續發展舉措
- 數位轉型舉措
- 新興/新創企業競爭對手格局
第5章:市場估計與預測:按技術分類,2021 - 2034 年
- 主要趨勢
- 鐵電LCoS
- 向列液晶
- 純相位LCoS
第6章:市場估計與預測:按應用類型,2021 - 2034
- 主要趨勢
- 投影儀
- 抬頭顯示器
- 頭戴式顯示器
- 其他
第7章:市場估計與預測:按最終用途產業,2021 - 2034 年
- 主要趨勢
- 消費性電子產品
- 汽車
- 衛生保健
- 國防和航太
- 工業的
- 電信
- 其他
第8章:市場估計與預測:按地區,2021 - 2034 年
- 主要趨勢
- 北美洲
- 美國
- 加拿大
- 歐洲
- 德國
- 英國
- 法國
- 西班牙
- 義大利
- 荷蘭
- 亞太地區
- 中國
- 印度
- 日本
- 澳洲
- 韓國
- 拉丁美洲
- 巴西
- 墨西哥
- 阿根廷
- 中東和非洲
- 沙烏地阿拉伯
- 南非
- 阿拉伯聯合大公國
第9章:公司簡介
- 全球關鍵參與者
- Sony Semiconductor Solutions Corporation
- Canon Inc.
- Hitachi
- Barco
- 3M Company
- 區域關鍵參與者
- 北美洲
- Himax Technologies, Inc.
- JVCKENWOOD USA Corporation
- Santec Holdings Corporation
- AAXA Technologies
- Tower Semiconductor
- 歐洲
- HOLOEYE Photonics AG
- CamOptics
- Citizen Finetech Miyota
- 亞太地區
- Hamamatsu Photonics KK
- KOPIN Corporation
- siliconmicrodisplay
- 北美洲
- 利基市場參與者/顛覆者
- OMNIVISION
- SYNDIANT
The Global Liquid Crystal on Silicon Market was valued at USD 3.5 billion in 2024 and is estimated to grow at a CAGR of 15.2% to reach USD 14.3 billion by 2034.
Demand is accelerating due to rapid developments in high-performance display technologies and the growing usage of AR/VR across industries. The rise of immersive applications, paired with increasing investment in 4K resolution and compact, energy-efficient displays, is driving broader LCoS adoption. The expanding deployment of head-up displays in automotive and aerospace sectors is further supporting demand due to the need for reliable, high-resolution projection systems that are space-efficient and easily integrable. LCoS displays, known for their superior image clarity and low power consumption, are becoming increasingly vital in military and civil applications where safety and situational awareness are critical. Moreover, the demand for personalized digital experiences, especially in education, entertainment, and professional training, is creating new avenues for growth across various end-use sectors.
| Market Scope | |
|---|---|
| Start Year | 2024 |
| Forecast Year | 2025-2034 |
| Start Value | $3.5 Billion |
| Forecast Value | $14.3 Billion |
| CAGR | 15.2% |
The head-mounted display segment held a CAGR of 17.8% between 2025 and 2034. This growth is underpinned by the increasing global appetite for spatial computing and mixed-reality experiences in sectors such as defense, simulation, training, healthcare, and gaming. To remain competitive, manufacturers are focusing on improving display performance, minimizing latency, and refining ergonomics for extended use in high-precision environments.
The consumer electronics segment was valued at USD 1.2 billion in 2024. The segment continues to expand as demand rises for high-definition visuals in smart wearables, compact projectors, and immersive headsets. LCoS displays are favored for their balance of sharp resolution, compact size, and power efficiency, making them a preferred option for consumer applications. Businesses are directing R&D efforts toward enhancing image fidelity, optimizing power usage, and embedding AI-driven display intelligence into next-generation electronics to meet user expectations.
U.S. Liquid Crystal on Silicon (LCoS) Market generated USD 865.3 million in 2024. Market momentum in the U.S. is supported by robust R&D activity, strong IP frameworks, and rapid innovation across tech-driven industries, including healthcare and immersive tech. Companies aiming to stay competitive in this market are leveraging strategic collaborations, advancing product differentiation, and expanding applications across sectors where precision imaging and user experience are key.
Key companies active in the Global Liquid Crystal on Silicon (LCoS) Market include VueReal, Santec Holdings Corporation, Canon Inc., KOPIN Corporation Stora Enso, MicroVision, Inc, Lightelligence, OMNIVISION, Sony Semiconductor Solutions Corporation, Seiko Epson Corporation, JVCKENWOOD USA Corporation, HOLOEYE Photonics AG, SYNDIANT, Tower Semiconductor, 3M Company, AAXA Technologies, CamOptics Hinojosa Group, Himax Technologies, and Hamamatsu Photonics K.K. Leading players in the LCoS market are investing heavily in research and development to engineer smaller, more energy-efficient, and ultra-high-resolution display modules. They're forming long-term strategic partnerships with companies in automotive, defense, healthcare, and entertainment sectors to expand their reach.
Table of Contents
Chapter 1 Methodology and Scope
- 1.1 Market scope and definition
- 1.2 Research design
- 1.2.1 Research approach
- 1.2.2 Data collection methods
- 1.3 Data mining sources
- 1.3.1 Global
- 1.3.2 Regional/Country
- 1.4 Base estimates and calculations
- 1.4.1 Base year calculation
- 1.4.2 Key trends for market estimation
- 1.5 Primary research and validation
- 1.5.1 Primary sources
- 1.6 Forecast model
- 1.7 Research assumptions and limitations
Chapter 2 Executive Summary
- 2.1 Industry snapshot
- 2.2 Key market trends
- 2.2.1 Technology trends
- 2.2.2 Application trends
- 2.2.3 End use industry trends
- 2.2.4 Regional trends
- 2.3 TAM Analysis, 2025-2034 (USD Billion)
- 2.4 CXO perspectives: Strategic imperatives
- 2.4.1 Executive decision points
- 2.4.2 critical success factors
- 2.5 Future outlook and strategic recommendations
Chapter 3 Industry Insights
- 3.1 Industry ecosystem analysis
- 3.1.1 Supplier Landscape
- 3.1.2 Profit Margin
- 3.1.3 Cost structure
- 3.1.4 Value addition at each stage
- 3.1.5 Factor affecting the value chain
- 3.1.6 Disruptions
- 3.2 Industry impact forces
- 3.2.1 Growth drivers
- 3.2.1.1 Advancements in display technologies
- 3.2.1.2 Increasing demand for augmented and virtual reality (AR/VR)
- 3.2.1.3 Growth in education and corporate sectors
- 3.2.1.4 Automotive and HUD (Head-Up Display) adoption
- 3.2.1.5 Expanded use in projection and industrial displays
- 3.2.2 Industry pitfalls and challenges
- 3.2.2.1 Complex manufacturing process
- 3.2.2.2 Competition from alternative technologies
- 3.2.3. Market opportunities
- 3.2.1 Growth drivers
- 3.3 Growth potential analysis
- 3.4 Regulatory landscape
- 3.4.1 North America
- 3.4.2 Europe
- 3.4.3 Asia Pacific
- 3.4.4 Latin America
- 3.4.5 Middle East & Africa
- 3.5 Porter’s analysis
- 3.6 PESTEL analysis
- 3.7 Technology and innovation landscape
- 3.7.1 Current technological trends
- 3.7.2 Emerging technologies
- 3.8 Price trends
- 3.8.1 By region
- 3.8.2 By product
- 3.9 Pricing strategies
- 3.10 Emerging business models
- 3.11 Compliance requirements
- 3.12 Sustainability measures
- 3.13 Consumer sentiment analysis
- 3.14 Patent and IP analysis
- 3.15 Geopolitical and trade dynamics
Chapter 4 Competitive Landscape, 2024
- 4.1 Introduction
- 4.2 Company market share analysis
- 4.2.1 By region
- 4.2.1.1 North America
- 4.2.1.2 Europe
- 4.2.1.3 Asia Pacific
- 4.2.1.4 Latin America
- 4.2.1.5 Middle East & Africa
- 4.2.2 Market Concentration Analysis
- 4.2.1 By region
- 4.3 Competitive benchmarking of key players
- 4.3.1 Financial performance comparison
- 4.3.1.1 Revenue
- 4.3.1.2 Profit margin
- 4.3.1.3 R&D
- 4.3.2 Product portfolio comparison
- 4.3.2.1 Product range breadth
- 4.3.2.2 Technology
- 4.3.2.3 Innovation
- 4.3.3 Geographic presence comparison
- 4.3.3.1 Global footprint analysis
- 4.3.3.2 Service network coverage
- 4.3.3.3 Market penetration by region
- 4.3.4 Competitive positioning matrix
- 4.3.4.1 Leaders
- 4.3.4.2 Challengers
- 4.3.4.3 Followers
- 4.3.4.4 Niche players
- 4.3.5 Strategic outlook matrix
- 4.3.1 Financial performance comparison
- 4.4 Key developments, 2021-2024
- 4.4.1 Mergers and acquisitions
- 4.4.2 Partnerships and collaborations
- 4.4.3 Technological advancements
- 4.4.4 Expansion and investment strategies
- 4.4.5 Sustainability initiatives
- 4.4.6 Digital transformation initiatives
- 4.5 Emerging/ startup competitors landscape
Chapter 5 Market Estimates and Forecast, By Technology, 2021 - 2034 (USD Million & Units)
- 5.1 Key trends
- 5.2 ferroelectric LCoS
- 5.3 nematic LCoS
- 5.4 Phase-only LCoS
Chapter 6 Market Estimates and Forecast, By Application Type, 2021 - 2034 (USD Million & Units)
- 6.1 Key trends
- 6.2 Projectors
- 6.3 heads-up display
- 6.4 head mount display
- 6.5 Others
Chapter 7 Market Estimates and Forecast, By End Use Industry, 2021 - 2034 (USD Million & Units)
- 7.1 Key trends
- 7.2 Consumer electronics
- 7.3 Automotive
- 7.4 Healthcare
- 7.5 Defense & aerospace
- 7.6 Industrial
- 7.7 Telecom
- 7.8 Others
Chapter 8 Market Estimates and Forecast, By Region, 2021 - 2034 (USD Million & Units)
- 8.1 Key trends
- 8.2 North America
- 8.2.1 U.S.
- 8.2.2 Canada
- 8.3 Europe
- 8.3.1 Germany
- 8.3.2 UK
- 8.3.3 France
- 8.3.4 Spain
- 8.3.5 Italy
- 8.3.6 Netherlands
- 8.4 Asia Pacific
- 8.4.1 China
- 8.4.2 India
- 8.4.3 Japan
- 8.4.4 Australia
- 8.4.5 South Korea
- 8.5 Latin America
- 8.5.1 Brazil
- 8.5.2 Mexico
- 8.5.3 Argentina
- 8.6 Middle East and Africa
- 8.6.1 Saudi Arabia
- 8.6.2 South Africa
- 8.6.3 UAE
Chapter 9 Company Profiles
- 9.1 Global Key Players
- 9.1.1 Sony Semiconductor Solutions Corporation
- 9.1.2 Canon Inc.
- 9.1.3 Hitachi
- 9.1.4 Barco
- 9.1.5 3M Company
- 9.2 Regional Key Players
- 9.2.1 North America
- 9.2.1.1 Himax Technologies, Inc.
- 9.2.1.2 JVCKENWOOD USA Corporation
- 9.2.1.3 Santec Holdings Corporation
- 9.2.1.4 AAXA Technologies
- 9.2.1.5 Tower Semiconductor
- 9.2.2 Europe
- 9.2.2.1 HOLOEYE Photonics AG
- 9.2.2.2 CamOptics
- 9.2.2.3 Citizen Finetech Miyota
- 9.2.3 Asia Pacific
- 9.2.3.1 Hamamatsu Photonics K.K.
- 9.2.3.2 KOPIN Corporation
- 9.2.3.3 siliconmicrodisplay
- 9.2.1 North America
- 9.3 Niche Players / Disruptors
- 9.3.1 OMNIVISION
- 9.3.2 SYNDIANT
 矽基液晶(LCOS)市場:按應用、面板解析度、光源和終端用戶產業分類的全球市場預測,2026-2032年
 MEMS微顯示器市場分析及預測(至2035年):依類型、產品、技術、應用、組件、材料類型、裝置、最終用戶及功能分類
 2026年全球矽基基板抬頭顯示器(HUD)市場報告
 矽基液晶顯示器市場-全球產業規模、佔有率、趨勢、機會、預測:按產品、技術、應用、地區和競爭格局分類,2021-2031年LCD顯示器目標市場按技術、面板尺寸、解析度、應用和最終用戶分類-2026年至2032年全球預測
 全球液態矽膠市場
 2032 年矽基液晶市場預測:按產品類型、技術、應用、最終用戶和地區進行的全球分析
 LCoS 顯示器 -市場佔有率分析、產業趨勢/統計、成長預測 (2025-2030)