


 |
市場調查報告書
商品編碼
1801821
飯店收入管理與定價分析市場機會、成長動力、產業趨勢分析及 2025 - 2034 年預測Hospitality Revenue Management and Pricing Analytics Market Opportunity, Growth Drivers, Industry Trend Analysis, and Forecast 2025 - 2034 |
||||||
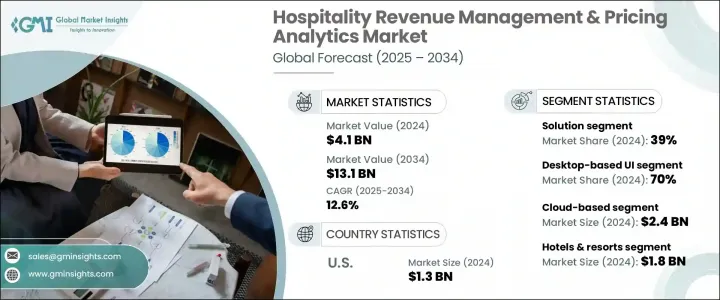
2024年,全球飯店收益管理與定價分析市場規模達41億美元,預計年複合成長率將達12.6%,2034年將達到131億美元。對敏捷、數據驅動的定價模型的需求日益成長,正在重塑酒店業的運作方式。由於競爭加劇和賓客偏好的轉變,標準定價方法正迅速過時。取而代之的是,該行業正轉向由機器學習、人工智慧和雲端收益管理平台支援的動態定價。
這些技術使飯店能夠更好地預測需求、評估競爭性定價並做出更明智的定價決策,不僅提高入住率,還能提高每間可用客房收入 (RevPAR)。飯店利用整合的 RMS 解決方案和行動互動工具進行賓客服務和忠誠度追蹤,同時最佳化能源利用並提升賓客體驗。這種數位轉型透過連結預訂系統、在地服務和個人化賓客溝通,既能為賓客帶來便利,又能促進收入成長。
| 市場範圍 | |
|---|---|
| 起始年份 | 2024 |
| 預測年份 | 2025-2034 |
| 起始值 | 41億美元 |
| 預測值 | 131億美元 |
| 複合年成長率 | 12.6% |
2024年,基於雲端的細分市場創造了24億美元的市場佔有率。這些系統提供即時分析和自動化策略調整,為不同地區的營運商提供實際的洞察。其靈活性尤其有利於大型酒店集團和多品牌營運。與通路管理器、中央預訂系統 (CRS) 和物業管理系統 (PMS) 等其他核心系統的整合,創建了一個統一的技術生態系統,實現了無縫的資料共享和價格控制。這些平台還能增強直接預訂和第三方預訂管道的價格管理,進而提高利潤率和營運敏捷性。
2024年,飯店及度假村板塊的收入達到18億美元。該行業競爭激烈,客流量巨大,需要精準的定價策略來最大化客房入住率和總收入。飯店管理著各種各樣的收入來源——從住宿到餐飲服務、健康中心和活動場地——因此,所有營運領域都需要同步定價和先進的需求預測。由於重視每間客房的收入和每個部門的獲利能力,高級分析技術的應用至關重要。
2024年,美國飯店收入管理和定價分析市場在創新和尖端技術的推動下創造了可觀的收入。美國各地領先的酒店品牌已在預測分析、人工智慧驅動的決策工具和即時定價模型方面投入大量資金。這些系統會評估入住率模式、顧客預訂行為、市場動態和競爭價格,進而產生動態定價模型。美國酒店已創建以分析為先的文化,以支持更明智的業務決策並提升營運績效。
推動飯店收益管理和定價分析市場創新的關鍵參與者包括 SAP SE、Lybra、華為、甲骨文、Atomize RMS、FLYR Hospitality 和 BEONx。這些公司憑藉著先進的技術和智慧定價工具,在市場格局的演變中發揮了重要作用。為了在飯店收益管理和定價分析市場中佔據更強大的地位,各大公司已採取了各種策略舉措。其中,主要重點是開發基於人工智慧的平台,以實現即時決策和動態定價最佳化。許多公司正在增強其基於雲端的 RMS 產品,以確保可擴展性、更快的更新速度以及與現有酒店系統(如 PMS 和 CRS)的整合。
目錄
第1章:方法論與範圍
第2章:執行摘要
第3章:行業洞察
- 產業生態系統分析
- 供應商格局
- 技術供應商和開發商
- 系統整合商和顧問
- 數據提供者和市場情報
- 旅館經營者和收益經理
- 分銷合作夥伴和通路
- 成本結構
- 利潤率
- 每個階段的增值
- 影響供應鏈的因素
- 破壞者
- 供應商格局
- 對部隊的影響
- 成長動力
- 飯店業的數位轉型
- 競爭壓力與利潤最佳化
- 客人對動態定價的期望
- 配銷通路複雜性管理
- 產業陷阱與挑戰
- 員工培訓與管理
- 實施和維護成本高
- 市場機會
- 新冠疫情後的恢復與適應
- 永續性和 ESG 整合
- 成長動力
- 成長潛力分析
- 波特的分析
- PESTEL分析
- 技術與創新格局
- 現有技術
- 新興技術
- 專利分析
- 監管格局
- 北美洲
- 歐洲
- 亞太地區
- 拉丁美洲
- 中東和非洲
- 實施方法
- 分階段推出策略
- 試點計畫框架
- 大爆炸實施方法
- 混合實施模型
- 風險緩解策略
- 變更管理框架
- 利害關係人的參與與支持
- 培訓和技能發展
- 流程再造與最佳化
- 績效衡量
- 持續改善流程
- 資料整合與遷移
- 歷史資料分析與清理
- 即時資料饋送整合
- 第三方資料來源整合
- 數據品質保證流程
- 備份和復原過程
- 成功因素和最佳實踐
- 高階主管支持和領導
- 跨職能團隊協作
- 供應商合作與支持
- 用戶採用和參與
- 效能監控和最佳化
- 實施挑戰和解決方案
- 技術整合的複雜性
- 數據孤島和不一致
- 員工抵觸情緒和訓練差距
- 預算限制和投資報酬率壓力
- 時間軸和資源管理
- 永續性分析
- 永續實踐
- 減少廢棄物的策略
- 生產中的能源效率
- 環保舉措
- 碳足跡考量
第4章:競爭格局
- 介紹
- 公司市佔率分析
- 北美洲
- 歐洲
- 亞太地區
- 拉丁美洲
- 中東和非洲
- 競爭定位矩陣
- 戰略展望矩陣
- 關鍵進展
- 併購
- 夥伴關係與合作
- 新產品發布
- 擴張計劃和資金
第5章:市場估計與預測:按組件,2021 - 2034 年
- 主要趨勢
- 解決方案
- 收益管理系統(RMS)
- 預測和需求建模
- 計費和付款
- 商業智慧和報告
- 定價分析平台
- 通路管理
- 其他
- 服務
- 專業服務
- 諮詢與策略
- 部署與整合
- 支援與維護
- 託管服務
- 專業服務
- 解決方案
第6章:市場估計與預測:依平台,2021 - 2034 年
- 主要趨勢
- 基於桌面的使用者介面
- 行動/平板電腦 RMS 應用
第7章:市場估計與預測:依部署模型,2021 - 2034 年
- 主要趨勢
- 基於雲端
- 本地
- 混合
第8章:市場估計與預測:依所有權分類,2021 - 2034 年
- 主要趨勢
- 獨立的
- 連鎖店和特許經營店
- 租賃和管理
第9章:市場估計與預測:按應用,2021 - 2034 年
- 主要趨勢
- 客房收益管理
- 餐飲收入管理
- 水療和健康收入管理
- 活動和會議收入管理
- 輔助收入管理
- 全面收益管理
第10章:市場估計與預測:依最終用途,2021 - 2034 年
- 主要趨勢
- 飯店及度假村
- 餐廳及食品服務
- 郵輪公司和賭場
- 短期租賃
- 長期住宿飯店及公寓飯店
第 11 章:市場估計與預測:按地區,2021 年至 2034 年
- 北美洲
- 美國
- 加拿大
- 歐洲
- 英國
- 德國
- 法國
- 義大利
- 西班牙
- 比利時
- 荷蘭
- 瑞典
- 亞太地區
- 中國
- 印度
- 日本
- 澳洲
- 新加坡
- 韓國
- 越南
- 泰國
- 菲律賓
- 印尼
- 拉丁美洲
- 巴西
- 墨西哥
- 阿根廷
- MEA
- 南非
- 沙烏地阿拉伯
- 阿拉伯聯合大公國
第12章:公司簡介
- Aiosell
- Mews
- BEONx
- Cendyn
- Cloudbeds
- Duetto
- eZee Mint
- FLYR Hospitality
- Hotellistat
- Huawei
- IDeaS Revenue Solutions
- Infor
- Lighthouse Intelligence
- Lybra
- Oracle
- PriceLabs
- Revnomix Solutions
- RevPar Guru
- RoomPriceGenie
- SAP SE
The Global Hospitality Revenue Management & Pricing Analytics Market was valued at USD 4.1 billion in 2024 and is estimated to grow at a CAGR of 12.6% to reach USD 13.1 billion by 2034. The increasing need for agile, data-driven pricing models is reshaping how hospitality businesses operate. Standard pricing methods are quickly becoming outdated due to rising competition and shifting guest preferences. Instead, the industry is gravitating toward dynamic pricing supported by machine learning, artificial intelligence, and cloud-powered revenue management platforms.
These technologies enable hotels to better forecast demand, evaluate competitive pricing, and make smarter pricing decisions that not only improve occupancy but also drive higher revenue per available room (RevPAR). Properties leveraging integrated RMS solutions with mobile engagement tools for guest services and loyalty tracking are also optimizing energy use and enhancing guest experiences. This digital shift supports both guest convenience and revenue growth by connecting reservation systems, local services, and personalized guest communication.
| Market Scope | |
|---|---|
| Start Year | 2024 |
| Forecast Year | 2025-2034 |
| Start Value | $4.1 Billion |
| Forecast Value | $13.1 Billion |
| CAGR | 12.6% |
The cloud-based segment generated USD 2.4 billion share in 2024. These systems offer real-time analytics and automated strategy adjustments, giving operators across various locations actionable insights. Their flexibility is particularly beneficial for larger hotel groups and multi-brand operations. Integration with other core systems like channel managers, central reservation systems (CRS), and property management systems (PMS) creates a unified technology ecosystem, allowing for seamless data sharing and pricing control. These platforms also enhance rate management across direct and third-party booking channels, improving both profit margins and operational agility.
The hotels and resorts segment generated USD 1.8 billion in 2024. This sector faces aggressive competition and operates at high volume, requiring precision in pricing strategies to maximize room occupancy and overall revenue. Hotels manage a diverse set of revenue streams-from accommodations to food services, wellness centers, and event spaces-which necessitate synchronized pricing and advanced demand prediction across all operational areas. The emphasis on revenue per room and profitability per department makes the use of advanced analytics indispensable.
United States Hospitality Revenue Management & Pricing Analytics Market generated significant revenues in 2024 driven by innovation and adopting cutting-edge technologies. Leading hotel brands across the US have heavily invested in predictive analytics, AI-driven decision-making tools, and real-time pricing models. These systems assess occupancy patterns, customer booking behaviors, market dynamics, and competitive rates to generate dynamic pricing models. US-based hotels have created an analytics-first culture that supports smarter business decisions and enhances operational performance.
Key players driving innovation in Hospitality Revenue Management & Pricing Analytics Market include SAP SE, Lybra, Huawei, Oracle, Atomize RMS, FLYR Hospitality, and BEONx. These companies are instrumental in evolving the market landscape with advanced technologies and intelligent pricing tools. To establish a stronger presence in the hospitality revenue management and pricing analytics market, major companies have embraced a variety of strategic initiatives. A primary focus is on developing AI-powered platforms that enable real-time decision-making and dynamic pricing optimization. Many firms are enhancing their cloud-based RMS offerings to ensure scalability, faster updates, and integration with existing hotel systems such as PMS and CRS.
Table of Contents
Chapter 1 Methodology & Scope
- 1.1 Research design
- 1.1.1 Research approach
- 1.1.2 Data collection methods
- 1.2 Data mining sources
- 1.2.1 Global
- 1.2.2 Regional/Country
- 1.3 Base estimates & calculations
- 1.3.1 Base year calculation
- 1.3.2 Key trends for market estimation
- 1.4 Forecast model
- 1.5 Primary research and validation
- 1.5.1 Primary sources
- 1.6 Research assumptions and limitations
Chapter 2 Executive Summary
- 2.1 Industry 360° synopsis
- 2.2 Key market trends
- 2.2.1 Regional
- 2.2.2 Offering
- 2.2.3 Platform
- 2.2.4 Deployment model
- 2.2.5 Ownership
- 2.2.6 Application
- 2.2.7 End use
- 2.3 TAM Analysis, 2025-2034
- 2.4 CXO perspectives: Strategic imperatives
- 2.4.1 Key decision points for industry executives
- 2.4.2 Critical success factors for market players
- 2.5 Future outlook and strategic recommendations
Chapter 3 Industry Insights
- 3.1 Industry ecosystem analysis
- 3.1.1 Supplier landscape
- 3.1.1.1 Technology vendors and developers
- 3.1.1.2 System integrators and consultants
- 3.1.1.3 Data providers and market intelligence
- 3.1.1.4 Hotel operators and revenue managers
- 3.1.1.5 Distribution partners and channels
- 3.1.2 Cost structure
- 3.1.3 Profit margin
- 3.1.4 Value addition at each stage
- 3.1.5 Factors impacting the supply chain
- 3.1.6 Disruptors
- 3.1.1 Supplier landscape
- 3.2 Impact on forces
- 3.2.1 Growth drivers
- 3.2.1.1 Digital transformation in hospitality
- 3.2.1.2 Competitive pressure and profit optimization
- 3.2.1.3 Guest expectations for dynamic pricing
- 3.2.1.4 Distribution channel complexity management
- 3.2.2 Industry pitfalls & challenges
- 3.2.2.1 Staff training and management
- 3.2.2.2 High implementation and maintenance costs
- 3.2.3 Market opportunities
- 3.2.3.1 Post-COVID recovery and adaptation
- 3.2.3.2 Sustainability and ESG integration
- 3.2.1 Growth drivers
- 3.3 Growth potential analysis
- 3.4 Porter’s analysis
- 3.5 PESTEL analysis
- 3.6 Technology & innovation landscape
- 3.6.1 Current technologies
- 3.6.2 Emerging technologies
- 3.7 Patent analysis
- 3.8 Regulatory landscape
- 3.8.1 North America
- 3.8.2 Europe
- 3.8.3 Asia Pacific
- 3.8.4 Latin America
- 3.8.5 Middle East & Africa
- 3.9 Implementation methodologies
- 3.9.1 Phased rollout strategies
- 3.9.2 Pilot program frameworks
- 3.9.3 Big bang implementation approaches
- 3.9.4 Hybrid implementation models
- 3.9.5 Risk mitigation strategies
- 3.10 Change management framework
- 3.10.1 Stakeholder engagement and buy-in
- 3.10.2 Training and skill development
- 3.10.3 Process reengineering and optimization
- 3.10.4 Performance measurement
- 3.10.5 Continuous improvement processes
- 3.11 Data integration and migration
- 3.11.1 Historical data analysis and cleansing
- 3.11.2 Real-time data feed integration
- 3.11.3 Third-party data source integration
- 3.11.4 Data quality assurance processes
- 3.11.5 Backup and recovery procedures
- 3.12 Success factors and best practices
- 3.12.1 Executive sponsorship and leadership
- 3.12.2 Cross-functional team collaboration
- 3.12.3 Vendor partnership and support
- 3.12.4 User adoption and engagement
- 3.12.5 Performance monitoring and optimization
- 3.13 Implementation challenges and solutions
- 3.13.1 Technical integration complexities
- 3.13.2 Data silos and inconsistencies
- 3.13.3 Staff resistance and training gaps
- 3.13.4 Budget constraints and ROI pressure
- 3.13.5 Timeline and resource management
- 3.14 Sustainability analysis
- 3.14.1 Sustainable practices
- 3.14.2 Waste reduction strategies
- 3.14.3 Energy efficiency in production
- 3.14.4 Eco-friendly initiatives
- 3.14.5 Carbon footprint considerations
Chapter 4 Competitive Landscape, 2024
- 4.1 Introduction
- 4.2 Company market share analysis
- 4.2.1 North America
- 4.2.2 Europe
- 4.2.3 Asia Pacific
- 4.2.4 Latin America
- 4.2.5 Middle East & Africa
- 4.3 Competitive positioning matrix
- 4.4 Strategic outlook matrix
- 4.5 Key developments
- 4.5.1 Mergers & acquisitions
- 4.5.2 Partnerships & collaborations
- 4.5.3 New Product Launches
- 4.6 Expansion Plans and funding
Chapter 5 Market Estimates & Forecast, By Component, 2021 - 2034 ($Bn)
- 5.1 Key trends
- 5.1.1 Solution
- 5.1.1.1 Revenue Management System (RMS)
- 5.1.1.2 Forecasting & demand modeling
- 5.1.1.3 Billing and payment
- 5.1.1.4 Business intelligence and reporting
- 5.1.1.5 Pricing analytics platforms
- 5.1.1.6 Channel management
- 5.1.1.7 Others
- 5.1.2 Services
- 5.1.2.1 Professional services
- 5.1.2.1.1 Consulting & strategy
- 5.1.2.1.2 Deployment & integration
- 5.1.2.1.3 Support & maintenance
- 5.1.2.2 Managed services
- 5.1.2.1 Professional services
- 5.1.1 Solution
Chapter 6 Market Estimates & Forecast, By Platform, 2021 - 2034 ($Bn)
- 6.1 Key trends
- 6.2 Desktop-based UI
- 6.3 Mobile/Tablet RMS Apps
Chapter 7 Market Estimates & Forecast, By Deployment Model, 2021 - 2034 ($Bn)
- 7.1 Key trends
- 7.2 Cloud-based
- 7.3 On-premises
- 7.4 Hybrid
Chapter 8 Market Estimates & Forecast, By Ownership, 2021 - 2034 ($Bn)
- 8.1 Key trends
- 8.2 Independent
- 8.3 Chain and franchises
- 8.4 Leased and managed
Chapter 9 Market Estimates & Forecast, By Application, 2021 - 2034 ($Bn)
- 9.1 Key trends
- 9.2 Room revenue management
- 9.3 Food and beverage revenue management
- 9.4 Spa and wellness revenue management
- 9.5 Event and meeting revenue management
- 9.6 Ancillary revenue management
- 9.7 Total revenue management
Chapter 10 Market Estimates & Forecast, By End Use, 2021 - 2034 ($Bn)
- 10.1 Key trends
- 10.2 Hotels & resorts
- 10.3 Restaurants & food services
- 10.4 Cruise lines & casinos
- 10.5 Short-term rentals
- 10.6 Extended stay and apartment hotels
Chapter 11 Market Estimates & Forecast, By Region, 2021 - 2034 ($Bn)
- 11.1 North America
- 11.1.1 U.S.
- 11.1.2 Canada
- 11.2 Europe
- 11.2.1 UK
- 11.2.2 Germany
- 11.2.3 France
- 11.2.4 Italy
- 11.2.5 Spain
- 11.2.6 Belgium
- 11.2.7 Netherlands
- 11.2.8 Sweden
- 11.3 Asia Pacific
- 11.3.1 China
- 11.3.2 India
- 11.3.3 Japan
- 11.3.4 Australia
- 11.3.5 Singapore
- 11.3.6 South Korea
- 11.3.7 Vietnam
- 11.3.8 Thailand
- 11.3.9 Philippines
- 11.3.10 Indonesia
- 11.4 Latin America
- 11.4.1 Brazil
- 11.4.2 Mexico
- 11.4.3 Argentina
- 11.5 MEA
- 11.5.1 South Africa
- 11.5.2 Saudi Arabia
- 11.5.3 UAE
Chapter 12 Company Profiles
- 12.1 Aiosell
- 12.2 Mews
- 12.3 BEONx
- 12.4 Cendyn
- 12.5 Cloudbeds
- 12.6 Duetto
- 12.7 eZee Mint
- 12.8 FLYR Hospitality
- 12.9 Hotellistat
- 12.10 Huawei
- 12.11 IDeaS Revenue Solutions
- 12.12 Infor
- 12.13 Lighthouse Intelligence
- 12.14 Lybra
- 12.15 Oracle
- 12.16 PriceLabs
- 12.17 Revnomix Solutions
- 12.18 RevPar Guru
- 12.19 RoomPriceGenie
- 12.20 SAP SE
 2026年全球計劃軟體市場報告
 航空機組管理軟體市場:按組件、系統類型、機組類型、應用、最終用戶和部署模式分類——2026-2032年全球預測通訊管理系統市場:按組件類型、產業和組織規模分類 - 2026-2032 年全球預測2026年全球排放管理軟體市場報告2026年全球數位飯店市場報告中央廚房管理軟體市場按產品類型、功能和最終用戶分類,全球預測(2026-2032)
 全球筆記管理軟體市場規模、佔有率、趨勢和成長分析報告(2026-2034)社會工作個案管理軟體全球市場報告(2026年)
 休閒管理軟體市場-全球產業規模、佔有率、趨勢、機會及預測(依設施類型、部署方式、最終用途、地區及競爭格局分類,2021-2031年)伺服器管理軟體市場 - 全球產業規模、佔有率、趨勢、機會、預測:按部署方式、組織規模、垂直市場、地區和競爭格局分類,2021-2031 年