


 |
市場調查報告書
商品編碼
1797714
食品纖維市場機會、成長動力、產業趨勢分析及2025-2034年預測Food Fibers Market Opportunity, Growth Drivers, Industry Trend Analysis, and Forecast 2025 - 2034 |
||||||
2024年,全球食品纖維市場規模達81億美元,預計2034年將以9.1%的複合年成長率成長,達到194億美元。食品纖維,俗稱膳食纖維,是一種不可消化的植物性碳水化合物,具有多種健康益處,尤其有利於消化健康、調節血糖和控制食慾。這些纖維天然存在於水果、豆類、蔬菜和穀物中,並擴大被添加到各種消費品中,例如乳製品替代品、強化飲料和烘焙產品。隨著全球消費者偏好轉向功能性和健康飲食,食品纖維市場持續成長。
植物性生活方式的興起、腸道菌叢健康意識的增強,以及鼓勵強化纖維標籤和配方的扶持性政策,進一步放大了這一趨勢。纖維提取和添加領域的創新技術(例如微膠囊化和高效擠壓)為更先進、更具吸引力的食品產品打開了大門。製造商正在策略性地順應這些發展趨勢,以滿足對天然、富含益生元、清潔標籤解決方案日益成長的需求。在消費者生活方式和營養意識不斷演變的推動下,功能性纖維在全球範圍內的快速普及,為該行業的強勁成長鋪平了道路。
| 市場範圍 | |
|---|---|
| 起始年份 | 2024 |
| 預測年份 | 2025-2034 |
| 起始值 | 81億美元 |
| 預測值 | 194億美元 |
| 複合年成長率 | 9.1% |
2024年,可溶性纖維佔56.5%的市場佔有率,貢獻了46億美元的市場價值。這類纖維包括菊粉、樹膠和果膠,因其能夠滋養有益微生物,從而促進腸道健康,被廣泛應用於食品和飲料中。它們也廣泛應用於植物奶和發酵飲料中,能夠提升口感和營養密度。在食品生產過程中,可溶性纖維也能改善產品的穩定性和口感,尤其是在低糖或無乳製品中。這些纖維兼具雙重功效,在食品業的各種配方中既充當功能性營養素,又可作為感官增強劑。它們在日常飲食中的日益普及,反映出消費者對消化和代謝健康的關注正在改變食品生產的配方策略。
烘焙和糖果業佔據40.2%的市場佔有率,到2024年將達到33億美元。由於膳食纖維在烘焙點心、全麥麵包和穀物等食品中的應用日益廣泛,該領域仍然是食品纖維的主要應用領域。烘焙食品中的膳食纖維可以改善口感,增加飽足感,並符合避免使用人工添加劑的清潔標籤運動。糖果製造商也加入功能性纖維,以降低糖分和卡路里含量,同時又不影響口感和口感。高纖維零食和全麥烘焙產品需求的激增持續推動創新,尤其是在亞太和北美等消費者對健康產品需求激增的地區。
2024年,亞太地區食品纖維市場佔有42.5%的佔有率。該地區的領先地位得益於消費者對消化健康的認知不斷提升、中產階級人口不斷壯大以及功能性食品和飲料類別的快速成長。日本、中國、韓國和印度等國家正經歷飲食習慣的轉變,轉向富含纖維、以植物為主的食物。健康政策和國家健康計劃的持續支持進一步推動了成長。隨著植物性和富含纖維的產品越來越受歡迎,尤其是在烘焙食品和營養保健品等類別中,線上商務和數位零售基礎設施在改善亞太地區不同人群的產品取得方面發揮著重要作用。
塑造全球食品纖維市場的關鍵公司包括阿徹丹尼爾斯米德蘭公司 (ADM)、嘉吉公司、羅蓋特公司、泰特萊爾公司和宜瑞安公司。為了保持競爭力並擴大市場佔有率,食品纖維領域的領先公司正著力於纖維提取和配方的創新。他們投入大量資金進行研發,以開發功能性強、易於整合且感官體驗更佳的新型共混物。企業也透過負責任地採購植物材料和提高加工效率來優先考慮永續性。與食品科技公司和專注於營養的新創公司的合作,可以進入新的市場和獲得新的技術。此外,各大品牌正在努力擴展其清潔標籤產品,以滿足不斷變化的消費者期望。
目錄
第1章:方法論與範圍
第2章:執行摘要
第3章:行業洞察
- 產業生態系統分析
- 供應商概況
- 利潤率
- 每個階段的增值
- 影響價值鏈的因素
- 中斷
- 產業衝擊力
- 成長動力
- 產業陷阱與挑戰
- 市場機會
- 成長潛力分析
- 監管格局
- 北美洲
- 歐洲
- 亞太地區
- 拉丁美洲
- 中東和非洲
- 波特的分析
- PESTEL分析
- 價格趨勢
- 按地區
- 依纖維類型
- 未來市場趨勢
- 技術和創新格局
- 當前的技術趨勢
- 新興技術
- 專利態勢
- 貿易統計(HS編碼)(註:僅提供重點國家的貿易統計資料)
- 主要進口國
- 主要出口國
- 永續性和環境方面
- 永續實踐
- 減少廢棄物的策略
- 生產中的能源效率
- 環保舉措
第4章:競爭格局
- 介紹
- 公司市佔率分析
- 按地區
- 北美洲
- 歐洲
- 亞太地區
- 拉丁美洲
- MEA
- 按地區
- 公司矩陣分析
- 主要市場參與者的競爭分析
- 競爭定位矩陣
- 關鍵進展
- 併購
- 夥伴關係與合作
- 新產品發布
- 擴張計劃
第5章:市場估計與預測:依纖維類型,2021 - 2034 年
- 主要趨勢
- 可溶性纖維
- 菊粉和低聚果糖部分
- 果膠和樹膠部門
- BETA-葡聚醣與特殊纖維
- 不溶性纖維
- 纖維素和改性纖維素
- 麥麩和穀物纖維
- 水果和蔬菜纖維
- 功能性益生元纖維
- 抗性澱粉技術
- 低聚半乳糖 (GOS) 和低聚果糖 (FOS)
- 新型和新興纖維
第6章:市場估計與預測:按應用,2021 - 2034 年
- 主要趨勢
- 烘焙和糖果
- 麵包和烘焙食品
- 早餐穀物和零食
- 糖果和甜點
- 飲料
- 功能性飲料和運動飲料
- 乳製品和植物替代品
- 果汁和強化水
- 乳製品和乳製品替代品
- 優格和發酵製品
- 乳酪及加工乳製品
- 植物性乳製品替代品
- 膳食補充劑
- 粉末和膠囊形式
- 益生元和腸道健康補充劑
- 體重管理和代謝健康
第7章:市場估計與預測:按最終用途產業,2021 - 2034 年
- 主要趨勢
- 食品和飲料製造
- 大型食品生產商
- 區域和特色食品公司
- 技術和設備供應商
- 膳食補充劑行業
- 補充劑製造商和品牌
- 合約製造商和自有品牌
- 分銷和零售通路
- 功能性食品及營養保健品
- 功能性食品開發
- 醫療食品和臨床營養
- 運動和運動營養
- 動物飼料和寵物食品
- 優質寵物食品應用
- 畜牧業及水產養殖業
- 市場開發與創新
第8章:市場估計與預測:按地區,2021 - 2034 年
- 主要趨勢
- 北美洲
- 美國
- 加拿大
- 歐洲
- 德國
- 英國
- 法國
- 西班牙
- 義大利
- 荷蘭
- 歐洲其他地區
- 亞太地區
- 中國
- 印度
- 日本
- 澳洲
- 韓國
- 亞太其他地區
- 拉丁美洲
- 巴西
- 墨西哥
- 阿根廷
- 拉丁美洲其他地區
- 中東和非洲
- 沙烏地阿拉伯
- 南非
- 阿拉伯聯合大公國
- 中東和非洲其他地區
第9章:公司簡介
- Cargill, Incorporated
- Tate & Lyle PLC
- Archer Daniels Midland Company
- Ingredion Incorporated
- Roquette Freres SA
- Kerry Group PLC
- International Flavors & Fragrances Inc
- J Rettenmaier & Sohne GmbH + Co KG
- Nexira Inc
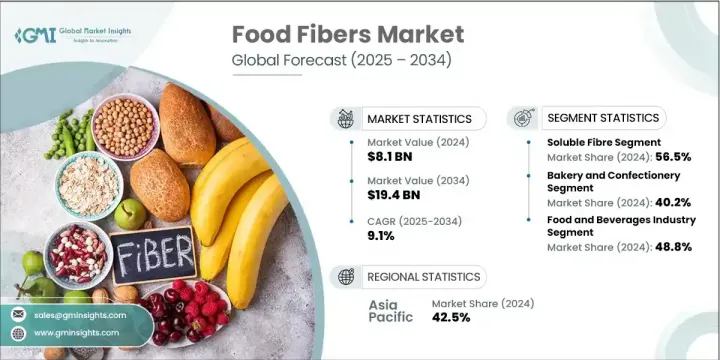
The Global Food Fibers Market was valued at USD 8.1 billion in 2024 and is estimated to grow at a CAGR of 9.1% to reach USD 19.4 billion by 2034. Food fibers, commonly known as dietary fibers, are indigestible plant-based carbohydrates that offer a variety of health benefits, particularly in digestive wellness, blood sugar regulation, and appetite control. These fibers are naturally present in fruits, legumes, vegetables, and grains, and are increasingly included in a wide range of consumables like dairy alternatives, fortified drinks, and bakery products. As global consumer preferences shift toward functional and health-forward eating, the market continues to gain momentum.
The trend is further amplified by the push for plant-based living, growing awareness of gut microbiome health, and supportive policies encouraging fiber-enhanced labeling and formulation. New innovations in fiber extraction and incorporation-such as microencapsulation and high-efficiency extrusion-are opening the door for more advanced and appealing food products. Manufacturers are strategically aligning with these developments to meet the growing demand for natural, prebiotic-rich, clean-label solutions. The rapid adoption of functional fibers globally, backed by evolving consumer lifestyles and nutritional awareness, is paving the way for robust growth in this industry.
| Market Scope | |
|---|---|
| Start Year | 2024 |
| Forecast Year | 2025-2034 |
| Start Value | $8.1 Billion |
| Forecast Value | $19.4 Billion |
| CAGR | 9.1% |
The soluble fibers held a 56.5% share in 2024, contributing USD 4.6 billion. These types of fibers, which include inulin, gums, and pectins, are widely used in foods and beverages because of their ability to support gut health by feeding beneficial microbes. Their use extends to plant-based milks and fermented beverages, where they enhance both texture and nutritional density. In the food manufacturing process, soluble fibers also improve product stability and mouthfeel, especially in reduced-sugar or dairy-free options. These fibers serve dual purposes, acting as both functional nutrients and sensory enhancers in various formulations across the food sector. Their rising inclusion in daily diets reflects how consumer interest in digestive and metabolic health is transforming formulation strategies within food production.
The bakery and confectionery segment held a 40.2% share, reaching USD 3.3 billion in 2024. This segment remains a dominant application area for food fibers, thanks to their growing use in items like baked snacks, whole grain breads, and cereals. Dietary fibers in baked goods improve texture, increase satiety, and align with the clean-label movement that avoids artificial additives. Confectionery manufacturers also integrate functional fibers to lower sugar and calorie content without compromising taste or texture. The surge in demand for high-fiber snack options and whole-grain bakery products continues to push innovation, especially across regions like Asia-Pacific and North America where consumer demand for wellness-oriented products is soaring.
Asia Pacific Food Fibers Market held a 42.5% share in 2024. This region's leadership is driven by increasing consumer education on digestive health, a swelling middle-class population, and rapid growth in functional food and beverage categories. Countries such as Japan, China, South Korea, and India are witnessing a transformation in dietary habits toward more fiber-rich, plant-centric foods. Ongoing support from health-conscious policies and national wellness initiatives is further driving growth. As plant-based and fiber-enhanced products gain popularity, especially in categories like baked goods and nutraceuticals, online commerce and digital retail infrastructure are playing a significant role in improving product access across diverse population groups in Asia Pacific.
Key companies shaping this Global Food Fibers Market include Archer Daniels Midland Company (ADM), Cargill, Incorporated, Roquette Freres SA, Tate & Lyle PLC, and Ingredion Incorporated. To stay competitive and expand their market share, leading companies in the food fibers sector are emphasizing innovation in fiber extraction and formulation. They are heavily investing in research to develop novel blends that are functional, easy to integrate, and have enhanced sensory properties. Businesses are also prioritizing sustainability by sourcing plant materials responsibly and improving processing efficiencies. Collaborations with food tech firms and nutrition-focused startups allow access to new markets and technologies. Moreover, brands are working to expand their clean-label offerings to align with evolving consumer expectations.
Table of Contents
Chapter 1 Methodology & Scope
- 1.1 Market scope and definition
- 1.2 Research design
- 1.2.1 Research approach
- 1.2.2 Data collection methods
- 1.3 Data mining sources
- 1.3.1 Global
- 1.3.2 Regional/Country
- 1.4 Base estimates and calculations
- 1.4.1 Base year calculation
- 1.4.2 Key trends for market estimation
- 1.5 Primary research and validation
- 1.5.1 Primary sources
- 1.6 Forecast model
- 1.7 Research assumptions and limitations
Chapter 2 Executive Summary
- 2.1 Industry 360° synopsis
- 2.2 Key market trends
- 2.2.1 Regional
- 2.2.2 Fiber type
- 2.2.3 Application
- 2.2.4 End use industry
- 2.3 TAM Analysis, 2025-2034
- 2.4 CXO perspectives: Strategic imperatives
- 2.4.1 Executive decision points
- 2.4.2 Critical success factors
- 2.5 Future Outlook and Strategic Recommendations
Chapter 3 Industry Insights
- 3.1 Industry ecosystem analysis
- 3.1.1 Supplier Landscape
- 3.1.2 Profit Margin
- 3.1.3 Value addition at each stage
- 3.1.4 Factor affecting the value chain
- 3.1.5 Disruptions
- 3.2 Industry impact forces
- 3.2.1 Growth drivers
- 3.2.2 Industry pitfalls and challenges
- 3.2.3 Market opportunities
- 3.3 Growth potential analysis
- 3.4 Regulatory landscape
- 3.4.1 North America
- 3.4.2 Europe
- 3.4.3 Asia Pacific
- 3.4.4 Latin America
- 3.4.5 Middle East & Africa
- 3.5 Porter's analysis
- 3.6 PESTEL analysis
- 3.6.1 Technology and innovation landscape
- 3.6.2 Current technological trends
- 3.6.3 Emerging technologies
- 3.7 Price trends
- 3.7.1 By region
- 3.7.2 By fiber type
- 3.8 Future market trends
- 3.9 Technology and innovation landscape
- 3.9.1 Current technological trends
- 3.9.2 Emerging technologies
- 3.10 Patent Landscape
- 3.11 Trade statistics (HS code) (Note: the trade statistics will be provided for key countries only)
- 3.11.1 Major importing countries
- 3.11.2 Major exporting countries
- 3.12 Sustainability and environmental aspects
- 3.12.1 Sustainable practices
- 3.12.2 Waste reduction strategies
- 3.12.3 Energy efficiency in production
- 3.12.4 Eco-friendly Initiatives
Chapter 4 Competitive Landscape, 2024
- 4.1 Introduction
- 4.2 Company market share analysis
- 4.2.1 By region
- 4.2.1.1 North America
- 4.2.1.2 Europe
- 4.2.1.3 Asia Pacific
- 4.2.1.4 LATAM
- 4.2.1.5 MEA
- 4.2.1 By region
- 4.3 Company matrix analysis
- 4.4 Competitive analysis of major market players
- 4.5 Competitive positioning matrix
- 4.6 Key developments
- 4.6.1 Mergers & acquisitions
- 4.6.2 Partnerships & collaborations
- 4.6.3 New Product launches
- 4.6.4 Expansion plans
Chapter 5 Market Estimates and Forecast, By Fiber Type, 2021 - 2034 (USD Million) (Kilo Tons)
- 5.1 Key trends
- 5.2 Soluble fibres
- 5.2.1 Inulin and oligofructose segment
- 5.2.2 Pectin and gums segment
- 5.2.3 Beta-glucan and specialty fibres
- 5.3 Insoluble fibres
- 5.3.1 Cellulose and modified cellulose
- 5.3.2 Wheat bran and cereal fibres
- 5.3.3 Fruit and vegetable fibres
- 5.4 Functional and prebiotic fibres
- 5.4.1 Resistant starch technologies
- 5.4.2 Galacto-oligosaccharides (GOS) and fructo-oligosaccharides (FOS)
- 5.4.3 Novel and emerging fibres
Chapter 6 Market Estimates and Forecast, By Application, 2021 - 2034 (USD Million) (Kilo Tons)
- 6.1 Key trends
- 6.2 Bakery and confectionery
- 6.2.1 Bread and baked goods
- 6.2.2 Breakfast cereals and snack foods
- 6.2.3 Confectionery and sweet goods
- 6.3 Beverages
- 6.3.1 Functional and sports beverages
- 6.3.2 Dairy and plant-based alternatives
- 6.3.3 Juice and enhanced water
- 6.4 Dairy and dairy alternatives
- 6.4.1 Yogurt and fermented products
- 6.4.2 Cheese and processed dairy
- 6.4.3 Plant-based dairy alternatives
- 6.5 Dietary supplements
- 6.5.1 Powder and capsule formats
- 6.5.2 Prebiotic and gut health supplements
- 6.5.3 Weight management and metabolic health
Chapter 7 Market Estimates and Forecast, By End use Industry, 2021 - 2034 (USD Million) (Kilo Tons)
- 7.1 Key trends
- 7.2 Food and beverage manufacturing
- 7.2.1 Large-scale food manufacturers
- 7.2.2 Regional and specialty food companies
- 7.2.3 Technology and equipment suppliers
- 7.3 Dietary supplement industry
- 7.3.1 Supplement manufacturers and brands
- 7.3.2 Contract manufacturers and private label
- 7.3.3 Distribution and retail channels
- 7.4 Functional foods and nutraceuticals
- 7.4.1 Functional food development
- 7.4.2 Medical foods and clinical nutrition
- 7.4.3 Sports and performance nutrition
- 7.5 Animal feed and pet food
- 7.5.1 Premium pet food applications
- 7.5.2 Livestock and aquaculture
- 7.5.3 Market development and innovation
Chapter 8 Market Estimates and Forecast, By Region, 2021 - 2034 (USD Million) (Kilo Tons)
- 8.1 Key trends
- 8.2 North America
- 8.2.1 U.S.
- 8.2.2 Canada
- 8.3 Europe
- 8.3.1 Germany
- 8.3.2 UK
- 8.3.3 France
- 8.3.4 Spain
- 8.3.5 Italy
- 8.3.6 Netherlands
- 8.3.7 Rest of Europe
- 8.4 Asia Pacific
- 8.4.1 China
- 8.4.2 India
- 8.4.3 Japan
- 8.4.4 Australia
- 8.4.5 South Korea
- 8.4.6 Rest of Asia Pacific
- 8.5 Latin America
- 8.5.1 Brazil
- 8.5.2 Mexico
- 8.5.3 Argentina
- 8.5.4 Rest of Latin America
- 8.6 Middle East and Africa
- 8.6.1 Saudi Arabia
- 8.6.2 South Africa
- 8.6.3 UAE
- 8.6.4 Rest of Middle East and Africa
Chapter 9 Company Profiles
- 9.1 Cargill, Incorporated
- 9.2 Tate & Lyle PLC
- 9.3 Archer Daniels Midland Company
- 9.4 Ingredion Incorporated
- 9.5 Roquette Freres SA
- 9.6 Kerry Group PLC
- 9.7 International Flavors & Fragrances Inc
- 9.8 J Rettenmaier & Sohne GmbH + Co KG
- 9.9 Nexira Inc


