

 |
市場調查報告書
商品編碼
1797710
行動擴增實境 (AR) 市場機會、成長動力、產業趨勢分析及 2025 - 2034 年預測Mobile Augmented Reality (AR) Market Opportunity, Growth Drivers, Industry Trend Analysis, and Forecast 2025 - 2034 |
||||||
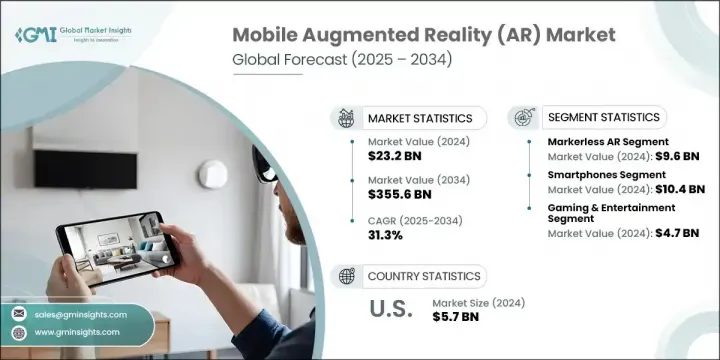
2024 年全球行動擴增實境市場規模達 232 億美元,預計到 2034 年將以 31.3% 的複合年成長率成長,達到 3,556 億美元。這一強勁成長得益於擴增實境 (AR) 智慧型手機的廣泛使用、消費者對沉浸式數位體驗日益成長的興趣,以及零售、娛樂、醫療保健和教育等領域應用的不斷擴展。高性能處理器、先進感測器和多鏡頭攝影機等技術進步推動了擴增實境在全球市場的廣泛應用。此外,5G 的推出和邊緣運算的進步正在支援低延遲、即時的 AR 交互,而這些交互先前受到網路限制。不斷壯大的 AR 開發工具生態系統也使企業和創作者能夠提供互動式行動 AR 應用程式,而電子商務和行動遊戲平台則持續刺激消費者需求。
行動 AR 還能顯著提升營運效率和用戶參與度。例如,在培訓工作流程中使用 AR 的公司報告稱,學習效率提高了 90% 以上。這些技術正在用即時視覺化指南取代傳統教學,從而減少錯誤並顯著縮短培訓時間。在電子商務領域,行動 AR 正在幫助零售商提供虛擬產品預覽,增強買家信心並減少產品退貨。各行各業的企業都在轉向行動 AR,以提升體驗個人化、提升品牌互動,並讓消費者能夠直接透過行動裝置做出明智的決策。
| 市場範圍 | |
|---|---|
| 起始年份 | 2024 |
| 預測年份 | 2025-2034 |
| 起始值 | 232億美元 |
| 預測值 | 3556億美元 |
| 複合年成長率 | 31.3% |
無標記 AR 市場在 2024 年創造了 96 億美元的收入。這種方法正獲得廣泛關注,因為它不依賴物理標記,而是結合使用 GPS、SLAM 和慣性感測器將數位內容錨定在現實環境中。零售、教育和娛樂等行業正在擁抱這項技術,以實現可部署在任何地方的互動體驗。無標記 AR 支援即時導航、沉浸式遊戲和遠距學習等應用,這促進了其快速成長。
2024年,智慧型手機市場規模達104億美元。該領域的成長得益於智慧型手機技術的快速發展,包括高解析度相機、先進的運動追蹤技術和專用AI晶片。這些技術共同打造了流暢的AR體驗,使用戶能夠與虛擬元素無縫互動。如今,即使是中階設備也配備了LiDAR掃描器和升級版GPU,行動AR的普及率正在不斷提升,智慧型手機也因此成為全球消費者AR內容的主要驅動力。
2024年,美國行動擴增實境 (AR) 市場規模達57億美元,預計到2034年將以29.4%的複合年成長率成長。該地區的成長得益於支持AR的行動裝置的廣泛普及、消費者對沉浸式內容的需求以及領先科技公司對開發者的大力支持。 5G部署的持續推進以及國家在增強數位基礎設施方面的努力也正在推動AR的普及。企業要取得成功,必須專注於提供輕量級的SDK、針對下一代網路最佳化軟體,並與內容製作商、品牌和服務供應商建立合作夥伴關係。優先考慮直覺的用戶體驗、隱私保護和無縫的空間整合,將進一步提升用戶參與度和信任度。
活躍於行動擴增實境 (AR) 市場的知名公司包括 MAXST Co., Ltd.、Talespin Reality Labs, Inc.、Wikitude GmbH、三星電子有限公司、Magic Leap, Inc.、Appentus Technologies Private Limited、Groove Jones, LLC、PTC Inc.、Apple Inc.、Blippar.com Limited、8N LLC.com為了加強市場影響力,行動 AR 領域的參與者正專注於跨平台開發工具、增強 AR 引擎性能以及整合 AI 驅動的個人化功能。許多公司正在透過收購以及與零售商、遊戲工作室和技術開發商建立策略聯盟來擴展其 AR 內容組合。他們非常重視讓高階和中階智慧型手機都能獲得 AR 體驗。
目錄
第1章:方法論與範圍
第2章:執行摘要
2.2.1. 技術類型
- 設備類型
- 應用
- 北美洲
- 歐洲
- 亞太地區
- 拉丁美洲
- 中東和非洲
- TAM分析,2025-2034
- CXO 觀點:策略要務
- 執行決策點
- 關鍵成功因素
- 未來展望與策略建議
第3章:行業洞察
- 產業生態系統分析
- 供應商概況
- 利潤率
- 成本結構
- 每個階段的增值
- 影響價值鏈的因素
- 中斷
- 產業衝擊力
- 成長動力
- 智慧型手機普及率不斷提升,擴增實境功能日益普及
- 零售和電子商務需求激增
- 5G和邊緣運算的擴展
- 行動遊戲和娛樂的普及率不斷提高
- 支援生態系統和開發者工具
- 產業陷阱與挑戰
- 設備限制和碎片化
- 隱私和安全問題
- 市場機會
- 成長動力
- 成長潛力分析
- 監管格局
- 北美洲
- 歐洲
- 亞太地區
- 拉丁美洲
- 中東和非洲
- 波特的分析
- PESTEL分析
- 技術和創新格局
- 當前的技術趨勢
- 新興技術
- 價格趨勢
- 按地區
- 按產品
- 定價策略
- 新興商業模式
- 合規性要求
- 永續性措施
- 消費者情緒分析
- 專利和智慧財產權分析
- 地緣政治與貿易動態
第4章:競爭格局
- 簡介公司市佔率分析
- 公司市佔率分析
- 按地區
4.2.1. 北美
4.2.2. 歐洲
4.2.3. 亞太地區
- 市場集中度分析
- 關鍵參與者的競爭基準化分析
- 財務績效比較
4.3.1.1. 收入
4.3.1.2. 利潤率
4.3.1.3. 研發
- 產品組合比較
4.3.2.1. 產品範圍廣度
4.3.2.2. 技術
4.3.2.3. 創新
- 地理分佈比較
4.3.3.1. 全球足跡分析
4.3.3.2. 服務網路覆蓋
4.3.3.3. 各地區市場滲透率
- 競爭定位矩陣
4.3.4.1. 領導者
4.3.4.2. 挑戰者
4.3.4.3. 關注者
4.3.4.4. 利基市場參與者
- 戰略展望矩陣
- 2021-2024 年關鍵發展
- 合併與收購
- 夥伴關係與合作
- 技術進步
- 擴張和投資策略
- 永續發展舉措
- 數位轉型舉措
- 新興/新創企業競爭對手格局
第5章:市場估計與預測:依技術類型,2021 - 2034 年
- 基於標記的擴增實境
- 無標記擴增實境
- 基於投影的擴增實境
- 基於疊加的擴增實境
第6章:市場估計與預測:按設備類型,2021 - 2034 年
- 智慧型手機
- 平板電腦
- 穿戴式裝置
- 手持式遊戲機
第7章:市場估計與預測:按應用,2021 - 2034 年
- 遊戲與娛樂
- 零售與電子商務
- 教育與培訓
- 衛生保健
- 軍事與國防
- 旅行與旅遊
- 房地產與建築
- 其他
第8章:市場估計與預測:按地區,2021 - 2034 年
- 主要趨勢
- 北美洲
- 美國
- 加拿大
- 歐洲
- 德國
- 英國
- 法國
- 西班牙
- 魚子
- 亞太地區
- 中國
- 印度
- 日本
- 韓國
- 澳洲
- 亞太地區
- 拉丁美洲
- 中東和非洲
- 阿拉伯聯合大公國
- 沙烏地阿拉伯
- 南非
- 羅馬
第9章:公司簡介
- 8ninths Inc. (Valence)
- Appentus Technologies Private Limited
- Apple Inc.
- APX Labs, Inc.
- Atheer, Inc.
- Augment Inc.
- BidOn Games Studio, LLC
- Blippar.com Limited
- EON Reality, Inc.
- Google LLC
- Groove Jones, LLC
- HQSoftware OU
- INDE Appshaker Ltd.
- Magic Leap, Inc.
- MAXST Co., Ltd.
- NEXT/NOW, LLC
- Niantic, Inc.
- PTC Inc. (formerly Parametric)
- Samsung Electronics Co., Ltd.
- Scanta Inc.
- Scope Technologies US Inc.
- Talespin Reality Labs, Inc.
- VironIT LLC
- Wikitude GmbH
- Zappar Ltd. (UK)
The Global Mobile Augmented Reality Market was valued at USD 23.2 billion in 2024 and is estimated to grow at a CAGR of 31.3% to reach USD 355.6 billion by 2034. This robust growth is driven by the widespread use of AR-enabled smartphones, increasing consumer interest in immersive digital experiences, and expanding applications across sectors such as retail, entertainment, healthcare, and education. Technological advances such as high-performance processors, advanced sensors, and multi-lens cameras have enabled broader adoption across global markets. Additionally, the rollout of 5G and progress in edge computing are supporting low-latency, real-time AR interactions that were previously limited by network constraints. The growing ecosystem of AR development tools is also empowering businesses and creators to deliver interactive mobile AR applications, while e-commerce and mobile gaming platforms continue to fuel consumer demand.
Mobile AR also delivers measurable gains in operational efficiency and user engagement. For example, companies utilizing AR in training workflows have reported over 90% improvement in learning efficiency. These technologies are replacing traditional instructions with real-time visual guides, reducing errors and compressing training time significantly. In e-commerce, mobile AR is helping retailers offer virtual product previews, increasing buyer confidence and reducing product returns. Businesses across sectors are turning to mobile AR to improve experience personalization, elevate brand interaction, and enable informed decision-making by consumers directly from their mobile devices.
| Market Scope | |
|---|---|
| Start Year | 2024 |
| Forecast Year | 2025-2034 |
| Start Value | $23.2 billion |
| Forecast Value | $355.6 billion |
| CAGR | 31.3% |
The markerless AR segment generated USD 9.6 billion in 2024. This approach is gaining widespread traction as it does not rely on physical markers but instead uses a combination of GPS, SLAM, and inertial sensors to anchor digital content within real-world environments. Industries such as retail, education, and entertainment are embracing this technology for interactive experiences that can be deployed anywhere. Markerless AR supports applications such as real-time navigation, immersive gaming, and remote learning, which has contributed to its rapid growth.
The smartphones segment generated USD 10.4 billion in 2024. The growth of this segment is attributed to the rapid evolution of smartphone technology, including high-resolution cameras, advanced motion tracking, and dedicated AI chips. These components collectively provide a smooth AR experience, enabling users to interact with virtual elements seamlessly. With LiDAR scanners and upgraded GPUs now available in even mid-range devices, the accessibility of mobile AR is expanding across demographics, making smartphones the primary driver of consumer-facing AR content globally.
United States Mobile Augmented Reality (AR) Market was USD 5.7 billion in 2024 and is forecast to grow at a CAGR of 29.4% by 2034. Growth in this region is supported by the widespread adoption of AR-ready mobile devices, consumer demand for immersive content, and strong developer support from leading tech firms. Continued progress in 5G deployment and national efforts to enhance digital infrastructure are also reinforcing adoption. For businesses to succeed, they must focus on delivering lightweight SDKs, optimizing software for next-gen networks, and establishing partnerships with content producers, brands, and service providers. Prioritizing intuitive UX, privacy safeguards, and seamless spatial integration will further increase user engagement and trust.
Prominent companies active in the Mobile Augmented Reality (AR) Market include MAXST Co., Ltd., Talespin Reality Labs, Inc., Wikitude GmbH, Samsung Electronics Co., Ltd., Magic Leap, Inc., Appentus Technologies Private Limited, Groove Jones, LLC, PTC Inc., Apple Inc., Blippar.com Limited, 8ninths Inc. (Valence), BidOn Games Studio, LLC, Niantic, Inc., and Google LLC. To strengthen their market presence, players in the mobile AR landscape are focusing on cross-platform development tools, enhancing AR engine performance, and integrating AI-driven personalization features. Many companies are expanding their AR content portfolios through acquisitions and strategic alliances with retailers, game studios, and tech developers. There is a strong emphasis on making AR experiences accessible on both high-end and mid-tier smartphones.
Table of Contents
Chapter 1 Methodology and Scope
- 1.1 Market scope and definition
- 1.2 Research design
- 1.2.1 Research approach
- 1.2.2 Data collection methods
- 1.3 Data mining sources
- 1.3.1 Global
- 1.3.2 Regional/Country
- 1.4 Base estimates and calculations
- 1.4.1 Base year calculation
- 1.4.2 Key trends for market estimation
- 1.5 Primary research and validation
- 1.5.1 Primary sources
- 1.6 Forecast model
- 1.7 Research assumptions and limitations
Chapter 2 Executive Summary
- 2.1 Industry 3600 synopsis
- 2.2 Key market trends
2.2.1. Technology type
- 2.2.2 Device type
- 2.2.3 Application
- 2.2.5 North America
- 2.2.6 Europe
- 2.2.7 Asia Pacific
- 2.2.8 Latin America
- 2.2.9 Middle East & Africa
- 2.3 TAM Analysis, 2025-2034 (USD Million)
- 2.4 CXO perspectives: Strategic imperatives
- 2.5 Executive decision points
- 2.6 Critical Success Factors
- 2.7 Future Outlook and Strategic Recommendations
Chapter 3 Industry Insights
- 3.1 Industry ecosystem analysis
- 3.1.1 Supplier Landscape
- 3.1.2 Profit Margin
- 3.1.3 Cost structure
- 3.1.4 Value addition at each stage
- 3.1.5 Factor affecting the value chain
- 3.1.6 Disruptions
- 3.2 Industry impact forces
- 3.2.1 Growth drivers
- 3.2.1.1 Rising smartphone penetration with AR capabilities
- 3.2.1.2 Surging demand in retail and e-commerce
- 3.2.1.3 Expansion of 5g and edge computing
- 3.2.1.4 Increased adoption in mobile gaming and entertainment
- 3.2.1.5 Supportive ecosystem and developer tools
- 3.2.2 Industry pitfalls and challenges
- 3.2.2.1 Device Limitations and Fragmentation
- 3.2.2.2 Privacy and Security Concerns
- 3.2.3 Market Opportunities
- 3.2.1 Growth drivers
- 3.3 Growth potential analysis
- 3.4 Regulatory landscape
- 3.4.1 North America
- 3.4.2 Europe
- 3.4.3 Asia Pacific
- 3.4.4 Latin America
- 3.4.5 Middle East & Africa
- 3.5 Porter's analysis
- 3.6 PESTEL analysis
- 3.7 Technological and Innovation landscape
- 3.7.1 Current technological trends
- 3.7.2 Emerging technologies
- 3.8 Price Trends
- 3.8.1 By region
- 3.8.2 By product
- 3.9 Pricing strategies
- 3.10 Emerging business models
- 3.11 Compliance requirements
- 3.12 Sustainability measures
- 3.13 Consumer sentiment analysis
- 3.14 Patent and IP analysis
- 3.15 Geopolitical and trade dynamics
Chapter 4 Competitive Landscape, 2024
- 4.1 Introduction Company market share analysis
- 4.2 Company market share analysis
- 4.2.1 By region
4.2.1. North America
4.2.2. Europe
4.2.3. Asia Pacific
- 4.2.2 Market concentration analysis
- 4.3 Competitive Benchmarking of key Players
- 4.3.1 Financial Performance Comparison
4.3.1.1. Revenue
4.3.1.2. Profit Margin
4.3.1.3. R&D
- 4.3.2 Product Portfolio Comparison
4.3.2.1. Product Range Breadth
4.3.2.2. Technology
4.3.2.3. Innovation
- 4.3.3 Geographic Presence Comparison
4.3.3.1. Global Footprint Analysis
4.3.3.2. Service Network Coverage
4.3.3.3. Market Penetration by Region
- 4.3.4 Competitive Positioning Matrix
4.3.4.1. Leaders
4.3.4.2. Challengers
4.3.4.3. Followers
4.3.4.4. Niche Players
- 4.3.5 Strategic outlook matrix
- 4.4 Key developments, 2021-2024
- 4.4.1 Mergers and Acquisitions
- 4.4.2 Partnerships and Collaborations
- 4.4.3 Technological Advancements
- 4.4.4 Expansion and Investment Strategies
- 4.4.5 Sustainability Initiatives
- 4.4.6 Digital Transformation Initiatives
- 4.5 Emerging/ Startup Competitors Landscape
Chapter 5 Market Estimates & Forecast, By Technology Type, 2021 - 2034 (USD Billion)
- 5.1 Marker-based AR
- 5.2 Markerless AR
- 5.3 Projection-based AR
- 5.4 Superimposition-based AR
Chapter 6 Market estimates & forecast, By Device Type, 2021 - 2034 (USD Billion)
- 6.1 Smartphones
- 6.2 Tablets
- 6.3 Wearables
- 6.4 Handheld Consoles
Chapter 7 Market estimates & forecast, By Application, 2021 - 2034 (USD Billion)
- 7.1 Gaming & Entertainment
- 7.2 Retail & E-commerce
- 7.3 Education & Training
- 7.4 Healthcare
- 7.5 Military & Defense
- 7.6 Travel & Tourism
- 7.7 Real Estate & Architecture
- 7.8 Others
Chapter 8 Market Estimates and Forecast, By Region, 2021 - 2034 (USD Million)
- 8.1 Key trends
- 8.2 North America
- 8.2.1 U.S.
- 8.2.2 Canada
- 8.3 Europe
- 8.3.1 Germany
- 8.3.2 U.K.
- 8.3.3 France
- 8.3.4 Spain
- 8.3.5 ROE
- 8.4 Asia Pacific
- 8.4.1 China
- 8.4.2 India
- 8.4.3 Japan
- 8.4.4 South Korea
- 8.4.5 Australia
- 8.4.6 RoAPAC
- 8.5 Latin America
- 8.6 Middle East & Africa
- 8.6.1 UAE
- 8.6.2 Saudi Arabia
- 8.6.3 South Africa
- 8.6.4 RoMEA
Chapter 9 Company Profile
- 9.1 8ninths Inc. (Valence)
- 9.2 Appentus Technologies Private Limited
- 9.3 Apple Inc.
- 9.4 APX Labs, Inc.
- 9.5 Atheer, Inc.
- 9.6 Augment Inc.
- 9.7 BidOn Games Studio, LLC
- 9.8 Blippar.com Limited
- 9.9 EON Reality, Inc.
- 9.10 Google LLC
- 9.11 Groove Jones, LLC
- 9.12 HQSoftware OU
- 9.13 INDE Appshaker Ltd.
- 9.14 Magic Leap, Inc.
- 9.15 MAXST Co., Ltd.
- 9.16 NEXT/NOW, LLC
- 9.17 Niantic, Inc.
- 9.18 PTC Inc. (formerly Parametric)
- 9.19 Samsung Electronics Co., Ltd.
- 9.20 Scanta Inc.
- 9.21 Scope Technologies US Inc.
- 9.22 Talespin Reality Labs, Inc.
- 9.23 VironIT LLC
- 9.24 Wikitude GmbH
- 9.25 Zappar Ltd. (UK)
 2026-2030年全球行動擴增實境(AR)市場
 行動擴增實境市場:2026-2032年全球市場預測(按設備類型、組件、追蹤技術、顯示類型和應用分類)
 2026年行動擴增實境(MAR)全球市場報告
 行動擴增實境(AR) 市場分析及預測(至 2035 年):按類型、產品類型、服務、技術、組件、應用、形式、設備和最終用戶分類
 行動擴增實境市場-全球產業規模、佔有率、趨勢、機會、預測:按組件、應用、最終用戶、地區和競爭對手分類,2021-2031年
 行動 AR(擴增實境)市場規模、佔有率、成長分析,按類型、按組件、按設備類型、按應用、按地區 - 行業預測,2024-2031 年