


 |
市場調查報告書
商品編碼
1782114
聲納吸收橡膠複合材料市場機會、成長動力、產業趨勢分析及2025-2034年預測Sonar Absorbing Rubber Composites Market Opportunity, Growth Drivers, Industry Trend Analysis, and Forecast 2025 - 2034 |
||||||
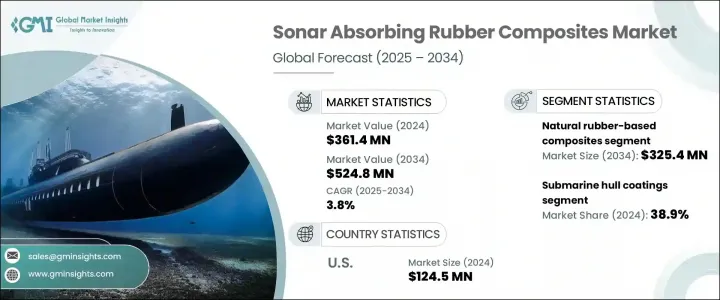
2024年,全球聲納吸收橡膠複合材料市場規模達3.614億美元,預計到2034年將以3.8%的複合年成長率成長,達到5.248億美元。國防開支的激增以及對水下隱身技術的日益重視,支撐了市場的成長。全球各國日益重視海軍能力的提升,已成為該產業成長的關鍵因素。已開發國家和發展中國家的海軍都在加大對隱身技術的投資,尤其是在潛水艇和其他水下艦艇方面。在此背景下,聲納吸收橡膠複合材料因其在降低聲納探測風險和提升海上平台聲學隱身性能方面發揮著重要作用,因此變得至關重要。
隨著國防部隊持續優先考慮水下隱蔽移動和作戰保密性,對能夠吸收、偏轉和衰減聲納波的橡膠基材料的需求顯著增加。這些複合材料兼具柔韌性、耐用性和聲學阻尼性能,使其成為下一代海軍應用不可或缺的一部分。研發工作也推動製造商提供性能指標更高的橡膠材料,以配合不斷發展的軍事戰略,這些戰略專注於水下作戰、偵察和在爭議區域進行靜默作戰。
| 市場範圍 | |
|---|---|
| 起始年份 | 2024 |
| 預測年份 | 2025-2034 |
| 起始值 | 3.614億美元 |
| 預測值 | 5.248億美元 |
| 複合年成長率 | 3.8% |
從材料角度來看,天然橡膠基複合材料佔據了最大的收入佔有率,2024年達到2.274億美元。預計到預測期末,該部分收入將達到3.254億美元。天然橡膠基複合材料的主導地位可以歸因於其獨特的機械和聲學性能。它們具有優異的彈性和較低的剛度,這有助於在寬頻率範圍內實現卓越的阻尼性能。這些特性使其成為減輕聲納反射的理想選擇,從而降低水下探測的風險。它們在各種海軍應用中的廣泛應用凸顯了其在先進水下隱身系統中的持續重要性。
從應用角度來看,2024年,潛水艇船體塗料佔據了38.9%的市場佔有率,成為應用領域的領頭羊。海軍任務中對被動聲隱身的依賴日益增加,這提升了能夠干擾或吸收聲納訊號的專用船體塗料的重要性。聲納吸收橡膠複合材料是這些塗料中的關鍵層,可以主動減弱聲納反射並降低潛艇的聲學足跡。這增強了潛水艇在監視或作戰場景中隱藏行動的能力。
從地區來看,美國仍然是聲納吸收橡膠複合材料的主要市場,2024 年市場價值為 1.245 億美元。預計到 2034 年,美國市場的複合年成長率將達到 3.6%。政府資助的海軍現代化建設是主要的成長催化劑。作為其長期國防戰略的一部分,美國持續升級和改造其潛艦艦隊、水面作戰艦艇和無人水下系統,以增強其隱身性能。抑制聲納探測和增強聲屏蔽的需求推動了對專為海洋環境設計的高性能複合材料的需求。這些材料擴大被整合到新建和現有船舶中,以確保在水下作業中的技術優勢。
聲納吸收橡膠複合材料市場的競爭格局是由那些重視創新、擴張和策略合作的關鍵製造商所塑造。柯林斯航太、哈欽森公司、特瑞堡公司、精密聲學有限公司和3M公司等領先公司正在積極投資研發,以提升其橡膠複合材料的聲學性能和機械完整性。業內參與者也採取產能擴張、併購和產品開發等策略,以鞏固其全球市場地位,並滿足日益成長的國防領域需求。隨著海軍裝備技術複雜性的不斷提高,這些公司有望透過材料創新,在塑造未來水下隱身能力方面發揮至關重要的作用。
目錄
第1章:方法論與範圍
第2章:執行摘要
第3章:行業洞察
- 產業生態系統分析
- 供應商格局
- 利潤率
- 每個階段的增值
- 影響價值鏈的因素
- 中斷
- 產業衝擊力
- 成長動力
- 產業陷阱與挑戰
- 市場機會
- 成長潛力分析
- 監管格局
- 北美洲
- 歐洲
- 亞太地區
- 拉丁美洲
- 中東和非洲
- 波特的分析
- PESTEL分析
- 價格趨勢
- 按地區
- 依材料類型
- 未來市場趨勢
- 技術和創新格局
- 當前的技術趨勢
- 新興技術
- 專利格局
- 貿易統計(HS編碼)(註:僅提供重點國家的貿易統計資料)
- 主要進口國
- 主要出口國
- 永續性和環境方面
- 永續實踐
- 減少廢棄物的策略
- 生產中的能源效率
- 環保舉措
- 碳足跡考量
第4章:競爭格局
- 介紹
- 公司市佔率分析
- 按地區
- 北美洲
- 歐洲
- 亞太地區
- 拉丁美洲
- MEA
- 按地區
- 公司矩陣分析
- 主要市場參與者的競爭分析
- 競爭定位矩陣
- 關鍵進展
- 併購
- 夥伴關係與合作
- 新產品發布
- 擴張計劃
第5章:市場規模及預測:依材料類型,2021-2034
- 主要趨勢
- 天然橡膠基複合材料
- 合成橡膠基複合材料
- 丁腈橡膠(NBR)
- 乙丙橡膠(EPDM)
- 氯丁橡膠(氯丁橡膠)
- 矽橡膠
- 丁基橡膠
- 其他
- 共混橡膠複合材料
第6章:市場規模及預測:依填充劑類型,2021-2034
- 主要趨勢
- 碳基填料
- 炭黑
- 碳奈米管
- 石墨烯
- 其他
- 金屬粉末
- 鐵粉
- 鎳粉
- 其他
- 陶瓷填料
- 空心微球
- 其他
第7章:市場規模及預測:依應用,2021-2034
- 主要趨勢
- 潛水艇船體塗料
- 水面船舶聲學磚
- 聲納罩塗層
- 推進系統組件
- 隔音板和隔音罩
- 水聲研究設備
- 無人水下航行器(UUVS)
- 其他
第8章:市場規模及預測:依最終用途,2021-2034
- 主要趨勢
- 軍事與國防
- 海軍
- 國防承包商
- 商業船舶
- 船舶工業
- 海上工業
- 研究與學術機構
- 其他
第9章:市場規模及預測:按地區,2021-2034
- 主要趨勢
- 北美洲
- 美國
- 加拿大
- 歐洲
- 英國
- 德國
- 法國
- 義大利
- 西班牙
- 歐洲其他地區
- 亞太地區
- 中國
- 印度
- 日本
- 韓國
- 澳洲
- 亞太其他地區
- 拉丁美洲
- 巴西
- 墨西哥
- 阿根廷
- 拉丁美洲其他地區
- MEA
- 南非
- 沙烏地阿拉伯
- 阿拉伯聯合大公國
- 中東和非洲其他地區
第10章:公司簡介
- Collins Aerospace
- Trelleborg
- Hutchinson
- Precision Acoustics
- 3M Company
- BAE Systems
- Thales Group
- General Dynamics Corporation
- Lockheed Martin Corporation
The Global Sonar Absorbing Rubber Composites Market was valued at USD 361.4 million in 2024 and is estimated to grow at a CAGR of 3.8% to reach USD 524.8 million by 2034. The market growth is underpinned by the surge in defense spending and heightened focus on underwater stealth technologies. The increasing emphasis on upgrading naval capabilities across the world has become a key growth factor for this sector. Navies across developed and developing nations alike are intensifying their investment in stealth-based technologies, particularly for submarines and other underwater vessels. In this context, sonar absorbing rubber composites have become crucial due to their role in minimizing sonar detection and improving the acoustic stealth of maritime platforms.
As defense forces continue to prioritize undetectable movement and operational secrecy underwater, the demand for rubber-based materials that can absorb, deflect, and attenuate sonar waves has significantly intensified. These composites offer a balance of flexibility, durability, and acoustic dampening properties, making them integral to next-generation naval applications. Research and development efforts are also pushing manufacturers to deliver rubber materials with enhanced performance metrics, aligning with evolving military strategies focused on underwater warfare, reconnaissance, and silent operation in contested zones.
| Market Scope | |
|---|---|
| Start Year | 2024 |
| Forecast Year | 2025-2034 |
| Start Value | $361.4 Million |
| Forecast Value | $524.8 Million |
| CAGR | 3.8% |
Material-wise, natural rubber-based composites held the largest revenue share, accounting for USD 227.4 million in 2024. This segment is anticipated to reach USD 325.4 million by the end of the forecast period. The dominance of natural rubber-based composites can be attributed to their unique mechanical and acoustic properties. They possess excellent elasticity and low stiffness, which contribute to superior damping behavior across wide frequency ranges. These features make them ideal for mitigating sonar reflections, thereby reducing the risk of underwater detection. Their broad use across various naval applications highlights their continuing relevance in advanced underwater stealth systems.
Application-wise, in 2024, submarine hull coatings led the application landscape, commanding 38.9% of the market share. The increasing reliance on passive acoustic stealth during naval missions has elevated the importance of specialized hull coatings that can disrupt or absorb sonar signals. Sonar absorbing rubber composites serve as a critical layer in these coatings, actively diminishing sonar reflections and reducing the vessel's acoustic footprint. This enhances the submarine's ability to operate covertly during surveillance or combat scenarios.
Regionally, the United States remains a key market for sonar absorbing rubber composites, with a market value of USD 124.5 million in 2024. The U.S. market is projected to register a CAGR of 3.6% through 2034. Government-funded naval modernization efforts are acting as a primary growth catalyst. As part of its long-term defense strategy, the U.S. continues to upgrade and retrofit its submarine fleets, surface combatants, and unmanned underwater systems with stealth-enhancing features. The need to suppress sonar detection and enhance acoustic shielding has pushed demand for high-performance composite materials specifically tailored for marine environments. These materials are increasingly being integrated into new builds and existing vessels alike, ensuring technological superiority in underwater operations.
The competitive landscape of the sonar absorbing rubber composites market is shaped by key manufacturers that prioritize innovation, expansion, and strategic collaborations. Leading companies such as Collins Aerospace, Hutchinson SA, Trelleborg AB, Precision Acoustics Ltd., and 3M Company are actively investing in R&D to enhance the acoustic performance and mechanical integrity of their rubber composites. Industry players are also adopting strategies like capacity augmentation, mergers and acquisitions, and product development to strengthen their global market position and respond to growing defense sector demands. As technological complexity in naval equipment continues to advance, these firms are expected to play a vital role in shaping the future of underwater stealth capabilities through materials innovation.
Table of Contents
Chapter 1 Methodology & Scope
- 1.1 Market scope and definition
- 1.2 Research design
- 1.2.1 Research approach
- 1.2.2 Data collection methods
- 1.3 Data mining sources
- 1.3.1 Global
- 1.3.2 Regional/Country
- 1.4 Base estimates and calculations
- 1.4.1 Base year calculation
- 1.4.2 Key trends for market estimation
- 1.5 Primary research and validation
- 1.5.1 Primary sources
- 1.6 Forecast model
- 1.7 Research assumptions and limitations
Chapter 2 Executive Summary
- 2.1 Industry 3600 synopsis
- 2.2 Key market trends
- 2.2.1 Regional
- 2.2.2 Material type
- 2.2.3 Filler type
- 2.2.4 Application
- 2.2.5 End use
- 2.3 TAM analysis, 2025-2034
- 2.4 CXO perspectives: Strategic imperatives
- 2.4.1 Executive decision points
- 2.4.2 Critical success factors
- 2.5 Future outlook and strategic recommendations
Chapter 3 Industry Insights
- 3.1 Industry ecosystem analysis
- 3.1.1 Supplier landscape
- 3.1.2 Profit margin
- 3.1.3 Value addition at each stage
- 3.1.4 Factor affecting the value chain
- 3.1.5 Disruptions
- 3.2 Industry impact forces
- 3.2.1 Growth drivers
- 3.2.2 Industry pitfalls and challenges
- 3.2.3 Market opportunities
- 3.3 Growth potential analysis
- 3.4 Regulatory landscape
- 3.4.1 North America
- 3.4.2 Europe
- 3.4.3 Asia Pacific
- 3.4.4 Latin America
- 3.4.5 Middle East & Africa
- 3.5 Porter’s analysis
- 3.6 PESTEL analysis
- 3.6.1 Technology and innovation landscape
- 3.6.2 Current technological trends
- 3.6.3 Emerging technologies
- 3.7 Price trends
- 3.7.1 By region
- 3.7.2 By material type
- 3.8 Future market trends
- 3.9 Technology and innovation landscape
- 3.9.1 Current technological trends
- 3.9.2 Emerging technologies
- 3.10 Patent landscape
- 3.11 Trade statistics (HS code) (Note: the trade statistics will be provided for key countries only)
- 3.11.1 Major importing countries
- 3.11.2 Major exporting countries
- 3.12 Sustainability and environmental aspects
- 3.12.1 Sustainable practices
- 3.12.2 Waste reduction strategies
- 3.12.3 Energy efficiency in production
- 3.12.4 Eco-friendly initiatives
- 3.13 Carbon footprint considerations
Chapter 4 Competitive Landscape, 2024
- 4.1 Introduction
- 4.2 Company market share analysis
- 4.2.1 By region
- 4.2.1.1 North America
- 4.2.1.2 Europe
- 4.2.1.3 Asia Pacific
- 4.2.1.4 LATAM
- 4.2.1.5 MEA
- 4.2.1 By region
- 4.3 Company matrix analysis
- 4.4 Competitive analysis of major market players
- 4.5 Competitive positioning matrix
- 4.6 Key developments
- 4.6.1 Mergers & acquisitions
- 4.6.2 Partnerships & collaborations
- 4.6.3 New product launches
- 4.6.4 Expansion plans
Chapter 5 Market Size and Forecast, By Material Type, 2021-2034 (USD Million) (Tons)
- 5.1 Key trends
- 5.2 Natural rubber-based composites
- 5.3 Synthetic rubber-based composites
- 5.3.1 Nitrile rubber (NBR)
- 5.3.2 Ethylene propylene diene monomer (EPDM)
- 5.3.3 Neoprene (chloroprene rubber)
- 5.3.4 Silicone rubber
- 5.3.5 Butyl rubber
- 5.3.6 Others
- 5.4 Blended rubber composites
Chapter 6 Market Size and Forecast, By Filler Type, 2021-2034 (USD Million) (Tons)
- 6.1 Key trends
- 6.2 Carbon-based fillers
- 6.2.1 Carbon black
- 6.2.2 Carbon nanotubes
- 6.2.3 Graphene
- 6.2.4 Others
- 6.3 Metal powders
- 6.3.1 Iron powder
- 6.3.2 Nickel powder
- 6.3.3 Others
- 6.4 Ceramic fillers
- 6.5 Hollow microspheres
- 6.6 Others
Chapter 7 Market Size and Forecast, By Application, 2021-2034 (USD Million) (Tons)
- 7.1 Key trends
- 7.2 Submarine hull coatings
- 7.3 Surface vessel acoustic tiles
- 7.4 Sonar dome coatings
- 7.5 Propulsion system components
- 7.6 Acoustic baffles and enclosures
- 7.7 Underwater acoustic research equipment
- 7.8 Unmanned underwater vehicles (UUVS)
- 7.9 Others
Chapter 8 Market Size and Forecast, By End Use, 2021-2034 (USD Million) (Tons)
- 8.1 Key trends
- 8.2 Military & defense
- 8.2.1 Naval forces
- 8.2.2 Defense contractors
- 8.3 Commercial marine
- 8.3.1 Shipbuilding industry
- 8.3.2 Offshore industry
- 8.4 Research & academic institutions
- 8.5 Others
Chapter 9 Market Size and Forecast, By Region, 2021-2034 (USD Million) (Tons)
- 9.1 Key trends
- 9.2 North America
- 9.2.1 U.S.
- 9.2.2 Canada
- 9.3 Europe
- 9.3.1 UK
- 9.3.2 Germany
- 9.3.3 France
- 9.3.4 Italy
- 9.3.5 Spain
- 9.3.6 Rest of Europe
- 9.4 Asia Pacific
- 9.4.1 China
- 9.4.2 India
- 9.4.3 Japan
- 9.4.4 South Korea
- 9.4.5 Australia
- 9.4.6 Rest of Asia Pacific
- 9.5 Latin America
- 9.5.1 Brazil
- 9.5.2 Mexico
- 9.5.3 Argentina
- 9.5.4 Rest of Latin America
- 9.6 MEA
- 9.6.1 South Africa
- 9.6.2 Saudi Arabia
- 9.6.3 UAE
- 9.6.4 Rest of Middle East & Africa
Chapter 10 Company Profiles
- 10.1 Collins Aerospace
- 10.2 Trelleborg
- 10.3 Hutchinson
- 10.4 Precision Acoustics
- 10.5 3M Company
- 10.6 BAE Systems
- 10.7 Thales Group
- 10.8 General Dynamics Corporation
- 10.9 Lockheed Martin Corporation
 汽車售後避震器市場:按車輛類型、產品類型、核心類型、分銷管道、最終用戶、懸吊類型和技術分類-2026-2032年全球市場預測汽車減震器市場:按懸吊類型、設計、安裝位置、車輛類型和銷售管道分類-2026-2032年全球市場預測汽車避震器市場:依產品類型、車輛類型、通路和銷售管道分類-2026-2032年全球市場預測
 2026年全球汽車避震器市場報告多功能自動衝擊試驗機市場:依產品類型、技術、銷售管道、應用、最終用戶分類,全球預測(2026-2032)
 全球減震器市場報告、性能及預測(2021-2032年)商用車避震器市場按技術、設計類型、車輛等級、通路和最終用途產業分類,全球預測(2026-2032年)摩托車轉向阻尼器售後市場按產品類型、摩托車類型、分銷管道、最終用戶、價格範圍、調節類型和材料分類,全球預測,2026-2032年摩托車轉向阻尼器市場按類型、分銷管道、最終用途、應用、技術和安裝方式分類,全球預測(2026-2032)摩托車電子避震器市場:依最終用戶、車輛類型、地區、技術和銷售管道,全球預測,2026-2032年