

 |
市場調查報告書
商品編碼
1773357
指紋感應器市場機會、成長動力、產業趨勢分析及 2025 - 2034 年預測Fingerprint Sensor Market Opportunity, Growth Drivers, Industry Trend Analysis, and Forecast 2025 - 2034 |
||||||
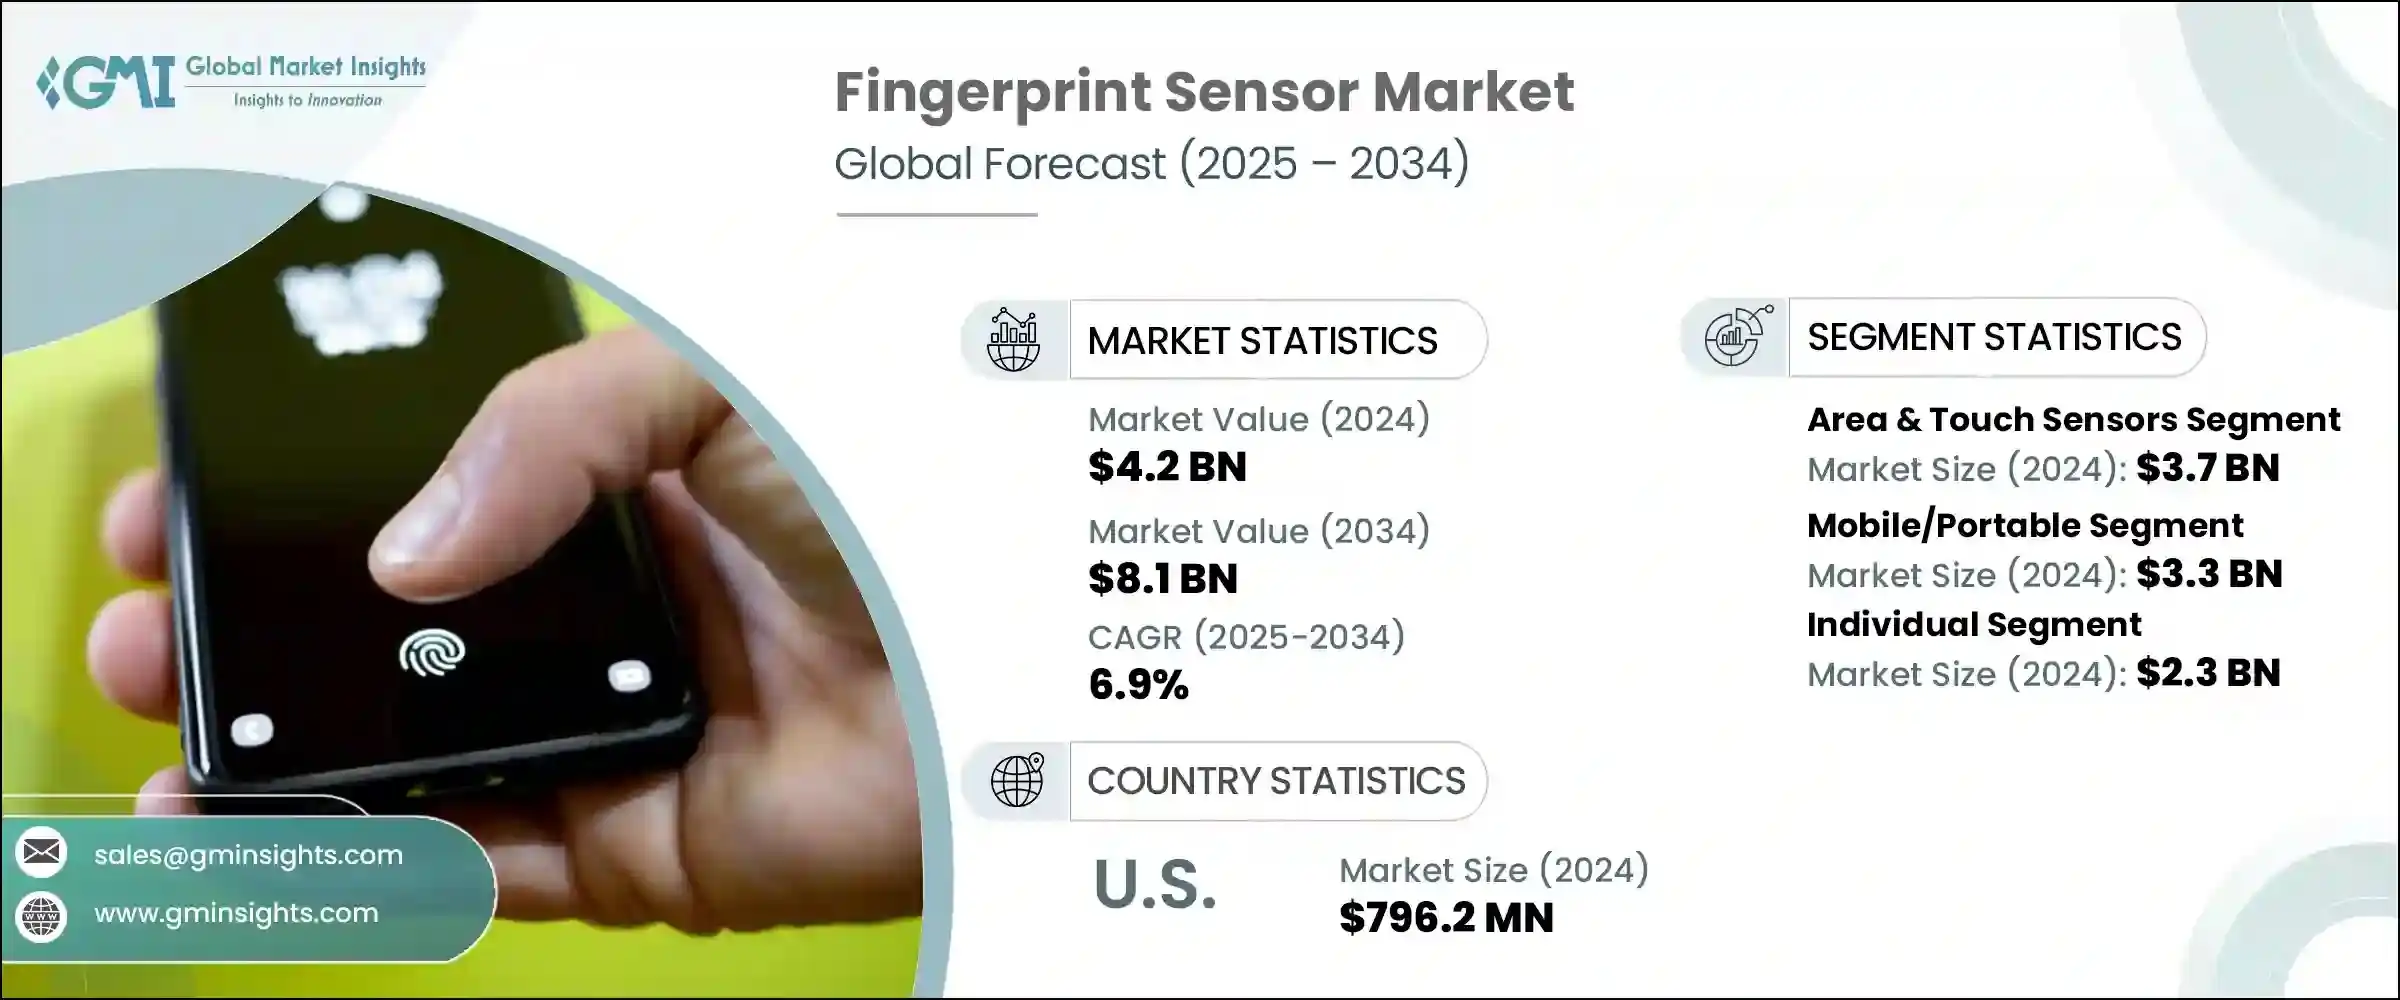
2024年,全球指紋感應器市場規模達42億美元,預計2034年將以6.9%的複合年成長率成長,達到81億美元。這一成長主要源於對安全生物識別驗證的需求不斷成長,以及消費者對無縫身份驗證解決方案的日益青睞。隨著數位安全日益融入日常生活,指紋感應器在便利性和可靠性之間實現了理想的平衡。感測器設計和性能的快速進步,正在提升各行業指紋認證的準確性和適應性。
從傳統的電容式技術發展到更強大的超音波和光學感測器,消除了諸如指尖潮濕或污漬等常見的識別難題。例如,超音波指紋感應器依靠聲波映射,具有更高的防偽性和精度。這些技術進步正在開啟智慧型手機以外的全新應用,擴展到智慧卡、汽車系統和高安全性門禁控制領域。
| 市場範圍 | |
|---|---|
| 起始年份 | 2024 |
| 預測年份 | 2025-2034 |
| 起始值 | 42億美元 |
| 預測值 | 81億美元 |
| 複合年成長率 | 6.9% |
指紋技術如今正被廣泛應用於各種消費和商業產品中,包括筆記型電腦、支付終端、門鎖和攜帶式電子設備。只需輕輕一觸即可解鎖裝置或完成交易,這不僅符合人們對速度、安全性和隱私日益成長的期望,而且不會影響用戶體驗。製造商正順應這一趨勢,將指紋感測器嵌入下一代電子產品中,推動其廣泛應用。
區域感測器和觸控感測器領域佔據市場主導地位,2024 年市場價值達 37 億美元。其市場領先地位歸功於卓越的掃描能力、始終如一的精度以及跨各種設備架構的兼容性。這些感測器憑藉其可靠性和易於整合的特點,廣泛應用於個人和商業應用。由於對可擴展、經濟高效的解決方案的需求強勁,尤其是在價格敏感或資源受限的地區,區域感測器和觸控感測器仍然是首選。
2024年,行動和攜帶式指紋感應器市場規模達33億美元。其受歡迎程度源自於消費性電子、金融服務和政府部門對快速、便利識別日益成長的需求。這些緊湊型感測器已將身份驗證從靜態環境轉移到行動平台,支援從現場安全到基於應用程式的電子商務驗證等各種操作。
2024年,美國指紋感應器市場規模達7.962億美元。由於生物辨識技術在國防、執法和民用領域的廣泛應用,美國持續引領全球指紋感應器的普及。在公共安全現代化、邊境管理改進和數位身分識別項目方面的大量投資,鞏固了指紋感測器在國家安全戰略中的地位。目前,美國的國防和技術承包商正在將生物識別工具嵌入到安全通訊系統和用戶身份驗證設備中,從而將該技術的實用性擴展到傳統應用之外。
推動全球指紋感測器產業創新並塑造競爭格局的關鍵參與者包括 Synaptics Incorporated、神盾科技股份有限公司、深圳市匯頂科技有限公司和高通技術有限公司。指紋感測器領域的競爭公司正致力於透過技術創新實現產品差異化。他們正在投資先進的感測器技術,例如超音波和光學解決方案,以提高準確性和環境適應性。
與原始設備製造商 (OEM) 的策略合作正成為優先事項,旨在將感測器整合到更廣泛的終端設備中,例如智慧型穿戴裝置、汽車儀表板和門禁系統。此外,許多公司正在透過提供針對行動和基礎設施應用量身定做的經濟高效、可擴展的解決方案,進軍新興市場。智慧財產權保護和研發擴張對於維持技術優勢仍然至關重要,而參與生物辨識安全標準和合規框架則有助於增強信任和監管合規性。這些策略共同支持持續成長、提高市場滲透率和長期品牌權益。
目錄
第1章:方法論與範圍
第2章:執行摘要
第3章:行業洞察
- 產業生態系統分析
- 供應商格局
- 利潤率
- 成本結構
- 每個階段的增值
- 影響價值鏈的因素
- 中斷
- 產業衝擊力
- 成長動力
- 安全生物辨識認證需求不斷成長
- 感測器技術的進步
- 與物聯網(IOT)和智慧型設備的整合
- 政府措施和監管合規
- 消費者對便利性和使用者體驗的偏好
- 產業陷阱與挑戰
- 安全漏洞和欺騙風險
- 新興應用程式中的整合和相容性限制
- 成長動力
- 成長潛力分析
- 監管格局
- 北美洲
- 歐洲
- 亞太地區
- 拉丁美洲
- 中東和非洲
- 波特的分析
- PESTEL分析
- 技術和創新格局
- 當前的技術趨勢
- 新興技術
- 新興商業模式
- 合規性要求
- 永續性措施
- 消費者情緒分析
- 專利和智慧財產權分析
- 地緣政治與貿易動態
第4章:競爭格局
- 介紹
- 公司市佔率分析
- 按地區
- 北美洲
- 歐洲
- 亞太地區
- 市場集中度分析
- 按地區
- 關鍵參與者的競爭基準
- 財務績效比較
- 收入
- 利潤率
- 研發
- 產品組合比較
- 產品範圍廣度
- 科技
- 創新
- 地理位置比較
- 全球足跡分析
- 服務網路覆蓋
- 各地區市場滲透率
- 競爭定位矩陣
- 領導者
- 挑戰者
- 追蹤者
- 利基市場參與者
- 戰略展望矩陣
- 財務績效比較
- 2021-2024 年關鍵發展
- 併購
- 夥伴關係和合作
- 技術進步
- 擴張和投資策略
- 永續發展舉措
- 數位轉型舉措
- 新興/新創企業競爭對手格局
第5章:市場估計與預測:按感測器類型,2021 - 2034 年
- 主要趨勢
- 區域和觸控感應器
- 滑動感應器
第6章:市場估計與預測:依移動性,2021 - 2034 年
- 主要趨勢
- 固定/指紋掃描儀
- 移動/便攜
第7章:市場估計與預測:依最終用途,2021 - 2034 年
- 主要趨勢
- 個人
- 金融服務業
- 衛生保健
- 零售與電子商務
- 汽車
- 政府和國防
- 其他
第8章:市場估計與預測:按地區,2021 - 2034 年
- 主要趨勢
- 北美洲
- 美國
- 加拿大
- 歐洲
- 德國
- 英國
- 法國
- 西班牙
- 義大利
- 荷蘭
- 亞太地區
- 中國
- 印度
- 日本
- 澳洲
- 韓國
- 拉丁美洲
- 巴西
- 墨西哥
- 阿根廷
- 中東和非洲
- 沙烏地阿拉伯
- 南非
- 阿拉伯聯合大公國
第9章:公司簡介
- BioEnable
- Egis Technology Inc.
- Fingerprint Cards AB
- GigaDevice
- HID Global Corporation
- Holtek Semiconductor Inc.
- IDEX Biometrics ASA
- Mantra Softech
- Next Biometrics
- Qualcomm Technologies, Inc.
- SecuGen Corporation
- Shenzhen Goodix Technology Co., Ltd.
- SUPREMA
- Synaptics Incorporated
- Thales
- Xthings Inc.
The Global Fingerprint Sensor Market was valued at USD 4.2 billion in 2024 and is estimated to grow at a CAGR of 6.9% to reach USD 8.1 billion by 2034. This growth is primarily fueled by rising demand for secure biometric verification and increasing consumer inclination toward seamless authentication solutions. As digital security becomes more embedded in daily life, fingerprint sensors offer the ideal balance of convenience and reliability. Rapid advancements in sensor design and performance are enhancing the accuracy and adaptability of fingerprint authentication across industries.
The evolution from traditional capacitive technologies to more robust ultrasonic and optical sensors has eliminated common identification challenges such as wet or smudged fingertips. Ultrasonic fingerprint sensors, for instance, rely on sound wave mapping, delivering higher spoof resistance and precision. These technological improvements are unlocking new applications beyond smartphones, extending into smart cards, automotive systems, and high-security access control.
| Market Scope | |
|---|---|
| Start Year | 2024 |
| Forecast Year | 2025-2034 |
| Start Value | $4.2 billion |
| Forecast Value | $8.1 billion |
| CAGR | 6.9% |
Fingerprint technology is now being integrated into a wide array of consumer and commercial products, including laptops, payment terminals, door locks, and portable electronics. The ability to unlock devices or complete transactions with a simple touch aligns with growing expectations for speed, security, and privacy without complicating the user experience. Manufacturers are embracing this trend by embedding fingerprint sensors into next-gen electronics, driving widespread adoption.
Area and touch sensors segment dominated the market with a value of USD 3.7 billion in 2024. Their market lead is attributed to superior scanning capabilities, consistent accuracy, and compatibility across various device architectures. These sensors are widely used in both personal and commercial applications due to their reliability and ease of integration. With strong demand from industries that require scalable, cost-efficient solutions, particularly in price-sensitive or resource-constrained regions, area and touch sensors remain a top choice.
The mobile and portable fingerprint sensor segment generated USD 3.3 billion in 2024. Their popularity stems from the growing need for fast, on-the-go identification across consumer electronics, financial services, and government sectors. These compact sensors have transitioned authentication from static environments to mobile platforms, supporting operations ranging from field-based security to app-based e-commerce verification.
U.S. Fingerprint Sensor Market was valued at USD 796.2 million in 2024. The country continues to lead global adoption, supported by the widespread use of biometrics in defense, law enforcement, and civilian sectors. Significant investments in public safety modernization, border management enhancements, and digital ID initiatives have cemented the role of fingerprint sensors in national security strategies. US-based defense and tech contractors are now embedding biometric tools into secured communications systems and user-authenticated devices, expanding the technology's utility beyond conventional use cases.
Key players driving innovation and shaping the competitive landscape in the Global Fingerprint Sensor Industry include Synaptics Incorporated, Egis Technology Inc., Shenzhen Goodix Technology Co., Ltd., and Qualcomm Technologies, Inc. Companies competing in the fingerprint sensor space are focusing heavily on product differentiation through technological innovation. They are investing in advanced sensor technologies like ultrasonic and optical-based solutions to improve accuracy and environmental adaptability.
Strategic collaborations with OEMs are being prioritized to integrate sensors into a wider variety of end-use devices such as smart wearables, automotive dashboards, and access control systems. Additionally, many are expanding into emerging markets by offering cost-effective, scalable solutions tailored for mobile and infrastructure applications. Intellectual property protection and R&D expansion remain critical to maintaining a technological edge, while participation in biometric security standards and compliance frameworks enhances trust and regulatory alignment. Together, these strategies support sustained growth, increased market penetration, and long-term brand equity.
Table of Contents
Chapter 1 Methodology and Scope
- 1.1 Market scope and definitions
- 1.2 Research design
- 1.2.1 Research approach
- 1.2.2 Data collection methods
- 1.3 Data mining sources
- 1.3.1 Global
- 1.3.2 Regional
- 1.4 Base estimates and calculations
- 1.4.1 Base year calculation
- 1.4.2 Key trends for market estimation
- 1.5 Primary research and validation
- 1.5.1 Primary sources
- 1.6 Forecast model
- 1.7 Research assumptions and limitations
Chapter 2 Executive Summary
- 2.1 Industry 3600 synopsis
- 2.2 Key market trends
- 2.2.1 Sensor type trends
- 2.2.2 Mobility trends
- 2.2.3 End use trends
- 2.2.4 Regional
- 2.3 TAM Analysis, 2025-2034 (USD Million)
- 2.4 CXO perspectives: strategic imperatives
- 2.4.1 Executive decision points
- 2.4.2 Critical success factors
- 2.5 Future outlook and strategic recommendations
Chapter 3 Industry Insights
- 3.1 Industry ecosystem analysis
- 3.1.1 Supplier landscape
- 3.1.2 Profit margin
- 3.1.3 Cost structure
- 3.1.4 Value addition at each stage
- 3.1.5 Factor affecting the value chain
- 3.1.6 Disruptions
- 3.2 Industry impact forces
- 3.2.1 Growth drivers
- 3.2.1.1 Rising demand for secure biometric authentication
- 3.2.1.2 Advancements in sensor technology
- 3.2.1.3 Integration with internet of things (IOT) and smart devices
- 3.2.1.4 Government initiatives and regulatory compliance
- 3.2.1.5 Consumer preference for convenience and user experience
- 3.2.2 Industry pitfalls and challenges
- 3.2.2.1 Security vulnerabilities and spoofing risks
- 3.2.2.2 Integration and compatibility limitations in emerging applications
- 3.2.1 Growth drivers
- 3.3 Growth potential analysis
- 3.4 Regulatory landscape
- 3.4.1 North America
- 3.4.2 Europe
- 3.4.3 Asia Pacific
- 3.4.4 Latin America
- 3.4.5 Middle East & Africa
- 3.5 Porter's analysis
- 3.6 PESTEL analysis
- 3.7 Technology and innovation landscape
- 3.7.1 Current technological trends
- 3.7.2 Emerging technologies
- 3.8 Emerging business models
- 3.9 Compliance requirements
- 3.10 Sustainability measures
- 3.11 Consumer sentiment analysis
- 3.12 Patent and IP analysis
- 3.13 Geopolitical and trade dynamics
Chapter 4 Competitive Landscape, 2024
- 4.1 Introduction
- 4.2 Company market share analysis
- 4.2.1 By region
- 4.2.1.1 North America
- 4.2.1.2 Europe
- 4.2.1.3 Asia Pacific
- 4.2.2 Market concentration analysis
- 4.2.1 By region
- 4.3 Competitive benchmarking of key players
- 4.3.1 Financial performance comparison
- 4.3.1.1 Revenue
- 4.3.1.2 Profit margin
- 4.3.1.3 R&D
- 4.3.2 Product portfolio comparison
- 4.3.2.1 Product range breadth
- 4.3.2.2 Technology
- 4.3.2.3 Innovation
- 4.3.3 Geographic presence comparison
- 4.3.3.1 Global footprint analysis
- 4.3.3.2 Service network coverage
- 4.3.3.3 Market penetration by region
- 4.3.4 Competitive positioning matrix
- 4.3.4.1 Leaders
- 4.3.4.2 Challengers
- 4.3.4.3 Followers
- 4.3.4.4 Niche players
- 4.3.5 Strategic outlook matrix
- 4.3.1 Financial performance comparison
- 4.4 Key developments, 2021-2024
- 4.4.1 Mergers and acquisitions
- 4.4.2 Partnerships and collaborations
- 4.4.3 Technological advancements
- 4.4.4 Expansion and investment strategies
- 4.4.5 Sustainability initiatives
- 4.4.6 Digital transformation initiatives
- 4.5 Emerging/ startup competitors landscape
Chapter 5 Market Estimates and Forecast, By Sensor Type, 2021 - 2034 (USD Million)
- 5.1 Key trends
- 5.2 Area & touch sensors
- 5.3 Swipe sensors
Chapter 6 Market Estimates and Forecast, By Mobility, 2021 - 2034 (USD Million)
- 6.1 Key trends
- 6.2 Fixed/fingerprint scanners
- 6.3 Mobile/portable
Chapter 7 Market Estimates and Forecast, By End Use, 2021 - 2034 (USD Million)
- 7.1 Key trends
- 7.2 Individual
- 7.3 BFSI
- 7.4 Healthcare
- 7.5 Retail & e-commerce
- 7.6 Automotive
- 7.7 Government & defense
- 7.8 Others
Chapter 8 Market Estimates and Forecast, By Region, 2021 - 2034 (USD Million)
- 8.1 Key trends
- 8.2 North America
- 8.2.1 U.S.
- 8.2.2 Canada
- 8.3 Europe
- 8.3.1 Germany
- 8.3.2 UK
- 8.3.3 France
- 8.3.4 Spain
- 8.3.5 Italy
- 8.3.6 Netherlands
- 8.4 Asia Pacific
- 8.4.1 China
- 8.4.2 India
- 8.4.3 Japan
- 8.4.4 Australia
- 8.4.5 South Korea
- 8.5 Latin America
- 8.5.1 Brazil
- 8.5.2 Mexico
- 8.5.3 Argentina
- 8.6 Middle East and Africa
- 8.6.1 Saudi Arabia
- 8.6.2 South Africa
- 8.6.3 UAE
Chapter 9 Company Profiles
- 9.1 BioEnable
- 9.2 Egis Technology Inc.
- 9.3 Fingerprint Cards AB
- 9.4 GigaDevice
- 9.5 HID Global Corporation
- 9.6 Holtek Semiconductor Inc.
- 9.7 IDEX Biometrics ASA
- 9.8 Mantra Softech
- 9.9 Next Biometrics
- 9.10 Qualcomm Technologies, Inc.
- 9.11 SecuGen Corporation
- 9.12 Shenzhen Goodix Technology Co., Ltd.
- 9.13 SUPREMA
- 9.14 Synaptics Incorporated
- 9.15 Thales
- 9.16 Xthings Inc.
 指紋感應器市場:依技術、產品、外形規格及應用分類-2026-2032年全球市場預測矽基指紋感測器市場:按感測器類型、嵌入式類型、應用、最終用戶和銷售管道分類-2026-2032年全球市場預測
 指紋感應器市場分析及預測(至2035年):依類型、產品類型、技術、組件、應用、最終用戶、模組、功能及安裝類型分類
 2026年全球指紋感應器市場報告
 指紋感應器市場 - 全球產業規模、佔有率、趨勢、機會、預測:按類型、技術、應用、地區和競爭格局分類,2021-2031年
 日本指紋感應器市場報告(按類型、技術、應用和地區分類,2026-2034年)
 指紋感應器市場規模、佔有率及成長分析(按類型、技術、應用、最終用戶和地區分類)-2026-2033年產業預測
 指紋感測器市場:2035年前的產業趨勢和全球預測 - 指紋感測器類別,各技術類型,應用ipu,類別企業,各地區
 指紋感測器:市場佔有率分析、行業趨勢、統計數據和成長預測(2025-2030 年)
 到 2030 年指紋感應器市場預測:按產品、材料、功能、技術、應用和地區進行的全球分析