


 |
市場調查報告書
商品編碼
1773220
微灌系統市場機會、成長動力、產業趨勢分析及 2025 - 2034 年預測Micro-irrigation System Market Opportunity, Growth Drivers, Industry Trend Analysis, and Forecast 2025 - 2034 |
||||||
2024年,全球微灌系統市場規模達99億美元,預計2034年將以9.7%的複合年成長率成長,達到251億美元。由於全球人口成長和對糧食安全的日益擔憂,對這些系統的需求持續成長。隨著水資源在農業中日益稀缺,微灌提供了一個有效的解決方案,可以滿足不同氣候條件下的作物需求。無論在乾旱地區或濕潤地區,微灌都發揮著至關重要的作用,它既可以在乾旱地區種植作物,又可以在季節性降水不足時補充自然降雨。這種方法不僅有助於維持作物的穩定產量,還能顯著提高農業生產力和獲利能力,這在全球人均耕地面積持續減少的背景下尤其重要。
將水直接輸送到植物根區,可以最大限度地減少水資源浪費,同時最大限度地提高作物產量。隨著農民面臨提高效率、節約用水和改善土壤健康的壓力,採用微灌技術已成為越來越有吸引力的選擇。這些系統減少了體力勞動,降低了能源消耗,並支持更永續的農業實踐。隨著全球農業利害關係人紛紛採用現代灌溉技術,在經濟和環境誘因的雙重驅動下,市場規模持續擴大。此外,政府推廣節水農業的舉措也進一步加速了該產業的成長,尤其是在易受乾旱或淡水供應不足的地區。
| 市場範圍 | |
|---|---|
| 起始年份 | 2024 |
| 預測年份 | 2025-2034 |
| 起始值 | 99億美元 |
| 預測值 | 251億美元 |
| 複合年成長率 | 9.7% |
2024年,噴灌系統在系統類型方面佔據市場領先地位,創造了56億美元的收入,預計在預測期內的複合年成長率為10.1%。該系統因其多功能性和廣泛適用於各種作物而受到青睞。另一方面,滴灌技術的創新實現了更精細的控制,使農民能夠根據特定作物需求和氣候條件靈活地調整灌溉時間表、灌溉時間和流量。這些進步提高了灌溉的可靠性和精準度,使種植者能夠同時最佳化產量並節省資源。
現代滴灌系統如今整合了感測器技術,可以追蹤關鍵的環境和土壤指標。這些感測器有助於監測土壤濕度、天氣變化和作物狀況,使農民能夠微調灌溉用水。無論是有線還是無線,這些感測器系統通常連接到中央控制器或雲端平台,從而簡化即時資料收集和決策。這種整合減少了灌溉中的不確定性,幫助農民在最少的人為干預下提高效率和作物健康。
從最終用途來看,農民群體在2024年佔據市場主導地位,佔總收入的48%,預計到2034年將以10.2%的複合年成長率成長。成本控制仍然是大田作物生產者的關鍵因素,這將繼續推動微灌的轉型。這些系統與小型和大型農場的營運目標高度契合,透過減少用水量和提高作物均勻度,可以實現長期成本節約。
就配銷通路而言,間接銷售在2024年引領市場,預計在分析期間內將維持超過10.1%的複合年成長率。農民嚴重依賴當地經銷商、零售商和線上平台來取得灌溉設備,尤其是在發展中地區。這些間接管道提供更廣泛的可及性和客製化支持,使其成為銷售生態系統的重要組成部分。此外,數位商務的日益普及使製造商能夠滲透到新市場,並將業務範圍擴展到服務不足的地區,從而進一步促進了透過間接管道的銷售。
雖然間接銷售仍占主導地位,但直銷也正逐漸受到青睞。這種方式使生產商能夠直接與最終用戶互動,並提供客製化解決方案、技術支援和具有競爭力的價格。越來越多的製造商傾向於採用直接互動策略,以建立更牢固的客戶關係並提供更優質的售後服務。
2024年,美國仍是微灌系統市場的領先國家,貢獻了22億美元的收入,佔據北美總市場佔有率的84%。在技術進步和區域政策措施的支持下,美國的灌溉基礎設施得到了顯著發展。種植模式的轉變和對更高用水效率的需求持續推動著微灌系統的採用。雖然灌溉的整體強度可能因各種區域因素而波動,但重點始終是透過更有效率的系統來提高生產力。
在競爭格局中,一些知名企業正積極透過收購、產能擴張和合作來鞏固自身地位。 Adritec Europe、Netafim、Lindsay、Rivulis 和 Toro 等公司合計佔約 8% 至 12% 的市佔率。這些行業領導者持續投資於創新和策略合作,以豐富產品組合併擴大客戶覆蓋範圍。
目錄
第1章:方法論與範圍
第2章:執行摘要
第3章:行業洞察
- 產業生態系統分析
- 供應商格局
- 利潤率
- 每個階段的增值
- 影響價值鏈的因素
- 產業衝擊力
- 成長動力
- 產業陷阱與挑戰
- 機會
- 成長潛力分析
- 未來市場趨勢
- 技術和創新格局
- 當前的技術趨勢
- 新興技術
- 價格趨勢
- 按地區
- 依系統類型
- 監管格局
- 標準和合規性要求
- 區域監理框架
- 認證標準
- 波特的分析
- PESTEL分析
第4章:競爭格局
- 介紹
- 公司市佔率分析
- 按地區
- 公司矩陣分析
- 主要市場參與者的競爭分析
- 競爭定位矩陣
- 關鍵進展
- 併購
- 夥伴關係與合作
- 新產品發布
- 擴張計劃
第5章:市場估計與預測:按系統類型,2021 - 2034 年
- 主要趨勢
- 滴灌系統
- 地面滴灌
- 地下滴灌
- 家庭點滴
- 線上滴灌
- 其他(線上滴灌等)
- 噴灌系統
- 中心樞軸
- 牽引式樞軸
- 雨槍
- 衝擊式噴頭
- 彈出式灑水器
- 其他(直線移動噴頭等)
- 其他(起泡器、噴灌等)
第6章:市場估計與預測:按應用,2021 - 2034 年
- 主要趨勢
- 大田作物
- 風景
- 容器園藝
- 小規模農業
- 其他(室內植物等)
第7章:市場估計與預測:依最終用途,2021 - 2034 年
- 主要趨勢
- 農民
- 企業農場
- 政府機構
- 其他(工業用戶等)
第8章:市場估計與預測:按配銷通路,2021 - 2034 年
- 主要趨勢
- 直銷
- 間接銷售
第9章:市場估計與預測:按地區,2021 - 2034 年
- 主要趨勢
- 北美洲
- 美國
- 加拿大
- 歐洲
- 德國
- 英國
- 法國
- 西班牙
- 義大利
- 荷蘭
- 亞太地區
- 中國
- 日本
- 印度
- 澳洲
- 韓國
- 拉丁美洲
- 巴西
- 墨西哥
- 阿根廷
- MEA
- 南非
- 沙烏地阿拉伯
- 阿拉伯聯合大公國
第10章:公司簡介
- Adritec Europe
- Automat Industries
- Captain Polyplast
- Ecoflo India
- Hunter
- Jain Irrigation Systems
- Lindsay
- N-Drip
- Netafim
- Novagric
- Rain Bird Corporation
- Rivulis
- TL Irrigation
- Toro
- Valmont
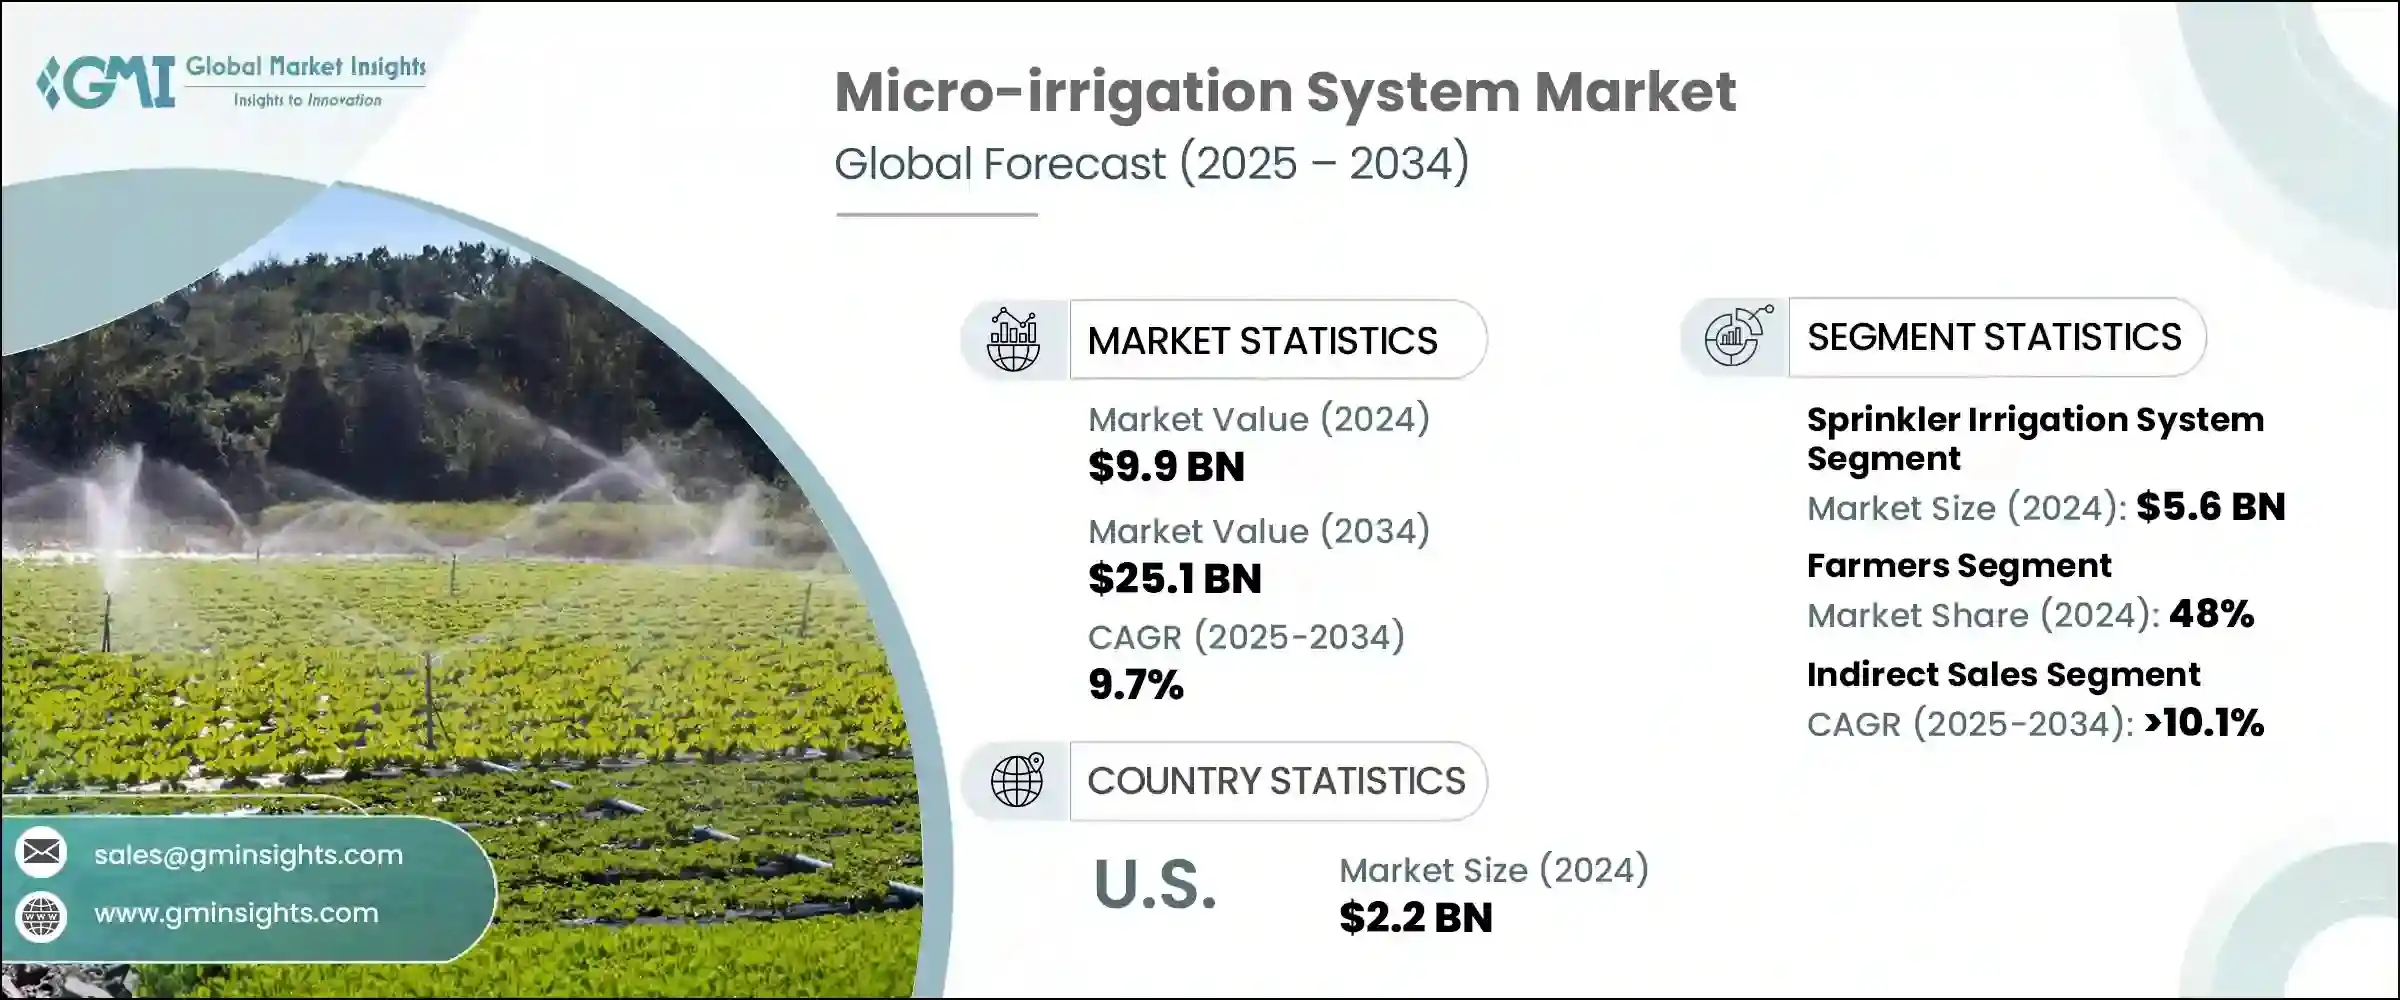
The Global Micro-irrigation System Market was valued at USD 9.9 billion in 2024 and is estimated to grow at a CAGR of 9.7% to reach USD 25.1 billion by 2034. Demand for these systems continues to rise due to the growing global population and increasing concern over food security. As water becomes a more limited resource in agriculture, micro-irrigation offers an efficient solution to meet crop requirements across varying climate conditions. In both dry and humid regions, micro-irrigation plays a vital role, either enabling crop cultivation in arid areas or supplementing natural rainfall when seasonal precipitation is inadequate. This method not only helps maintain consistent crop yields but also significantly improves agricultural productivity and profitability, which is particularly essential as arable land per capita continues to shrink globally.
The ability to deliver water directly to the root zone of plants ensures minimal water waste while maximizing crop output. As pressure mounts on farmers to increase efficiency, conserve water, and enhance soil health, the adoption of micro-irrigation technologies has become an increasingly attractive choice. These systems reduce manual labor, lower energy usage, and support more sustainable farming practices. With agricultural stakeholders worldwide embracing modern irrigation techniques, the market continues to expand, driven by both economic and environmental incentives. Additionally, government initiatives promoting water-efficient farming are further accelerating industry growth, especially in regions prone to drought or limited freshwater availability.
| Market Scope | |
|---|---|
| Start Year | 2024 |
| Forecast Year | 2025-2034 |
| Start Value | $9.9 Billion |
| Forecast Value | $25.1 Billion |
| CAGR | 9.7% |
In 2024, the sprinkler irrigation system led the market by system type, generating USD 5.6 billion in revenue, and is projected to grow at a CAGR of 10.1% over the forecast period. This system is preferred for its versatility and broad application across various crop types. On the other hand, technological innovations in drip irrigation are allowing for more granular control, giving farmers the flexibility to adjust irrigation schedules, duration, and flow rates based on specific crop needs and climatic conditions. These advancements have enhanced the reliability and precision of irrigation, allowing growers to optimize yields and conserve resources simultaneously.
Modern drip systems now integrate sensor technologies that track key environmental and soil metrics. These sensors help monitor soil moisture, weather changes, and plant conditions, enabling farmers to fine-tune water applications. Whether wired or wireless, these sensor systems often link to central controllers or cloud-based platforms, streamlining data collection and decision-making in real time. Such integration reduces guesswork in irrigation, helping farmers improve efficiency and crop health with minimal human intervention.
Based on end use, the farmer segment dominated the market in 2024, accounting for 48% of the total revenue, and is projected to expand at a CAGR of 10.2% through 2034. Cost control remains a critical factor among field crop producers, which continues to drive the shift toward micro-irrigation. These systems align well with the operational goals of small and large-scale farms alike, offering long-term cost savings through reduced water consumption and improved crop uniformity.
In terms of distribution channel, indirect sales led the market in 2024 and are forecasted to maintain a CAGR exceeding 10.1% during the analysis period. Farmers heavily rely on local distributors, retailers, and online platforms to access irrigation equipment, especially in developing regions. These indirect channels provide wider accessibility and tailored support, making them a vital part of the sales ecosystem. Additionally, the rising adoption of digital commerce has allowed manufacturers to penetrate new markets and extend their reach to underserved areas, further boosting sales through indirect routes.
While indirect sales dominate, direct sales are gradually gaining traction. This approach allows producers to engage directly with end-users and offer customized solutions, technical assistance, and competitive pricing. More manufacturers are leaning toward direct engagement strategies to build stronger customer relationships and provide enhanced after-sales service.
The United States remained the leading country in the micro-irrigation system market in 2024, contributing USD 2.2 billion in revenue and commanding 84% of the total North American share. The country's irrigation infrastructure has evolved significantly, supported by technological advancements and regional policy initiatives. Shifting cropping patterns and the need for higher water-use efficiency continue to drive adoption. While the overall intensity of irrigation may fluctuate due to various regional factors, the focus remains firmly on improving productivity through more efficient systems.
The competitive landscape features several prominent players who are actively working to strengthen their positions through acquisitions, capacity expansions, and partnerships. Companies such as Adritec Europe, Netafim, Lindsay, Rivulis, and Toro together hold a combined market share of approximately 8% to 12%. These industry leaders continue to invest in innovation and strategic collaborations to diversify their product portfolios and increase customer reach.
Table of Contents
Chapter 1 Methodology and scope
- 1.1 Market scope and definition
- 1.2 Research design
- 1.2.1 Research approach
- 1.2.2 Data collection methods
- 1.3 Data mining sources
- 1.3.1 Global
- 1.3.2 Regional/country
- 1.4 Base estimates and calculations
- 1.4.1 Base year calculation
- 1.4.2 Key trends for market estimation
- 1.5 Primary research and validation
- 1.5.1 Primary sources
- 1.6 Forecast model
- 1.7 Research assumptions and limitations
Chapter 2 Executive summary
- 2.1 Industry 3600 synopsis
- 2.2 Key market trends
- 2.2.1 By regional
- 2.2.2 By system type
- 2.2.3 By application
- 2.2.4 By end use
- 2.2.5 By distribution channel
- 2.3 CXO perspectives: strategic imperatives
- 2.3.1 Key decision points for industry executives
- 2.3.2 Critical success factors for market players
- 2.4 Future outlook and strategic recommendations
Chapter 3 Industry insights
- 3.1 Industry ecosystem analysis
- 3.1.1 Supplier landscape
- 3.1.2 Profit margin
- 3.1.3 Value addition at each stage
- 3.1.4 Factor affecting the value chain
- 3.2 Industry impact forces
- 3.2.1 Growth drivers
- 3.2.2 Industry pitfalls & challenges
- 3.2.3 Opportunities
- 3.3 Growth potential analysis
- 3.4 Future market trends
- 3.5 Technology and innovation landscape
- 3.5.1 Current technological trends
- 3.5.2 Emerging technologies
- 3.6 Price trends
- 3.6.1 By region
- 3.6.2 By system type
- 3.7 Regulatory landscape
- 3.7.1 Standards and compliance requirements
- 3.7.2 Regional regulatory frameworks
- 3.7.3 Certification standards
- 3.8 Porter's analysis
- 3.9 PESTEL analysis
Chapter 4 Competitive landscape, 2024
- 4.1 Introduction
- 4.2 Company market share analysis
- 4.2.1 By region
- 4.2.1.1 North America
- 4.2.1.2 Europe
- 4.2.1.3 Asia Pacific
- 4.2.1.4 Latin America
- 4.2.1.5 MEA
- 4.2.1 By region
- 4.3 Company matrix analysis
- 4.4 Competitive analysis of major market players
- 4.5 Competitive positioning matrix
- 4.6 Key developments
- 4.6.1 Mergers & acquisitions
- 4.6.2 Partnerships & collaborations
- 4.6.3 New product launches
- 4.6.4 Expansion plans
Chapter 5 Market Estimates & Forecast, By System Type, 2021 - 2034 ($Billion, Million Units)
- 5.1 Key trends
- 5.2 Drip irrigation system
- 5.2.1 Surface drip irrigation
- 5.2.2 Sub-surface drip irrigation
- 5.2.3 Family drip
- 5.2.4 In-line drip
- 5.2.5 Others (online drip etc.)
- 5.3 Sprinkler irrigation system
- 5.3.1 Centre pivot
- 5.3.2 Towable pivot
- 5.3.3 Rain gun
- 5.3.4 Impact sprinkler
- 5.3.5 Pop up sprinkler
- 5.3.6 Others (linear move sprinkler etc.)
- 5.4 Others (bubbler, spray irrigation etc.)
Chapter 6 Market Estimates & Forecast, By Application, 2021 - 2034 ($Billion, Million Units)
- 6.1 Key trends
- 6.2 Field crops
- 6.3 Landscapes
- 6.4 Container gardening
- 6.5 Small-scale farming
- 6.6 Others (indoor plants etc.)
Chapter 7 Market Estimates & Forecast, By End Use, 2021 - 2034 ($Billion, Million Units)
- 7.1 Key trends
- 7.2 Farmers
- 7.3 Corporate farms
- 7.4 Government agencies
- 7.5 Others (industrial users etc.)
Chapter 8 Market Estimates & Forecast, By Distribution Channel, 2021 - 2034 ($Billion, Million Units)
- 8.1 Key trends
- 8.2 Direct sales
- 8.3 Indirect sales
Chapter 9 Market Estimates & Forecast, By Region, 2021 - 2034 ($Billion, Million Units)
- 9.1 Key trends
- 9.2 North America
- 9.2.1 U.S.
- 9.2.2 Canada
- 9.3 Europe
- 9.3.1 Germany
- 9.3.2 UK
- 9.3.3 France
- 9.3.4 Spain
- 9.3.5 Italy
- 9.3.6 Netherlands
- 9.4 Asia Pacific
- 9.4.1 China
- 9.4.2 Japan
- 9.4.3 India
- 9.4.4 Australia
- 9.4.5 South Korea
- 9.5 Latin America
- 9.5.1 Brazil
- 9.5.2 Mexico
- 9.5.3 Argentina
- 9.6 MEA
- 9.6.1 South Africa
- 9.6.2 Saudi Arabia
- 9.6.3 UAE
Chapter 10 Company Profiles
- 10.1 Adritec Europe
- 10.2 Automat Industries
- 10.3 Captain Polyplast
- 10.4 Ecoflo India
- 10.5 Hunter
- 10.6 Jain Irrigation Systems
- 10.7 Lindsay
- 10.8 N-Drip
- 10.9 Netafim
- 10.10 Novagric
- 10.11 Rain Bird Corporation
- 10.12 Rivulis
- 10.13 T-L Irrigation
- 10.14 Toro
- 10.15 Valmont
 2026年全球微灌系統市場報告
 全球微灌系統市場規模、佔有率、趨勢和成長分析報告(2026-2034年)
 微灌系統市場報告:按類型、作物類型、最終用戶和地區分類(2026-2034 年)
 微灌系統市場-全球產業規模、佔有率、趨勢、機會與預測:按類型、作物類型、地區和競爭格局分類,2021-2031年
 微灌系統市場規模、佔有率及成長分析(按類型、作物類型、最終用戶和地區分類)-2026-2033年產業預測
 微型灌溉系統市場按作物類型、系統類型、組件、應用、最終用戶、配銷通路和安裝階段分類 - 全球預測 2025-2032
 全球微灌溉系統市場:2032 年預測 - 按類型、組件、作物類型、分銷管道、栽培技術、最終用戶和地區進行分析
 微灌溉系統市場:各類型,各作物類型,各終端用戶,各地區,機會,預測,2017年~2031年