


 |
市場調查報告書
商品編碼
1766359
自備氫氣發電市場機會、成長動力、產業趨勢分析及 2025 - 2034 年預測Captive Hydrogen Generation Market Opportunity, Growth Drivers, Industry Trend Analysis, and Forecast 2025 - 2034 |
||||||
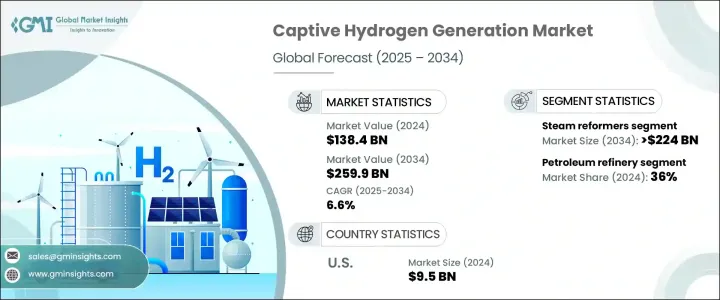
2024 年全球自備製氫市場規模達 1,384 億美元,預計到 2034 年將以 6.6% 的複合年成長率成長,達到 2,599 億美元。向永續能源實踐的轉變和日益成長的脫碳動力,正鼓勵各行各業採用現場製氫解決方案。這一趨勢在煉油、化工和運輸等關鍵產業尤為突出,這些產業對更清潔、更有效率的燃料替代品的需求日益成長。隨著全球各行各業致力於減少溫室氣體排放,自備氫氣系統的角色變得更加關鍵。清潔氫氣生產技術的進步透過提高可擴展性、降低營運成本和提高整體系統效率,促進了這一發展勢頭,使現場氫氣生產成為對工業用戶越來越有吸引力的選擇。
隨著氫氣需求穩定成長,尤其是在需要高純度燃料的製程中,市場預計將受益於對緊湊型和模組化系統的大量投資。這些系統具有安裝靈活性,可根據不同的生產能力進行客製化,這對於尋求減少對外部氫氣供應商依賴的中型工廠尤其具有吸引力。除了技術進步之外,政府的支持政策也在加速成長。稅收減免、補助和碳定價機制等激勵措施正在幫助工業企業透過抵消前期資本成本,向更清潔的燃料解決方案轉型。自備氫氣生產也在更廣泛的淨零排放議程中發揮戰略作用,可靠的本地化燃料生產與長期能源目標一致。所有這些因素共同為全球市場的強勁成長奠定了基礎。
| 市場範圍 | |
|---|---|
| 起始年份 | 2024 |
| 預測年份 | 2025-2034 |
| 起始值 | 1384億美元 |
| 預測值 | 2599億美元 |
| 複合年成長率 | 6.6% |
市場依製程分為蒸汽重整、電解和其他技術。其中,蒸汽重整器佔據主導地位,預計到2034年將創造超過2,240億美元的市場價值。該製程因其能夠高效、大規模地將天然氣等碳氫化合物原料轉化為氫氣而廣受青睞。工業界對高產氫氣的持續偏好,加上現有的蒸汽重整基礎設施,繼續增強了該領域的吸引力。此外,蒸汽重整器與煉油等行業現有能源系統的兼容性,進一步促進了其廣泛應用,確保了整個預測期內的持續需求。
從應用角度來看,自備製氫市場細分為石油煉油廠、化學加工、金屬和其他工業領域。石油煉油廠在2024年佔據市場主導地位,市佔率達36%,預計到2034年,其複合年成長率將超過6.3%。這一成長源於對可靠且經濟高效的氫氣供應的需求,以支持加氫裂解和脫硫等製程。煉油廠擴大採用現場氫氣生產解決方案,以降低物流成本並提高能源可靠性。向內部燃料生產的過渡有助於降低供應中斷帶來的風險,同時符合減排目標。自備製氫為煉油廠提供了戰略優勢,使其能夠在控制成本和合規性的同時保持生產連續性。
從地區來看,美國正成為全球市場的強大貢獻者,其估值在 2022 年為 90 億美元,2023 年為 92 億美元,2024 年為 95 億美元。 2024 年,北美約佔全球市場佔有率的 9%,隨著清潔能源的加速普及,預計這一比例將上升。美國市場受益於多個產業尋求降低能源成本和提高營運效率的需求成長。為此,國內企業正在開發能夠按需生產氫氣以滿足各種最終用途的先進系統。發電機設計的創新使更緊湊、更可擴展的解決方案成為可能,鼓勵在商業和工業環境中更廣泛地部署。同時,對氫氣生產和儲存基礎設施的資本投資不斷增加,為該地區的長期產業成長鋪平了道路。
自備製氫領域的領導企業專注於永續性、效率和適應性,以滿足不斷變化的行業需求。這些公司正投入資源開發創新技術,並加強其全球影響力。他們積極尋求新的商業機會,推出先進系統,拓展新興市場,並建立合作夥伴關係,以加速清潔氫能解決方案的部署。隨著現場製氫需求的預期成長,產業領導者已具備策略優勢,有望從未來的市場發展中獲益。
目錄
第1章:方法論與範圍
第2章:執行摘要
第3章:行業洞察
- 產業生態系統
- 川普政府關稅分析
- 對貿易的影響
- 貿易量中斷
- 報復措施
- 對產業的影響
- 供應方影響(原料)
- 主要材料價格波動
- 供應鏈重組
- 生產成本影響
- 需求面影響(售價)
- 價格傳導至終端市場
- 市佔率動態
- 消費者反應模式
- 供應方影響(原料)
- 受影響的主要公司
- 策略產業反應
- 供應鏈重組
- 定價和產品策略
- 政策參與
- 展望與未來考慮
- 對貿易的影響
- 監管格局
- 產業衝擊力
- 成長動力
- 產業陷阱與挑戰
- 成長潛力分析
- 波特的分析
- PESTEL分析
第4章:競爭格局
- 介紹
- 公司市佔率
- 戰略儀表板
- 策略舉措
- 競爭基準測試
- 創新與永續發展格局
第5章:市場規模及預測:依工藝,2021 年至 2034 年
- 主要趨勢
- 蒸氣重整器
- 電解
- 其他
第6章:市場規模及預測:依應用,2021 年至 2034 年
- 主要趨勢
- 石油煉油廠
- 化學
- 金屬
- 其他
第7章:市場規模及預測:依地區,2021 年至 2034 年
- 主要趨勢
- 北美洲
- 美國
- 加拿大
- 墨西哥
- 歐洲
- 德國
- 義大利
- 荷蘭
- 俄羅斯
- 亞太地區
- 中國
- 印度
- 日本
- 中東和非洲
- 沙烏地阿拉伯
- 伊朗
- 阿拉伯聯合大公國
- 南非
- 拉丁美洲
- 巴西
- 阿根廷
- 智利
第8章:公司簡介
- Air Products and Chemicals
- Cummins
- Enapter
- Hitachi Zosen Corporation
- HoSt Group
- Linde
- McPhy Energy
- Messer Group
- NEL Hydrogen
- NEXT Hydrogen
- Siemens Energy
- Teledyne Energy Systems
The Global Captive Hydrogen Generation Market was valued at USD 138.4 billion in 2024 and is estimated to grow at a CAGR of 6.6% to reach USD 259.9 billion by 2034. The transition toward sustainable energy practices and the increasing push for decarbonization are encouraging industries to adopt on-site hydrogen production solutions. This trend is especially prominent across key sectors like refining, chemicals, and transportation, where the demand for cleaner, more efficient fuel alternatives is gaining traction. As global industries aim to reduce greenhouse gas emissions, the role of captive hydrogen systems has become more pivotal. Advancements in clean hydrogen production technology are contributing to this momentum by enhancing scalability, lowering operational costs, and boosting overall system efficiency, making on-site generation an increasingly attractive option for industrial users.
With demand for hydrogen steadily rising, particularly for use in processes that require high-purity fuel, the market is expected to benefit from significant investments in compact and modular systems. These systems offer installation flexibility and can be tailored to varying production capacities, which is particularly appealing for medium-sized facilities seeking to reduce reliance on external hydrogen suppliers. In addition to technological evolution, supportive government policies are amplifying growth. Incentives like tax breaks, grants, and carbon pricing mechanisms are helping industrial players transition toward cleaner fuel solutions by offsetting upfront capital costs. Captive hydrogen generation is also playing a strategic role in broader net-zero emissions agendas, where reliable and localized fuel production aligns with long-term energy goals. Collectively, these factors are laying the groundwork for robust growth across global markets.
| Market Scope | |
|---|---|
| Start Year | 2024 |
| Forecast Year | 2025-2034 |
| Start Value | $138.4 Billion |
| Forecast Value | $259.9 Billion |
| CAGR | 6.6% |
The market is categorized by process into steam reforming, electrolysis, and other technologies. Among these, steam reformers hold a dominant position and are anticipated to generate over USD 224 billion by 2034. This process is widely favored due to its ability to convert hydrocarbon feedstocks such as natural gas into hydrogen efficiently and at scale. The ongoing industrial preference for high-yield hydrogen generation, combined with the availability of established infrastructure for steam reforming, continues to strengthen the segment's appeal. Additionally, the compatibility of steam reformers with existing energy systems in industries like refining further contributes to its widespread adoption, ensuring sustained demand throughout the forecast period.
In terms of application, the captive hydrogen generation market is segmented into petroleum refineries, chemical processing, metals, and other industrial domains. Petroleum refineries led the market in 2024 with a 36% share and are forecast to grow at a CAGR exceeding 6.3% through 2034. This growth is driven by the need for a dependable and cost-efficient hydrogen supply to support operations like hydrocracking and desulfurization. Refineries are increasingly turning to on-site hydrogen solutions to cut logistics costs and enhance energy reliability. The transition toward in-house fuel generation helps mitigate risks associated with supply disruptions while aligning with emissions reduction targets. Captive generation offers a strategic edge for refiners aiming to maintain production continuity while managing expenses and regulatory compliance.
Regionally, the United States is emerging as a strong contributor to the global market, with valuations of USD 9 billion in 2022, USD 9.2 billion in 2023, and USD 9.5 billion in 2024. North America accounted for approximately 9% of the global market share in 2024, and this proportion is expected to increase as clean energy adoption accelerates. The U.S. market is benefiting from increased demand across multiple sectors seeking to reduce energy costs and improve operational efficiency. In response, domestic firms are developing advanced systems capable of producing hydrogen on demand for various end-use applications. Innovations in generator design are enabling more compact and scalable solutions, encouraging broader deployment in commercial and industrial settings. At the same time, growing capital investment in hydrogen production and storage infrastructure is paving the way for long-term industry growth in the region.
Leading companies in the captive hydrogen generation space are focused on sustainability, efficiency, and adaptability to meet evolving industrial requirements. These firms are dedicating resources to develop innovative technologies and strengthen their global footprint. They are actively pursuing new business opportunities by launching advanced systems, expanding into emerging regions, and forming partnerships aimed at accelerating the deployment of clean hydrogen solutions. With demand for on-site generation expected to rise, industry leaders are strategically positioned to benefit from future market developments.
Table of Contents
Chapter 1 Methodology & Scope
- 1.1 Research design
- 1.2 Base estimates & calculations
- 1.3 Forecast model
- 1.4 Primary research & validation
- 1.4.1 Primary sources
- 1.4.2 Data mining sources
- 1.5 Market definitions
Chapter 2 Executive Summary
- 2.1 Industry synopsis, 2021 – 2034
Chapter 3 Industry Insights
- 3.1 Industry ecosystem
- 3.2 Trump administration tariff analysis
- 3.2.1 Impact on trade
- 3.2.1.1 Trade volume disruptions
- 3.2.1.2 Retaliatory measures
- 3.2.2 Impact on the industry
- 3.2.2.1 Supply-side impact (raw materials)
- 3.2.2.1.1 Price volatility in key materials
- 3.2.2.1.2 Supply chain restructuring
- 3.2.2.1.3 Production cost implications
- 3.2.2.2 Demand-side impact (selling price)
- 3.2.2.2.1 Price transmission to end markets
- 3.2.2.2.2 Market share dynamics
- 3.2.2.2.3 Consumer response patterns
- 3.2.2.1 Supply-side impact (raw materials)
- 3.2.3 Key companies impacted
- 3.2.4 Strategic industry responses
- 3.2.4.1 Supply chain reconfiguration
- 3.2.4.2 Pricing and product strategies
- 3.2.4.3 Policy engagement
- 3.2.5 Outlook and future considerations
- 3.2.1 Impact on trade
- 3.3 Regulatory landscape
- 3.4 Industry impact forces
- 3.4.1 Growth drivers
- 3.4.2 Industry pitfalls & challenges
- 3.5 Growth potential analysis
- 3.6 Porter's analysis
- 3.6.1 Bargaining power of suppliers
- 3.6.2 Bargaining power of buyers
- 3.6.3 Threat of new entrants
- 3.6.4 Threat of substitutes
- 3.7 PESTEL analysis
Chapter 4 Competitive landscape, 2024
- 4.1 Introduction
- 4.2 Company market share
- 4.3 Strategic dashboard
- 4.4 Strategic initiative
- 4.5 Competitive benchmarking
- 4.6 Innovation & sustainability landscape
Chapter 5 Market Size and Forecast, By Process, 2021 – 2034 (USD Billion)
- 5.1 Key trends
- 5.2 Steam reformer
- 5.3 Electrolysis
- 5.4 Others
Chapter 6 Market Size and Forecast, By Application, 2021 – 2034 (USD Billion)
- 6.1 Key trends
- 6.2 Petroleum refinery
- 6.3 Chemical
- 6.4 Metal
- 6.5 Others
Chapter 7 Market Size and Forecast, By Region, 2021 – 2034 (USD Billion)
- 7.1 Key trends
- 7.2 North America
- 7.2.1 U.S.
- 7.2.2 Canada
- 7.2.3 Mexico
- 7.3 Europe
- 7.3.1 Germany
- 7.3.2 Italy
- 7.3.3 Netherlands
- 7.3.4 Russia
- 7.4 Asia Pacific
- 7.4.1 China
- 7.4.2 India
- 7.4.3 Japan
- 7.5 Middle East & Africa
- 7.5.1 Saudi Arabia
- 7.5.2 Iran
- 7.5.3 UAE
- 7.5.4 South Africa
- 7.6 Latin America
- 7.6.1 Brazil
- 7.6.2 Argentina
- 7.6.3 Chile
Chapter 8 Company Profiles
- 8.1 Air Products and Chemicals
- 8.2 Cummins
- 8.3 Enapter
- 8.4 Hitachi Zosen Corporation
- 8.5 HoSt Group
- 8.6 Linde
- 8.7 McPhy Energy
- 8.8 Messer Group
- 8.9 NEL Hydrogen
- 8.10 NEXT Hydrogen
- 8.11 Siemens Energy
- 8.12 Teledyne Energy Systems
 2026年全球沼氣氫氣生產市場報告
 全球氫氣生產市場規模、佔有率、趨勢和成長分析報告(2026-2034年)
 氫氣生產市場規模、佔有率、趨勢及預測(按技術、應用、系統類型及地區分類,2026-2034年)2026年全球氫氣生產市場報告
 氫氣生產:市場佔有率分析、產業趨勢與統計、成長預測(2026-2031)
 氫氣生產市場規模、佔有率和趨勢分析報告:按技術、系統、應用、地區和細分市場預測,2026-2033年
 蒸氣重組(SMR)市場規模、佔有率和成長分析(按原料、重整技術、終端用戶產業、營運規模和地區分類)-2026-2033年產業預測日本氫氣生產市場規模、佔有率、趨勢及預測(按技術、系統類型、應用和地區分類,2026-2034年)
 氫氣生產市場規模、佔有率及成長分析(按技術、原料、應用及地區分類)-2026-2033年產業預測
 全球氫氣生產市場-產業規模、佔有率、趨勢、機會及預測(依來源、技術(蒸汽甲烷重整、煤氣化及其他)、應用、區域及競爭格局分類,2020-2030年預測)