


 |
市場調查報告書
商品編碼
1755379
公用事業規模高壓數位變電站市場機會、成長動力、產業趨勢分析及 2025 - 2034 年預測Utility Scale High Voltage Digital Substation Market Opportunity, Growth Drivers, Industry Trend Analysis, and Forecast 2025 - 2034 |
||||||
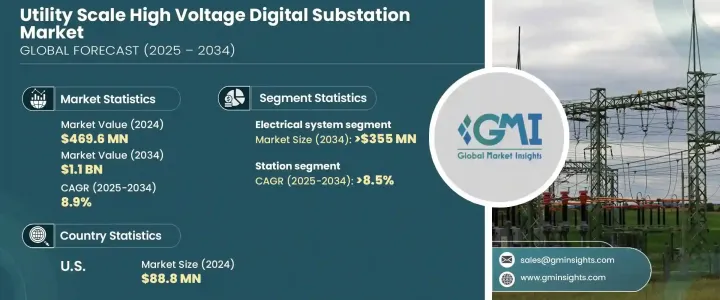
2024年,全球公用事業級高壓數位化變電站市場規模為4.696億美元,預計到2034年將以8.9%的複合年成長率成長,達到11億美元,這得益於數位技術的快速發展以及對電網現代化日益重視。公用事業公司擴大採用自動化和遠端監控解決方案,以降低營運成本並最大限度地減少停機時間。
再生能源(尤其是太陽能和風能)的興起凸顯了對更高效、更可靠的能源分配系統的需求,這進一步推動了高壓數位化變電站的普及。這些變電站將再生能源整合到現有電網中,同時保持穩定性和可靠性。先進的智慧電網技術能夠實現即時監控、自動控制和更完善的資料分析,確保根據供需波動(尤其是間歇性再生能源的波動)調整能源分配。此外,數位化變電站還能幫助公用事業公司最佳化電網性能,更快地偵測故障和停電,減少停機時間,並提高整體營運效率。隨著全球對永續發展和脫碳的推動日益加強,這一點尤其重要,它鼓勵人們採用更清潔的能源解決方案,同時保持電網的穩定和韌性。
| 市場範圍 | |
|---|---|
| 起始年份 | 2024 |
| 預測年份 | 2025-2034 |
| 起始值 | 4.696億美元 |
| 預測值 | 11億美元 |
| 複合年成長率 | 8.9% |
受技術創新和日益成長的效率關注度推動,電力系統市場規模預計到2034年將達到3.55億美元。整合高效能感測器和物聯網 (IoT) 設備可實現即時監控和資料分析,這對於有效的電網管理和預測性維護至關重要。對最大程度減少停機時間和降低營運成本的重視,增加了對耐用、高品質組件的投資,以確保長期可靠性並降低維護要求。這些趨勢凸顯了數位化變電站向更複雜、更互聯的系統轉變,這與電力基礎設施現代化和最佳化的目標一致。
預計到2034年,變電站架構領域的複合年成長率將達到8.5%,這反映了向模組化和分散式設計的趨勢。這些架構為公用事業公司提供了更高的靈活性和可擴展性,使其能夠適應不斷變化的需求並融入新興技術。隨著數位變電站互聯程度的提高,它們也更容易受到網路威脅,因此人們更加重視其架構內的網路安全措施。這種轉變表明,變電站設計應更具適應性、更有效率、更安全,以支援當代電網管理和營運目標。
2024年,美國公用事業級高壓數位化變電站市場規模達8,880萬美元,主要得益於私營和公共部門電力基礎設施的升級改造。政府的激勵措施,加上對節能解決方案的需求,正在加速美國各地數位化變電站的普及。公用事業公司不僅面臨嚴格的環境政策壓力,還面臨越來越大的能源系統可靠性和永續性要求。隨著對電網彈性和靈活性的需求不斷成長,數位化變電站對於即時資料分析、預測性維護以及多種能源的無縫整合至關重要。
該行業的主要參與者包括施耐德電氣、西門子、鮑威爾工業、東芝能源系統與解決方案公司、Larsen & Toubro Limited、WEG、日立能源、WAGO、伊頓公司、通用電氣、Hubbell、NR Electric Co. Ltd.、ABB 和 Netcontrol Group。在公用事業規模的高壓數位變電站產業,各公司正在採取一系列策略來提升其市場佔有率,並滿足對可靠、永續能源解決方案日益成長的需求。主要參與者正在大力投資研發以推動技術創新,特別是透過整合先進的數位控制系統、自動化和預測性維護。此外,永續性是一個重點,各公司正在推動綠色能源解決方案和低碳技術,以滿足全球環境標準。策略合作夥伴關係和收購可以擴展技術能力並進入新市場。
目錄
第1章:方法論與範圍
第2章:執行摘要
第3章:行業洞察
- 產業生態系統分析
- 川普政府關稅分析
- 對貿易的影響
- 貿易量中斷
- 報復措施
- 對產業的影響
- 供應方影響(原料)
- 主要材料價格波動
- 供應鏈重組
- 生產成本影響
- 需求面影響(售價)
- 價格傳導至終端市場
- 市佔率動態
- 消費者反應模式
- 供應方影響(原料)
- 受影響的主要公司
- 策略產業反應
- 供應鏈重組
- 定價和產品策略
- 政策參與
- 展望與未來考慮
- 對貿易的影響
- 監管格局
- 產業衝擊力
- 成長動力
- 產業陷阱與挑戰
- 成長潛力分析
- 波特的分析
- PESTEL分析
第4章:競爭格局
- 戰略儀表板
- 創新與永續發展格局
第5章:市場規模及預測:依組件分類,2021 - 2034 年
- 主要趨勢
- 變電所自動化系統
- 通訊網路
- 電氣系統
- 監控系統
- 其他
第6章:市場規模及預測:依架構,2021 - 2034
- 主要趨勢
- 過程
- 灣
- 車站
第7章:市場規模及預測:依安裝量,2021 - 2034
- 主要趨勢
- 新的
- 翻新
第8章:市場規模及預測:按地區,2021 - 2034
- 主要趨勢
- 北美洲
- 美國
- 加拿大
- 墨西哥
- 歐洲
- 英國
- 法國
- 德國
- 義大利
- 俄羅斯
- 西班牙
- 亞太地區
- 中國
- 澳洲
- 印度
- 日本
- 韓國
- 中東和非洲
- 沙烏地阿拉伯
- 阿拉伯聯合大公國
- 土耳其
- 南非
- 埃及
- 拉丁美洲
- 巴西
- 阿根廷
第9章:公司簡介
- ABB
- Eaton Corporation
- General Electric
- Hitachi Energy
- Hubbell
- Larson & Toubro Limited
- NR Electric Co. Ltd.
- Netcontrol Group
- Powell Industries
- Siemens
- Schneider Electric
- Toshiba Energy Systems & Solutions Corporation
- WAGO
- WEG
The Global Utility Scale High Voltage Digital Substation Market was valued at USD 469.6 million in 2024 and is estimated to grow at a CAGR of 8.9% to reach USD 1.1 billion by 2034, fueled by rapid advancements in digital technology and an increasing emphasis on grid modernization. Utilities are increasingly adopting automation and remote monitoring solutions to cut operational costs and minimize downtime.
The rise of renewable energy sources, particularly solar and wind, has highlighted the need for more efficient and reliable energy distribution systems further driving the adoption of high-voltage digital substations. These substations integrate renewable power into existing grids while maintaining stability and reliability. Advanced smart grid technologies enable real-time monitoring, automated control, and improved data analytics, ensuring that energy distribution can be adjusted based on demand and supply fluctuations, particularly from intermittent renewable sources. Moreover, digital substations help utilities optimize grid performance by detecting faults and outages quicker, reducing downtime, and enhancing overall operational efficiency. This is especially vital as the global push for sustainability and decarbonization intensifies, encouraging the adoption of cleaner energy solutions while maintaining a stable and resilient power grid.
| Market Scope | |
|---|---|
| Start Year | 2024 |
| Forecast Year | 2025-2034 |
| Start Value | $469.6 Million |
| Forecast Value | $1.1 Billion |
| CAGR | 8.9% |
The electrical systems segment is expected to reach USD 355 million by 2034, spurred by technological innovations and a growing focus on efficiency. Integrating high-performance sensors and Internet of Things (IoT) devices enables real-time monitoring and data analysis, which are crucial for effective grid management and predictive maintenance. This heightened emphasis on minimizing downtime and reducing operational expenses has increased investments in durable, high-quality components that ensure long-term reliability and lower maintenance requirements. Such trends underscore the shift towards more sophisticated and interconnected systems within digital substations, aligning with the objectives of modernizing and optimizing power infrastructure.
The station architecture segment is projected to achieve a CAGR of 8.5% through 2034, reflecting a movement toward modular and decentralized designs. These architectures provide utilities with enhanced flexibility and scalability, enabling them to adapt to changing demands and incorporate emerging technologies. As digital substations become increasingly interconnected, they are also more vulnerable to cyber threats, which has resulted in a stronger focus on cybersecurity measures within their architecture. This shift indicates a trend towards more adaptable, efficient, and secure substation designs that support contemporary grid management and operational goals.
U.S. Utility Scale High Voltage Digital Substation Market was valued at USD 88.8 million in 2024, driven by the private and public sectors upgrading their electrical infrastructure. Government incentives, coupled with the need for energy-efficient solutions, are accelerating the adoption of digital substations across the U.S. Utility companies are being pressured not only by strict environmental policies but also by mounting pressure for more reliable and sustainable energy systems. As the demand for grid resilience and flexibility grows, digital substations are essential for real-time data analysis, predictive maintenance, and seamless integration of diverse energy sources.
Key players involved in the industry include Schneider Electric, Siemens, Powell Industries, Toshiba Energy Systems & Solutions Corporation, Larsen & Toubro Limited, WEG, Hitachi Energy, WAGO, Eaton Corporation, General Electric, Hubbell, NR Electric Co. Ltd., ABB, and Netcontrol Group. In the utility-scale high voltage digital substation industry, companies are adopting a range of strategies to enhance their market presence and meet the increasing demand for reliable, sustainable energy solutions. Major players are investing heavily in research and development to drive technological innovation, particularly by integrating advanced digital control systems, automation, and predictive maintenance. Additionally, sustainability is a key focus, with companies pushing forward green energy solutions and low-carbon technologies to meet global environmental standards. Strategic partnerships and acquisitions allow for expanded technological capabilities and access to new markets.
Table of Contents
Chapter 1 Methodology & Scope
- 1.1 Market definitions
- 1.2 Base estimates & calculations
- 1.3 Forecast calculation
- 1.4 Data sources
- 1.4.1 Primary
- 1.4.2 Secondary
- 1.4.2.1 Paid
- 1.4.2.2 Public
Chapter 2 Executive Summary
- 2.1 Industry synopsis, 2021 - 2034
Chapter 3 Industry Insights
- 3.1 Industry ecosystem analysis
- 3.2 Trump administration tariff analysis
- 3.2.1 Impact on trade
- 3.2.1.1 Trade volume disruptions
- 3.2.1.2 Retaliatory measures
- 3.2.2 Impact on the industry
- 3.2.2.1 Supply-side impact (raw materials)
- 3.2.2.1.1 Price volatility in key materials
- 3.2.2.1.2 Supply chain restructuring
- 3.2.2.1.3 Production cost implications
- 3.2.2.2 Demand-side impact (selling price)
- 3.2.2.2.1 Price transmission to end markets
- 3.2.2.2.2 Market share dynamics
- 3.2.2.2.3 Consumer response patterns
- 3.2.2.1 Supply-side impact (raw materials)
- 3.2.3 Key companies impacted
- 3.2.4 Strategic industry responses
- 3.2.4.1 Supply chain reconfiguration
- 3.2.4.2 Pricing and product strategies
- 3.2.4.3 Policy engagement
- 3.2.5 Outlook and future considerations
- 3.2.1 Impact on trade
- 3.3 Regulatory landscape
- 3.4 Industry impact forces
- 3.4.1 Growth drivers
- 3.4.2 Industry pitfalls & challenges
- 3.5 Growth potential analysis
- 3.6 Porter's analysis
- 3.6.1 Bargaining power of suppliers
- 3.6.2 Bargaining power of buyers
- 3.6.3 Threat of new entrants
- 3.6.4 Threat of substitutes
- 3.7 PESTEL analysis
Chapter 4 Competitive Landscape, 2024
- 4.1 Strategic dashboard
- 4.2 Innovation & sustainability landscape
Chapter 5 Market Size and Forecast, By Component, 2021 - 2034 (USD Million)
- 5.1 Key trends
- 5.2 Substation automation system
- 5.3 Communication network
- 5.4 Electrical system
- 5.5 Monitoring & control system
- 5.6 Others
Chapter 6 Market Size and Forecast, By Architecture, 2021 - 2034 (USD Million)
- 6.1 Key trends
- 6.2 Process
- 6.3 Bay
- 6.4 Station
Chapter 7 Market Size and Forecast, By Installation, 2021 - 2034 (USD Million)
- 7.1 Key trends
- 7.2 New
- 7.3 Refurbished
Chapter 8 Market Size and Forecast, By Region, 2021 - 2034 (USD Million)
- 8.1 Key trends
- 8.2 North America
- 8.2.1 U.S.
- 8.2.2 Canada
- 8.2.3 Mexico
- 8.3 Europe
- 8.3.1 UK
- 8.3.2 France
- 8.3.3 Germany
- 8.3.4 Italy
- 8.3.5 Russia
- 8.3.6 Spain
- 8.4 Asia Pacific
- 8.4.1 China
- 8.4.2 Australia
- 8.4.3 India
- 8.4.4 Japan
- 8.4.5 South Korea
- 8.5 Middle East & Africa
- 8.5.1 Saudi Arabia
- 8.5.2 UAE
- 8.5.3 Turkey
- 8.5.4 South Africa
- 8.5.5 Egypt
- 8.6 Latin America
- 8.6.1 Brazil
- 8.6.2 Argentina
Chapter 9 Company Profiles
- 9.1 ABB
- 9.2 Eaton Corporation
- 9.3 General Electric
- 9.4 Hitachi Energy
- 9.5 Hubbell
- 9.6 Larson & Toubro Limited
- 9.7 NR Electric Co. Ltd.
- 9.8 Netcontrol Group
- 9.9 Powell Industries
- 9.10 Siemens
- 9.11 Schneider Electric
- 9.12 Toshiba Energy Systems & Solutions Corporation
- 9.13 WAGO
- 9.14 WEG
 全球中壓(MV)工業配電變電站市場全球工業高壓變電站市場全球工業高壓配電變電站市場
 數位變電站市場-全球產業規模、佔有率、趨勢、機會及預測(按模組、電壓、最終用途產業、地區及競爭細分,2020-2030 年)低壓數位變電站市場機會、成長動力、產業趨勢分析及 2025 - 2034 年預測公用事業規模低壓數位變電站市場機會、成長動力、產業趨勢分析及 2025 - 2034 年預測數位變電站市場規模、佔有率、趨勢分析報告:按模組、絕緣子、電壓、應用、地區、細分市場預測,2025-2030 年工業低壓數位變電站市場機會、成長動力、產業趨勢分析及 2025 - 2034 年預測公用事業規模數位化變電站市場機會、成長動力、產業趨勢分析及 2025 - 2034 年預測
 數位公用事業市場規模、佔有率及成長分析(按組件、部署、效用、最終用途和地區)-2025 年至 2032 年產業預測