


 |
市場調查報告書
商品編碼
1755366
飲料調味系統市場機會、成長動力、產業趨勢分析及 2025 - 2034 年預測Beverage Flavoring System Market Opportunity, Growth Drivers, Industry Trend Analysis, and Forecast 2025 - 2034 |
||||||
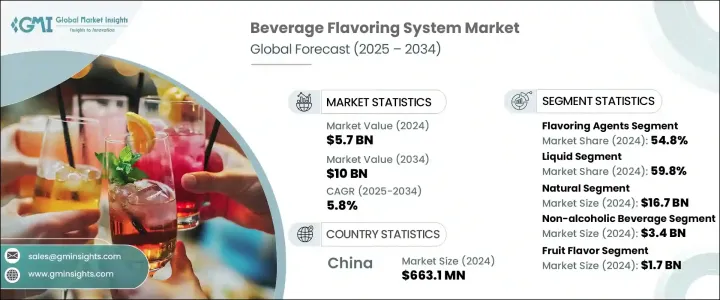
2024年,全球飲料調味系統市場規模達57億美元,預計2034年將以5.8%的複合年成長率成長,達到100億美元。受消費者偏好變化、技術創新以及飲料應用日益多樣化的推動,該市場正經歷著一場充滿活力的變革。隨著飲料生產商努力提升產品吸引力並打造差異化產品,調味系統已成為提供一致的口感、香氣和視覺衝擊力的關鍵要素。飲料行業的每個類別——無論是軟性飲料、功能性飲料還是乳製飲料——都高度依賴客製化的調味系統來滿足市場需求。
天然和清潔標籤調味解決方案正日益受到青睞,這反映出消費者對健康和保健意識的日益提升。消費者對植物性、非基因改造和有機來源的調味成分的偏好日益成長,促使製造商採用天然成分,例如植物浸液、精油和發酵香料。這些元素不僅符合當前的健康趨勢,也支持更清晰的標籤,進一步引起當今知情消費者的共鳴。飲料調味系統市場的驅動力在於持續的創新、不斷增加的研發活動以及全球調味品公司之間日益激烈的競爭。這些參與者正在與飲料品牌建立策略合作關係,並利用新的配方技術,創造獨特的風味,在競爭激烈的市場中脫穎而出。
| 市場範圍 | |
|---|---|
| 起始年份 | 2024 |
| 預測年份 | 2025-2034 |
| 起始值 | 57億美元 |
| 預測值 | 100億美元 |
| 複合年成長率 | 5.8% |
按成分類型分類,調味劑在2024年佔據54.8%的市場佔有率,佔據該細分市場的主導地位,預計到2034年將以5.7%的複合年成長率成長。調味劑在業界的優勢源於其在塑造飲料感官特性方面發揮的重要作用。這些調味料對於提供標誌性的口味體驗、滿足消費者對真實性的需求以及提升產品形象至關重要。隨著人們對新穎天然口味選擇的需求不斷成長,調味劑在傳統和新興飲料形式中都得到了廣泛的應用。
就形態而言,液體香精在2024年佔據最大佔有率,達到59.8%,預計將維持5.7%的複合年成長率。液體香精系統的成功很大程度上歸功於其易於整合、配方分佈均勻以及成本效益。其高適應性使製造商能夠快速回應不斷變化的香精趨勢,簡化生產流程並降低營運成本。無論是大規模生產或小批量生產,液體香精系統都能提供無與倫比的一致性和加工效率。
按來源細分,天然香料市場表現突出,2024 年估值高達 167 億美元。這一主導地位反映出注重健康的清潔標籤飲料日益受到青睞。隨著消費者對合成成分日益謹慎,天然香料因其透明度、真實性和可感知的健康益處而備受青睞。飲料生產商正在改進產品配方,強調自然宣稱,以吸引注重健康的消費者。儘管面臨成本和原料採購方面的挑戰,天然香料在高階和功能性飲料類別中尤其受到青睞,鞏固了其領先的市場地位。
從飲料類型來看,非酒精飲料成為最大的貢獻者,2024 年市場規模達 34 億美元。該細分市場的強勁成長得益於其較高的日均消費量、豐富的產品種類以及廣泛的消費者群體。從補水產品到能量提升配方,非酒精飲料類別始終需要創新的風味解決方案來維持消費者的興趣。另一方面,酒精飲料雖然市場規模較小,但由於消費者對高階風味酒精飲料的需求不斷成長,其市場規模也顯著成長。
就風味類型而言,水果風味佔據主導地位,2024 年市場規模達 17 億美元。由於其與健康的天然關聯、與各種飲料的廣泛兼容性以及成本效益,水果風味將繼續佔據主導地位。水果風味用途廣泛,既可單獨使用,也可進行複雜的混合,因此深受致力於提供獨特清新口味體驗的製造商的青睞。
從區域來看,中國在亞太地區飲料調味系統市場中處於領先地位,2024 年市場價值達 6.631 億美元,預計到 2034 年複合年成長率將達到 5.6%。中國龐大的消費群體、城市擴張以及對調味和功能性飲料日益成長的需求,共同推動著這一成長。強大的國內製造能力和良好的食品安全法規進一步鞏固了中國的地位。隨著消費者需求持續轉向健康、風味濃郁的飲料,中國仍將是該地區創新和生產的中心。
全球調味系統供應商正利用其技術專長、豐富的產品線和廣泛的分銷網路來滿足日益成長的需求。他們的競爭優勢在於能夠快速適應、大力投資創新,並在多個地區提供一致的品質。
目錄
第1章:方法論
- 市場範圍和定義
- 研究設計
- 研究方法
- 資料收集方法
- 資料探勘來源
- 全球的
- 地區/國家
- 基礎估算與計算
- 基準年計算
- 市場評估的主要趨勢
- 初步研究和驗證
- 主要來源
- 預測模型
- 研究假設和局限性
第2章:執行摘要
第3章:行業洞察
- 產業生態系統分析
- 供應商格局
- 利潤率
- 每個階段的增值
- 影響價值鏈的因素
- 中斷
- 產業衝擊力
- 成長動力
- 產業陷阱與挑戰
- 市場機會
- 成長潛力分析
- 監管格局
- 北美洲
- 歐洲
- 亞太地區
- 拉丁美洲
- 中東和非洲
- 波特的分析
- PESTEL分析
- 價格趨勢
- 按地區
- 按產品
- 未來市場趨勢
- 科技與創新格局
- 當前的技術趨勢
- 新興技術
- 專利態勢
- 貿易統計資料(HS 編碼)(註:僅提供重點國家的貿易統計資料)
- 主要進口國
- 主要出口國
- 永續性和環境方面
- 永續實踐
- 減少廢棄物的策略
- 生產中的能源效率
- 環保舉措
- 新興趨勢與未來展望
- 技術創新
- 人工智慧和機器學習在風味開發的應用
- 先進的封裝技術
- 生物技術在風味生產的應用
- 消費者偏好的演變
- 清潔標籤運動
- 功能性香料
- 全球和異國風味
- 健康與保健趨勢
- 減糖解決方案
- 增強免疫力的口味
- 適應原和益智口味
- 個性化和客製化
- 香精香料產業的數位轉型
- 與其他飲料類別的整合
- 植物飲料
- 低酒精/無酒精飲料
- 功能性飲料
- 未來市場潛力
- 投資機會
- 技術創新
第4章:競爭格局
- 介紹
- 公司市佔率分析
- 按地區
- 北美洲
- 歐洲
- 亞太地區
- 拉丁美洲
- MEA
- 按地區
- 公司矩陣分析
- 主要市場參與者的競爭分析
- 競爭定位矩陣
- 關鍵進展
- 併購
- 夥伴關係與合作
- 新產品發布
- 擴張計劃
第5章:市場估計與預測:依成分類型,2021 - 2034 年
- 主要趨勢
- 調味劑
- 天然香料
- 水果口味
- 植物風味
- 香料和香草口味
- 堅果和種子口味
- 其他
- 人工香料
- 水果模仿者
- 甜味
- 鹹味
- 其他
- 與天然相同的口味
- 天然香料
- 風味載體
- 丙二醇
- 乙醇
- 植物油
- 其他
- 增味劑
- 酸化劑
- 甜味劑
- 其他
- 風味改良劑
第6章:市場估計與預測:依形式,2021 - 2034 年
- 主要趨勢
- 液體
- 乳液
- 解決方案
- 暫停
- 乾燥
- 噴霧乾燥
- 冷凍乾燥
- 膠囊
- 其他
第7章:市場估計與預測:按來源,2021 - 2034 年
- 主要趨勢
- 自然的
- 植物性
- 動物源性
- 人造的
- 自然同一性
第8章:市場估計與預測:依飲料類型,2021 - 2034 年
- 主要趨勢
- 酒精飲料
- 啤酒
- 葡萄酒
- 烈酒
- 即飲(RTD)酒精飲料
- 其他
- 非酒精飲料
- 碳酸軟性飲料
- 果汁和花蜜
- 能量飲料
- 運動飲料
- 即飲茶和咖啡
- 調味水
- 乳製品飲料
- 植物飲料
- 其他
第9章:市場預估與預測:依口味類型,2021 - 2034
- 主要趨勢
- 水果口味
- 莓果
- 柑橘
- 熱帶
- 核果
- 其他
- 巧克力和香草
- 咖啡和茶
- 香料和草藥
- 花香
- 堅果和種子口味
- 薄荷和薄荷醇
- 甜味
- 鹹味
- 其他
第10章:市場估計與預測:按地區,2021 - 2034 年
- 主要趨勢
- 北美洲
- 美國
- 加拿大
- 歐洲
- 德國
- 英國
- 法國
- 義大利
- 西班牙
- 歐洲其他地區
- 亞太地區
- 中國
- 印度
- 日本
- 澳洲
- 韓國
- 亞太其他地區
- 拉丁美洲
- 巴西
- 墨西哥
- 阿根廷
- 拉丁美洲其他地區
- 中東和非洲
- 沙烏地阿拉伯
- 南非
- 阿拉伯聯合大公國
- 中東和非洲其他地區
第 11 章:公司簡介
- Givaudan SA
- International Flavors & Fragrances Inc. (IFF)
- DSM
- Symrise AG
- Sensient Technologies Corporation
- Kerry Group plc
- Archer Daniels Midland Company (ADM)
- Tate & Lyle PLC
- Cargill, Incorporated
- MANE SA
- McCormick & Company, Inc.
- Takasago International Corporation
- T. Hasegawa Co., Ltd.
- Robertet Group
- Kalsec Inc.
The Global Beverage Flavoring System Market was valued at USD 5.7 billion in 2024 and is estimated to grow at a CAGR of 5.8% to reach USD 10 billion by 2034. This market is undergoing a dynamic transformation fueled by evolving consumer preferences, innovative technologies, and the increasing diversity of beverage applications. As beverage producers strive to enhance product appeal and differentiate offerings, flavor systems have emerged as a critical component in delivering consistent taste, aroma, and visual impact. Every category within the beverage sector-whether it's soft drinks, functional beverages, or dairy-based drinks-relies heavily on tailored flavoring systems to meet market demands.
There is an ongoing shift towards natural and clean-label flavoring solutions, reflecting broader consumer awareness around health and wellness. The rising preference for plant-based, non-GMO, and organically sourced flavor ingredients is encouraging manufacturers to adopt natural components like botanical infusions, essential oils, and fermentation-derived flavors. These elements not only align with current health trends but also support clearer labeling, which further resonates with today's informed consumers. The beverage flavoring system market is driven by constant innovation, increased R&D activity, and heightened competition among global flavor houses. These players are forming strategic collaborations with beverage brands and leveraging new formulation technologies to create unique flavor profiles that stand out in a crowded marketplace.
| Market Scope | |
|---|---|
| Start Year | 2024 |
| Forecast Year | 2025-2034 |
| Start Value | $5.7 Billion |
| Forecast Value | $10 Billion |
| CAGR | 5.8% |
By ingredient type, flavoring agents led the segment with a commanding 54.8% market share in 2024 and are projected to grow at a CAGR of 5.7% through 2034. Their stronghold in the industry stems from their essential role in shaping the sensory characteristics of beverages. These agents are integral to delivering signature taste experiences, meeting consumer demand for authenticity, and elevating product identity. As the appetite for novel and natural taste options continues to grow, flavoring agents are seeing widespread application across both conventional and emerging beverage formats.
In terms of form, liquid forms accounted for the largest share at 59.8% in 2024 and are anticipated to maintain momentum with a 5.7% CAGR. The success of liquid flavor systems is largely due to their ease of integration, uniform distribution in formulations, and cost-effectiveness. Their adaptability allows manufacturers to respond quickly to changing flavor trends, streamline production processes, and reduce operational costs. Whether it's large-scale manufacturing or small-batch production, liquid flavor systems offer unmatched consistency and processing efficiency.
When segmented by origin, the natural flavor segment stood out with a significant valuation of USD 16.7 billion in 2024. This dominance reflects the increasing popularity of health-forward, clean-label beverages. As consumers grow more cautious about synthetic ingredients, natural flavors have gained favor for their transparency, authenticity, and perceived health benefits. Beverage producers are reformulating products to emphasize natural claims, appealing to the wellness-oriented segment. Despite challenges around cost and raw material sourcing, natural flavors are particularly favored in premium and functional beverage categories, reinforcing their leading market position.
Based on beverage type, non-alcoholic drinks emerged as the largest contributor, holding a market size of USD 3.4 billion in 2024. The strong presence of this segment is attributed to high daily consumption rates, product variety, and a broad consumer base. From hydration products to energy-enhancing formulations, the non-alcoholic category consistently demands innovative flavor solutions to maintain consumer interest. On the other hand, alcoholic beverages, though smaller in market size, are witnessing notable growth fueled by rising demand for premium, flavored alcoholic drinks.
Regarding flavor types, fruit flavors led the category, accounting for USD 1.7 billion in 2024. These flavors continue to dominate due to their natural association with wellness, wide compatibility with various beverage types, and cost-efficiency. The versatility of fruit flavors allows for both standalone applications and complex blends, making them a favorite among manufacturers aiming to deliver unique and refreshing taste experiences.
Regionally, China leads the Asia Pacific beverage flavoring system market with a market value of USD 663.1 million in 2024 and is projected to grow at a CAGR of 5.6% through 2034. The country's large consumer base, urban expansion, and increasing appetite for flavored and functional drinks are fueling this growth. Strong domestic manufacturing capabilities and favorable food safety regulations have further strengthened China's position. As consumer demand continues to shift toward health-conscious and flavor-rich beverage options, China remains a central hub for innovation and production in the region.
Global flavor system providers are leveraging their technical expertise, diverse product lines, and expansive distribution networks to tap into the growing demand. Their competitive edge lies in their ability to adapt quickly, invest heavily in innovation, and offer consistent quality across multiple regions.
Table of Contents
Chapter 1 Methodology
- 1.1 Market scope and definition
- 1.2 Research design
- 1.2.1 Research approach
- 1.2.2 Data collection methods
- 1.3 Data mining sources
- 1.3.1 Global
- 1.3.2 Regional/Country
- 1.4 Base estimates and calculations
- 1.4.1 Base year calculation
- 1.4.2 Key trends for market estimation
- 1.5 Primary research and validation
- 1.5.1 Primary sources
- 1.6 Forecast model
- 1.7 Research assumptions and limitations
Chapter 2 Executive Summary
- 2.1 Industry 3600 synopsis
- 2.2 Key market trends
- 2.2.1 Regional
- 2.2.2 Ingredient type
- 2.2.3 Form
- 2.2.4 Origin
- 2.2.5 Beverage type
- 2.2.6 Flavor type
- 2.3 TAM Analysis, 2025-2034
- 2.4 CXO perspectives: Strategic imperatives
- 2.4.1 Executive decision points
- 2.4.2 Critical success factors
- 2.5 Future Outlook and Strategic Recommendations
Chapter 3 Industry Insights
- 3.1 Industry ecosystem analysis
- 3.1.1 Supplier landscape
- 3.1.2 Profit margin
- 3.1.3 Value addition at each stage
- 3.1.4 Factor affecting the value chain
- 3.1.5 Disruptions
- 3.2 Industry impact forces
- 3.2.1 Growth drivers
- 3.2.2 Industry pitfalls and challenges
- 3.2.3 Market opportunities
- 3.3 Growth potential analysis
- 3.4 Regulatory landscape
- 3.4.1 North America
- 3.4.2 Europe
- 3.4.3 Asia Pacific
- 3.4.4 Latin America
- 3.4.5 Middle East & Africa
- 3.5 Porter's analysis
- 3.6 PESTEL analysis
- 3.6.1 Technology and innovation landscape
- 3.6.2 Current technological trends
- 3.6.3 Emerging technologies
- 3.7 Price trends
- 3.7.1 By region
- 3.7.2 By product
- 3.8 Future market trends
- 3.9 Technology and Innovation landscape
- 3.9.1 Current technological trends
- 3.9.2 Emerging technologies
- 3.10 Patent Landscape
- 3.11 Trade statistics (HS code) ( Note: the trade statistics will be provided for key countries only )
- 3.11.1 Major importing countries
- 3.11.2 Major exporting countries
- 3.12 Sustainability and environmental aspects
- 3.12.1 Sustainable practices
- 3.12.2 Waste reduction strategies
- 3.12.3 Energy efficiency in production
- 3.12.4 Eco-friendly initiatives
- 3.13 Emerging trends and future outlook
- 3.13.1 Technological innovations
- 3.13.1.1 Ai and machine learning in flavor development
- 3.13.1.2 Advanced encapsulation technologies
- 3.13.1.3 Biotechnology in flavor production
- 3.13.2 Consumer preference evolution
- 3.13.2.1 Clean label movement
- 3.13.2.2 Functional flavors
- 3.13.2.3 Global and exotic flavor profiles
- 3.13.3 Health and wellness trends
- 3.13.4 Sugar reduction solutions
- 3.13.5 Immunity-boosting flavors
- 3.13.6 Adaptogenic and nootropic flavors
- 3.13.7 Personalization and customization
- 3.13.8 Digital transformation in flavor industry
- 3.13.9 Integration with alternative beverage categories
- 3.13.9.1 Plant-based beverages
- 3.13.9.2 Low/no-alcohol beverages
- 3.13.9.3 Functional beverages
- 3.13.10 Future market potential
- 3.13.11 Investment opportunities
- 3.13.1 Technological innovations
Chapter 4 Competitive Landscape, 2024
- 4.1 Introduction
- 4.2 Company market share analysis
- 4.2.1 By region
- 4.2.1.1 North America
- 4.2.1.2 Europe
- 4.2.1.3 Asia Pacific
- 4.2.1.4 LATAM
- 4.2.1.5 MEA
- 4.2.1 By region
- 4.3 Company matrix analysis
- 4.4 Competitive analysis of major market players
- 4.5 Competitive positioning matrix
- 4.6 Key developments
- 4.6.1 Mergers & acquisitions
- 4.6.2 Partnerships & collaborations
- 4.6.3 New product launches
- 4.6.4 Expansion plans
Chapter 5 Market Estimates & Forecast, By Ingredient Type, 2021 - 2034 (USD Million) (Kilo Tons)
- 5.1 Key trend
- 5.2 Flavoring agents
- 5.2.1 Natural flavors
- 5.2.1.1 Fruit flavors
- 5.2.1.2 Botanical flavors
- 5.2.1.3 Spice and herb flavors
- 5.2.1.4 Nut and seed flavors
- 5.2.1.5 Others
- 5.2.2 Artificial flavors
- 5.2.2.1 Fruit mimics
- 5.2.2.2 Sweet flavors
- 5.2.2.3 Savory flavors
- 5.2.2.4 Others
- 5.2.3 Nature-identical flavors
- 5.2.1 Natural flavors
- 5.3 Flavor carriers
- 5.3.1 Propylene glycol
- 5.3.2 Ethanol
- 5.3.3 Vegetable oils
- 5.3.4 Others
- 5.4 Flavor enhancers
- 5.4.1 Acidulants
- 5.4.2 Sweeteners
- 5.4.3 Others
- 5.5 Flavor modifiers
Chapter 6 Market Estimates & Forecast, By Form, 2021 - 2034 (USD Million) (Kilo Tons)
- 6.1 Key trend
- 6.2 Liquid
- 6.2.1 Emulsions
- 6.2.2 Solutions
- 6.2.3 Suspensions
- 6.3 Dry
- 6.3.1 Spray-dried
- 6.3.2 Freeze-dried
- 6.3.3 Encapsulated
- 6.3.4 Others
Chapter 7 Market Estimates & Forecast, By Origin, 2021 - 2034 (USD Million) (Kilo Tons)
- 7.1 Key trend
- 7.2 Natural
- 7.2.1 Plant-based
- 7.2.2 Animal-derived
- 7.3 Artificial
- 7.4 Nature-identical
Chapter 8 Market Estimates & Forecast, By Beverage Type, 2021 - 2034 (USD Million) (Kilo Tons)
- 8.1 Key trend
- 8.2 Alcoholic beverages
- 8.2.1 Beer
- 8.2.2 Wine
- 8.2.3 Spirits
- 8.2.4 Ready-to-Drink (RTD) alcoholic beverages
- 8.2.5 Others
- 8.3 Non-alcoholic beverages
- 8.3.1 Carbonated soft drinks
- 8.3.2 Juices and nectars
- 8.3.3 Energy drinks
- 8.3.4 Sports drinks
- 8.3.5 Ready-to-Drink (RTD) tea and coffee
- 8.3.6 Flavored water
- 8.3.7 Dairy-based beverages
- 8.3.8 Plant-based beverages
- 8.3.9 Others
Chapter 9 Market Estimates & Forecast, By Flavor Type, 2021 - 2034 (USD Million) (Kilo Tons)
- 9.1 Key trend
- 9.2 Fruit flavors
- 9.2.1 Berries
- 9.2.2 Citrus
- 9.2.3 Tropical
- 9.2.4 Stone fruits
- 9.2.5 Others
- 9.3 Chocolate and vanilla
- 9.4 Coffee and tea
- 9.5 Spices and herbs
- 9.6 Floral flavors
- 9.7 Nut and seed flavors
- 9.8 Mint and menthol
- 9.9 Sweet flavors
- 9.10 Savory flavors
- 9.11 Others
Chapter 10 Market Estimates & Forecast, By Region, 2021 - 2034 (USD Million) (Kilo Tons)
- 10.1 Key trends
- 10.2 North America
- 10.2.1 U.S.
- 10.2.2 Canada
- 10.3 Europe
- 10.3.1 Germany
- 10.3.2 UK
- 10.3.3 France
- 10.3.4 Italy
- 10.3.5 Spain
- 10.3.6 Rest of Europe
- 10.4 Asia Pacific
- 10.4.1 China
- 10.4.2 India
- 10.4.3 Japan
- 10.4.4 Australia
- 10.4.5 South Korea
- 10.4.6 Rest of Asia Pacific
- 10.5 Latin America
- 10.5.1 Brazil
- 10.5.2 Mexico
- 10.5.3 Argentina
- 10.5.4 Rest of Latin America
- 10.6 Middle East & Africa
- 10.6.1 Saudi Arabia
- 10.6.2 South Africa
- 10.6.3 UAE
- 10.6.4 Rest of Middle East & Africa
Chapter 11 Company Profiles
- 11.1 Givaudan SA
- 11.2 International Flavors & Fragrances Inc. (IFF)
- 11.3 DSM
- 11.4 Symrise AG
- 11.5 Sensient Technologies Corporation
- 11.6 Kerry Group plc
- 11.7 Archer Daniels Midland Company (ADM)
- 11.8 Tate & Lyle PLC
- 11.9 Cargill, Incorporated
- 11.10 MANE SA
- 11.11 McCormick & Company, Inc.
- 11.12 Takasago International Corporation
- 11.13 T. Hasegawa Co., Ltd.
- 11.14 Robertet Group
- 11.15 Kalsec Inc.
 2026-2034年全球果味飲料化合物市場規模、佔有率、趨勢和成長分析報告全球飲料調味料市場規模、佔有率、趨勢和成長分析報告(2026-2034)全球飲料調味系統市場規模、佔有率、趨勢和成長分析報告(2026-2034年)
 飲料調味系統市場-全球產業規模、佔有率、趨勢、機會和預測(按成分、類型、原料、飲料、地區和競爭格局分類),2021-2031年
 飲料調味系統市場規模、佔有率和成長分析(按成分、飲料類型、口味、形態、產地和地區分類)—產業預測(2026-2033 年)全球飲料調味系統市場-2025-2030年預測
 全球飲料口味市場全球飲料調味系統市場規模(按類型、應用、來源、區域範圍和預測)全球飲料調味系統市場
 果味飲料複合物市場 - 按口味、應用和預測,2024 年 - 2032 年