


 |
市場調查報告書
商品編碼
1755361
發電碳捕獲與封存市場機會、成長動力、產業趨勢分析及 2025 - 2034 年預測Power Generation Carbon Capture and Storage Market Opportunity, Growth Drivers, Industry Trend Analysis, and Forecast 2025 - 2034 |
||||||
2024年,全球發電碳捕集與封存市場規模達32億美元,預計2034年將以10.3%的複合年成長率成長,達到117億美元。這得歸功於日益嚴格的環境法規,這些法規要求減少發電廠的溫室氣體排放。世界各國政府對高碳排放企業處以重罰,推動企業採用CCS技術,以達成環保目標。隨著各國加大對實現淨零排放的承諾,CCS已成為向清潔能源轉型的重要工具,為發電廠提供了一種在持續生產能源的同時減少碳足跡的途徑。
CCS技術使電力公司能夠在維持能源生產的同時降低排放,從而吸引具有環保意識的投資者和消費者。這一趨勢符合全球氣候協議,並體現了對永續發展的承諾。 CCS與再生能源的結合,能夠在不損害環境影響的情況下實現穩定發電。例如,燃燒前CCS預計將實現顯著成長,為在化石燃料燃燒前減少排放提供了一種創新方法。
| 市場範圍 | |
|---|---|
| 起始年份 | 2024 |
| 預測年份 | 2025-2034 |
| 起始值 | 32億美元 |
| 預測值 | 117億美元 |
| 複合年成長率 | 10.3% |
預計到2034年,發電業碳捕獲與封存市場中的燃燒前部分將以6%的複合年成長率成長。這項技術能夠將化石燃料轉化為富氫氣體,用於發電或其他工業製程。美國一直積極參與碳捕獲與封存(CCS)的推廣,政府為開發旨在減少碳排放的封存設施和技術提供激勵措施。
2024年,美國發電業碳捕集與封存市場產值達14億美元,並受惠於政府獎勵措施以及不斷增加的燃煤和燃氣發電廠減排力道。政府已推出多項措施和財政支援機制,鼓勵採用更清潔的技術,包括碳捕集與封存 (CCS) 解決方案。這些激勵措施不僅提高了電力公司採用CCS的財務可行性,也符合減少溫室氣體排放、應對氣候變遷的更廣泛目標。因此,美國公用事業公司正在大力投資CCS技術,以實現基礎設施現代化,並滿足更嚴格的環境標準。
全球發電碳捕獲與封存市場的主要參與者包括 Aker Solutions、Equinor ASA、埃克森美孚公司、福陸公司、通用電氣、三菱重工有限公司、NRG Energy, Inc.、殼牌 CANSOLV、西門子和林德公司等。為了鞏固其在發電碳捕獲與封存市場的地位,各公司正大力投資創新的 CCS 技術,專注於提高效率並降低碳捕獲成本。與政府機構和能源公司的策略合作正變得越來越普遍,以確保為大型 CCS 專案提供資金。一些公司還在開發和部署燃燒前和燃燒後捕獲系統,這些系統可以整合到現有的發電廠中,為減少排放提供可擴展的解決方案。
目錄
第1章:方法論與範圍
第2章:執行摘要
第3章:行業洞察
- 產業生態系統分析
- 川普政府關稅分析
- 對貿易的影響
- 貿易量中斷
- 報復措施
- 對產業的影響
- 供給側影響(原料)
- 主要材料價格波動
- 供應鏈重組
- 生產成本影響
- 需求面影響(售價)
- 價格傳導至終端市場
- 市佔率動態
- 消費者反應模式
- 供給側影響(原料)
- 受影響的主要公司
- 策略產業反應
- 供應鏈重組
- 定價和產品策略
- 政策參與
- 對貿易的影響
- 展望與未來考慮
- 產業衝擊力
- 成長動力
- 產業陷阱與挑戰
- 成長潛力分析
- 波特的分析
- PESTEL分析
第4章:競爭格局
- 介紹
- 公司市佔率
- 戰略儀表板
- 策略舉措
- 競爭基準測試
- 創新與永續發展格局
第5章:市場規模及預測:依技術分類,2021 - 2034 年
- 主要趨勢
- 預燃燒
- 後燃燒
- 富氧燃燒
第6章:市場規模及預測:依地區,2021 - 2034
- 主要趨勢
- 北美洲
- 美國
- 加拿大
- 歐洲
- 挪威
- 荷蘭
- 英國
- 亞太地區
- 中國
- 韓國
- 澳洲
- 世界其他地區
第7章:公司簡介
- Air Liquide
- Linde plc
- Global Thermostat
- General Electric
- Siemens
- Aker Solutions
- HALLIBURTON
- SLB
- Exxon Mobil Corporation
- Shell CANSOLV
- Mitsubishi Heavy Industries Ltd.
- Dakota Gasification Company
- NRG Energy, Inc.
- Fluor Corporation
- Sulzer Ltd
- Equinor ASA
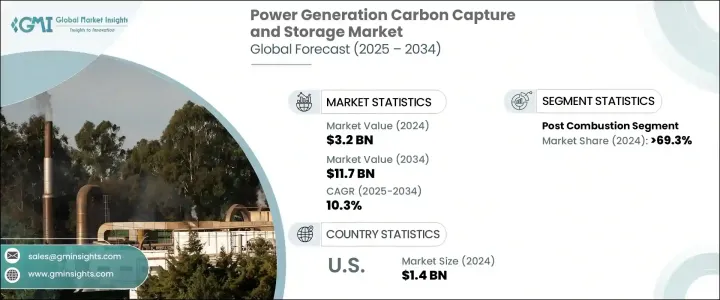
The Global Power Generation Carbon Capture and Storage Market was valued at USD 3.2 billion in 2024 and is estimated to grow at a CAGR of 10.3% to reach USD 11.7 billion by 2034, driven by the increasing implementation of stringent environmental regulations that mandate the reduction of greenhouse gas emissions from power plants. Governments worldwide enforce heavy penalties for high carbon emissions, pushing the adoption of CCS technologies to help companies meet their environmental goals. As nations ramp up their commitments to achieving net-zero emissions, CCS has become an essential tool in the transition towards cleaner energy sources, providing a way for power plants to continue producing energy while reducing their carbon footprint.
CCS technologies enable power companies to lower their emissions while maintaining energy production, making them attractive to environmentally conscious investors and consumers. This trend aligns with global climate agreements and demonstrates a commitment to sustainability. The combination of CCS with renewable energy allows for stable power generation without compromising environmental impact. Pre-combustion CCS, for example, is expected to see significant growth, offering an innovative method for reducing emissions before fossil fuels are burned.
| Market Scope | |
|---|---|
| Start Year | 2024 |
| Forecast Year | 2025-2034 |
| Start Value | $3.2 Billion |
| Forecast Value | $11.7 Billion |
| CAGR | 10.3% |
The pre-combustion segment in the power generation carbon capture and storage market is projected to grow at a CAGR of 6% by 2034. This technology enables the conversion of fossil fuels into a hydrogen-rich gas that can be used in power generation or other industrial processes. The United States has been actively involved in adopting CCS, with the government offering incentives for the development of storage facilities and technologies aimed at reducing carbon emissions.
United States Power Generation Carbon Capture and Storage Market generated USD 1.4 billion in 2024 and is benefiting significantly from a combination of government incentives and growing efforts to reduce emissions from coal and gas power plants. The government has introduced several initiatives and financial support mechanisms to encourage the adoption of cleaner technologies, including carbon capture and storage (CCS) solutions. These incentives not only make CCS more financially viable for power companies but also align with the broader goals of reducing greenhouse gas emissions to combat climate change. As a result, utilities in the U.S. are investing heavily in CCS technology to modernize their infrastructure and meet stricter environmental standards.
Key players in the Global Power Generation Carbon Capture and Storage Market include Aker Solutions, Equinor ASA, Exxon Mobil Corporation, Fluor Corporation, General Electric, Mitsubishi Heavy Industries Ltd., NRG Energy, Inc., Shell CANSOLV, Siemens, and Linde plc, among others. To strengthen their position in the power generation carbon capture and storage market, companies are investing heavily in innovative CCS technologies, focusing on improving efficiency and reducing the cost of carbon capture. Strategic collaborations with government entities and energy companies are becoming more common to secure funding for large-scale CCS projects. Several companies are also developing and deploying pre-combustion and post-combustion capture systems, which can be integrated into existing power plants, offering a scalable solution for reducing emissions.
Table of Contents
Chapter 1 Methodology & Scope
- 1.1 Market definition
- 1.2 Base estimates & calculations
- 1.3 Forecast calculation
- 1.4 Data source
- 1.4.1 Primary
- 1.4.2 Secondary
- 1.4.2.1 Paid
- 1.4.2.2 Public
Chapter 2 Executive Summary
- 2.1 Industry synopsis, 2021 - 2034
Chapter 3 Industry Insights
- 3.1 Industry ecosystem analysis
- 3.2 Trump administration tariffs analysis
- 3.2.1 Impact on trade
- 3.2.1.1 Trade volume disruptions
- 3.2.1.2 Retaliatory measures
- 3.2.2 Impact on the industry
- 3.2.2.1 Supply-side impact (raw materials)
- 3.2.2.1.1 Price volatility in key materials
- 3.2.2.1.2 Supply chain restructuring
- 3.2.2.1.3 Production cost implications
- 3.2.2.2 Demand-side impact (selling price)
- 3.2.2.2.1 Price transmission to end markets
- 3.2.2.2.2 Market share dynamics
- 3.2.2.2.3 Consumer response patterns
- 3.2.2.1 Supply-side impact (raw materials)
- 3.2.3 Key companies impacted
- 3.2.4 Strategic industry responses
- 3.2.4.1 Supply chain reconfiguration
- 3.2.4.2 Pricing and product strategies
- 3.2.4.3 Policy engagement
- 3.2.1 Impact on trade
- 3.3 Outlook and future considerations
- 3.4 Industry impact forces
- 3.4.1 Growth drivers
- 3.4.2 Industry pitfalls & challenges
- 3.5 Growth potential analysis
- 3.6 Porter's analysis
- 3.6.1 Bargaining power of suppliers
- 3.6.2 Bargaining power of buyers
- 3.6.3 Threat of new entrants
- 3.6.4 Threat of substitutes
- 3.7 PESTEL analysis
Chapter 4 Competitive landscape, 2024
- 4.1 Introduction
- 4.2 Company market share
- 4.3 Strategic dashboard
- 4.4 Strategic initiative
- 4.5 Competitive benchmarking
- 4.6 Innovation & sustainability landscape
Chapter 5 Market Size and Forecast, By Technology, 2021 - 2034 (MTPA, USD Billion)
- 5.1 Key trends
- 5.2 Pre-combustion
- 5.3 Post combustion
- 5.4 Oxy-fuel combustion
Chapter 6 Market Size and Forecast, By Region, 2021 - 2034 (MTPA, USD Billion)
- 6.1 Key trends
- 6.2 North America
- 6.2.1 U.S.
- 6.2.2 Canada
- 6.3 Europe
- 6.3.1 Norway
- 6.3.2 Netherlands
- 6.3.3 UK
- 6.4 Asia Pacific
- 6.4.1 China
- 6.4.2 South Korea
- 6.4.3 Australia
- 6.5 Rest of the World
Chapter 7 Company Profiles
- 7.1 Air Liquide
- 7.2 Linde plc
- 7.3 Global Thermostat
- 7.4 General Electric
- 7.5 Siemens
- 7.6 Aker Solutions
- 7.7 HALLIBURTON
- 7.8 SLB
- 7.9 Exxon Mobil Corporation
- 7.10 Shell CANSOLV
- 7.11 Mitsubishi Heavy Industries Ltd.
- 7.12 Dakota Gasification Company
- 7.13 NRG Energy, Inc.
- 7.14 Fluor Corporation
- 7.15 Sulzer Ltd
- 7.16 Equinor ASA
 電力產業碳捕集與封存(CCS)市場:依技術類型、回收方法、電廠類型與部署模式分類-2026-2032年全球預測
 二氧化碳運輸基礎設施市場預測至2034年-按組件、運輸方式、技術、應用、最終用戶和地區分類的全球分析捕碳封存(CCS)市場:依服務、技術、終端用戶產業與儲存-2026-2032年全球市場預測
 2026年全球發電二氧化碳捕集與儲存市場報告
 2026-2030年全球碳捕獲與儲存(CCS)市場2026年全球二氧化碳捕集與封存技術市場報告2026年全球二氧化碳捕集與儲存市場報告2026年全球二氧化碳捕集與封存(CCS)市場報告
 二氧化碳捕集與儲存(CCS)市場規模、佔有率和趨勢分析報告:按捕獲技術、應用、地區和細分市場預測(2026-2033 年)
 2026-2034年全球發電領域二氧化碳捕集與儲存(CCS)市場規模、佔有率、趨勢及成長分析報告