


 |
市場調查報告書
商品編碼
1755359
工業真空幫浦市場機會、成長動力、產業趨勢分析及2025-2034年預測Industrial Vacuum Pump Market Opportunity, Growth Drivers, Industry Trend Analysis, and Forecast 2025 - 2034 |
||||||
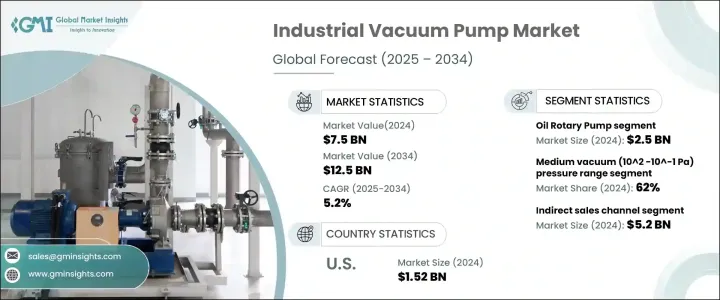
2024年,全球工業真空幫浦市場規模達75億美元,預計2034年將以5.2%的複合年成長率成長,達到125億美元,這主要得益於多個終端應用領域日益成長的需求。這些真空幫浦廣泛應用於需要精密製造和高純度加工的產業,為市場擴張做出了巨大貢獻。它們廣泛應用於需要受控環境的敏感操作領域,鞏固了其在工業工作流程中的重要性。
隨著半導體產業的發展,它刺激了互聯市場的需求。隨著工業自動化和清潔生產標準的提高,真空幫浦技術在全球的應用日益廣泛。然而,高昂的前期投資和持續的維護成本仍然是主要的限制因素,尤其對於小型企業而言。此外,營運複雜性和對技術專業知識的需求使得在低度開發地區採用該技術更具挑戰性,從而限制了其在新興市場的成長。
| 市場範圍 | |
|---|---|
| 起始年份 | 2024 |
| 預測年份 | 2025-2034 |
| 起始值 | 75億美元 |
| 預測值 | 125億美元 |
| 複合年成長率 | 5.2% |
許多地區都面臨著熟練技術人員短缺的問題,並且缺乏管理和維護現代真空系統所需的專業培訓課程。即使是常規的故障排除或維護也可能成為重大障礙,導致停機時間增加,設備壽命縮短。此外,技術人員配備的高成本,加上支援複雜機械的基礎設施有限,進一步阻礙了小型企業升級到先進的真空幫浦技術。
油旋轉幫浦市場在2024年創收25億美元,預計2034年將維持強勁成長勢頭,複合年成長率達5%。這類幫浦因其穩定的真空輸出以及在可變壓力條件下承受持續高要求運行的能力而備受推崇。其堅固的結構和高性能使其成為精度和一致性至關重要的工業環境中的首選解決方案。它們能夠適應嚴苛的製程環境,並最大程度地縮短停機時間,這進一步提升了其在材料加工、真空鍍膜等各個領域的應用。
從分銷角度來看,間接銷售領域在2024年創造了52億美元的收入,預計到2034年將以4.7%的複合年成長率成長。間接銷售的成功得益於完善的經銷商、經銷商和數位市場網路,這些網路提供豐富的真空幫浦產品選擇。這些管道簡化了最終用戶的採購流程,並提供增值服務,例如系統客製化、技術培訓、售後支援以及透過區域庫存實現更快的交付。
2024年,美國工業真空幫浦市場規模達15.2億美元,預計2034年複合年成長率將達5.2%。美國在電子、製藥和特種化學品等需要高純度製造製程的產業擁有先進的基礎設施,這進一步鞏固了其在工業真空幫浦市場的領先地位。政府對製造業現代化的支持以及自動化技術的廣泛整合,進一步增強了市場前景。
為全球工業真空幫浦市場做出貢獻的知名公司包括 Gardner Denver、Ebara Corporation、Pfeiffer Vacuum GmbH、Atlas Copco AB (Edwards)、ULVAC Inc.、Flowserve Corporation、Global Vac、Wintek Corporation、Ingersoll Rand Inc.、Busch Vacuum Solutions、Beckerxecker PKil Technologies. Technologies Peckera.alx.、Becker.alxx Technologies Peckera、Becker)。工業真空幫浦市場領導者採用的關鍵策略包括高度重視產品創新、產能擴張以及策略合併或合作。各公司正在投資研發,以推出節能和智慧真空技術,旨在提高自動化和數位整合度。與行業特定的 OEM 合作有助於拓寬其應用範圍。透過分銷網路進行地理擴張可確保更強大的區域足跡,而售後服務和客製化產品有助於提高客戶保留率。
目錄
第1章:方法論與範圍
第2章:執行摘要
第3章:行業洞察
- 產業生態系統分析
- 影響價值鏈的因素
- 利潤率分析
- 中斷
- 未來展望
- 製造商
- 經銷商
- 零售商
- 川普政府關稅的影響
- 貿易影響
- 貿易量中斷
- 報復措施
- 對產業的影響
- 供給側影響(原料)
- 主要材料價格波動
- 供應鏈重組
- 生產成本影響
- 需求面影響(客戶成本)
- 價格傳導至終端市場
- 市佔率動態
- 消費者反應模式
- 供給側影響(原料)
- 受影響的主要公司
- 策略產業反應
- 供應鏈重組
- 定價和產品策略
- 政策參與
- 展望與未來考慮
- 貿易影響
- 衝擊力
- 成長動力
- 半導體和電子產業需求不斷成長
- 化工和製藥業的擴張
- 食品和飲料行業的採用率不斷上升
- 製造業和工業流程的成長
- 產業陷阱與挑戰
- 初期投資及維護成本高
- 複雜性和技術挑戰
- 成長動力
- 技術與創新格局
- 成長潛力分析
- 監管格局
- 定價分析
- 波特的分析
- PESTEL分析
第4章:競爭格局
- 介紹
- 公司市佔率分析
- 競爭定位矩陣
- 戰略展望矩陣
第5章:市場估計與預測:按類型,2021 年至 2034 年
- 主要趨勢
- 液環真空幫浦
- 油旋轉泵
- 羅茨幫浦
- 乾式真空幫浦
- 多級羅茨真空泵
- 乾式螺桿真空泵
- 乾式渦旋真空泵
- 乾式隔膜真空泵
- 乾式旋片真空泵
- 乾式搖擺活塞真空泵
- 乾式旋轉烏鴉真空泵
- 乾式渦輪真空泵
第6章:市場估計與預測:依壓力範圍,2021 年至 2034 年
- 主要趨勢
- 低真空(10^5-10^2 Pa)
- 中真空(10^2-10^-1 Pa)
第7章:市場估計與預測:依規模,2021 年至 2034 年
- 主要趨勢
- 小型(< 10 立方公尺/小時)
- 中(10-100立方米/小時)
- 大型(> 100 m3/h)
第 8 章:市場估計與預測:按最終用途產業,2021 年至 2034 年
- 主要趨勢
- 半導體
- 水和廢水處理
- 化學品和石化產品
- 礦業
- 食品和飲料
- 建造
- 石油和天然氣
- 製藥
- 其他(農業、紡織等)
第9章:市場估計與預測:按配銷通路,2021 年至 2034 年
- 主要趨勢
- 直銷
- 間接銷售
第10章:市場估計與預測:按地區,2021 年至 2034 年
- 主要趨勢
- 北美洲
- 美國
- 加拿大
- 歐洲
- 德國
- 英國
- 法國
- 義大利
- 西班牙
- 亞太地區
- 中國
- 印度
- 日本
- 韓國
- 澳洲
- 馬來西亞
- 印尼
- 拉丁美洲
- 巴西
- 墨西哥
- MEA
- 沙烏地阿拉伯
- 阿拉伯聯合大公國
- 南非
第 11 章:公司簡介
- Agilent Technologies
- Atlas Copco AB (Edwards)
- Becker Pumps Corporation
- Busch Vacuum Solutions
- Ebara Corporation
- Flowserve Corporation
- Gardner Denver
- Global Vac
- Graham Corporation
- Ingersoll Rand Inc.
- Pfeiffer Vacuum GmbH
- Tsurumi Manufacturing Co. Ltd
- ULVAC Inc.
- Wintek Corporation
The Global Industrial Vacuum Pump Market was valued at USD 7.5 billion in 2024 and is estimated to grow at a CAGR of 5.2% to reach USD 12.5 billion by 2034, driven by the increasing demand across multiple end-use sectors. These vacuum pumps are extensively used in industries requiring precision manufacturing and high-purity processing, contributing significantly to market expansion. Their widespread application across sectors dealing with sensitive operations requiring a controlled environment has solidified their relevance in industrial workflows.
As the semiconductor segment advances, it fuels demand in interconnected markets. With rising industrial automation and cleaner production standards, vacuum pump technology is increasingly being adopted across the globe. Nevertheless, the high upfront investment and the ongoing maintenance costs remain major deterrents, especially for smaller companies. In addition, the operational complexity and the need for technical expertise make adoption more challenging in less advanced setups, creating growth limitations in emerging markets.
| Market Scope | |
|---|---|
| Start Year | 2024 |
| Forecast Year | 2025-2034 |
| Start Value | $7.5 Billion |
| Forecast Value | $12.5 Billion |
| CAGR | 5.2% |
Many of these regions face a shortage of skilled technicians and lack access to specialized training programs, essential for managing and maintaining modern vacuum systems. Even routine troubleshooting or maintenance can become a significant hurdle, leading to increased downtime and reduced equipment lifespan. Moreover, the high cost associated with technical staffing, coupled with limited infrastructure to support complex machinery, further deters smaller industries from upgrading to advanced vacuum pump technologies.
The oil rotary pump segment generated USD 2.5 billion in 2024 and is projected to maintain strong momentum with a CAGR of 5% through 2034. These pumps are particularly valued for their stable vacuum output and ability to withstand continuous, demanding operations under variable pressure conditions. Their robust construction and high performance make them a go-to solution in industrial environments where precision and consistency are mission-critical. Their adaptability to harsh process environments and minimal downtime further boost their utility across various sectors, from material processing to vacuum coating.
From a distribution standpoint, the indirect sales segment generated USD 5.2 billion in 2024 and is anticipated to grow at a CAGR of 4.7% through 2034. The success of indirect sales is driven by a well-established network of distributors, resellers, and digital marketplaces that offer a broad selection of vacuum pump products. These channels simplify procurement for end-users but provide value-added services like system customization, technical training, post-purchase support, and faster delivery through regional inventories.
United States Industrial Vacuum Pump Market was valued at USD 1.52 billion in 2024, projected to grow at a CAGR of 5.2% by 2034. This leadership is fueled by the country's advanced infrastructure in sectors requiring high-purity manufacturing processes, such as electronics, pharmaceuticals, and specialty chemicals. Government support for modernizing manufacturing and the widespread integration of automation technologies further strengthens the market outlook.
Prominent companies contributing to the Global Industrial Vacuum Pump Market include Gardner Denver, Ebara Corporation, Pfeiffer Vacuum GmbH, Atlas Copco AB (Edwards), ULVAC Inc., Flowserve Corporation, Global Vac, Wintek Corporation, Ingersoll Rand Inc., Busch Vacuum Solutions, Becker Pumps Corporation, Tsurumi Manufacturing Co. Ltd, Graham Corporation, and Agilent Technologies. Key strategies adopted by leading players in the industrial vacuum pump market include a strong focus on product innovation, capacity expansion, and strategic mergers or partnerships. Companies are investing in R&D to introduce energy-efficient and smart vacuum technologies, targeting increased automation and digital integration. Collaborations with industry-specific OEMs help broaden their application reach. Geographic expansion through distribution networks ensures stronger regional footprints, while after-sales services and customized offerings help boost customer retention.
Table of Contents
Chapter 1 Methodology & Scope
- 1.1 Market scope & definition
- 1.2 Base estimates & calculations
- 1.3 Forecast parameters
- 1.4 Data sources
- 1.4.1 Primary
- 1.4.2 Secondary
- 1.4.2.1 Paid sources
- 1.4.2.2 Public sources
Chapter 2 Executive Summary
- 2.1 Industry 3600 synopsis, 2021 - 2034
Chapter 3 Industry Insights
- 3.1 Industry ecosystem analysis
- 3.1.1 Factors affecting the value chain
- 3.1.2 Profit margin analysis
- 3.1.3 Disruptions
- 3.1.4 Future outlook
- 3.1.5 Manufacturers
- 3.1.6 Distributors
- 3.1.7 Retailers
- 3.2 Impact of Trump administration tariffs
- 3.2.1 Trade impact
- 3.2.1.1 Trade volume disruptions
- 3.2.1.2 Retaliatory measures
- 3.2.2 Impact on industry
- 3.2.2.1 Supply-side impact (raw materials)
- 3.2.2.1.1 Price volatility in key materials
- 3.2.2.1.2 Supply chain restructuring
- 3.2.2.1.3 Production cost implications
- 3.2.2.2 Demand-side impact (Cost to customers)
- 3.2.2.2.1 Price transmission to end markets
- 3.2.2.2.2 Market share dynamics
- 3.2.2.2.3 Consumer response patterns
- 3.2.2.1 Supply-side impact (raw materials)
- 3.2.3 Key companies impacted
- 3.2.4 Strategic industry responses
- 3.2.4.1 Supply chain reconfiguration
- 3.2.4.2 Pricing and product strategies
- 3.2.4.3 Policy engagement
- 3.2.5 Outlook & future considerations
- 3.2.1 Trade impact
- 3.3 Impact forces
- 3.3.1 Growth drivers
- 3.3.1.1 Increasing demand in semiconductor and electronics industry
- 3.3.1.2 Expansion in chemical and pharmaceutical industries
- 3.3.1.3 Rising adoption in food and beverage industry
- 3.3.1.4 Growth in manufacturing and industrial processes
- 3.3.2 Industry pitfalls & challenges
- 3.3.2.1 High initial investment and maintenance costs
- 3.3.2.2 Complexity and technical challenges
- 3.3.1 Growth drivers
- 3.4 Technology & innovation landscape
- 3.5 Growth potential analysis
- 3.6 Regulatory landscape
- 3.7 Pricing analysis
- 3.8 Porter's analysis
- 3.9 PESTEL analysis
Chapter 4 Competitive Landscape, 2024
- 4.1 Introduction
- 4.2 Company market share analysis
- 4.3 Competitive positioning matrix
- 4.4 Strategic outlook matrix
Chapter 5 Market Estimates & Forecast, By Type, 2021 – 2034, (USD Billion) (Million Units)
- 5.1 Key trends
- 5.2 Liquid ring vacuum pump
- 5.3 Oil rotary pump
- 5.4 Roots pump
- 5.5 Dry vacuum pump
- 5.6 Multi-stage roots vacuum pump
- 5.6.1 Dry screw vacuum pump
- 5.6.2 Dry scroll vacuum pump
- 5.6.3 Dry diaphragm vacuum pump
- 5.6.4 Dry rotary vane vacuum pump
- 5.6.5 Dry rocking piston vacuum pump
- 5.6.6 Dry rotary crow vacuum pump
- 5.6.7 Dry turbo vacuum pump
Chapter 6 Market Estimates & Forecast, By Pressure Range, 2021 – 2034, (USD Billion) (Million Units)
- 6.1 Key trends
- 6.2 Low vacuum (10^5-10^2 Pa)
- 6.3 Medium vacuum (10^2 -10^-1 Pa)
Chapter 7 Market Estimates & Forecast, By Size, 2021 – 2034, (USD Billion) (Million Units)
- 7.1 Key trends
- 7.2 Small (< 10 m3/h)
- 7.3 Medium (10-100 m3/h)
- 7.4 Large (> 100 m3/h)
Chapter 8 Market Estimates & Forecast, By End Use Industry, 2021 – 2034, (USD Billion) (Million Units)
- 8.1 Key trends
- 8.2 Semiconductor
- 8.3 Water & wastewater treatment
- 8.4 Chemicals and petrochemicals
- 8.5 Mining
- 8.6 Food and beverages
- 8.7 Construction
- 8.8 Oil & gas
- 8.9 Pharmaceutical
- 8.10 Others (Agricultural, textile, etc.)
Chapter 9 Market Estimates & Forecast, By Distribution Channel, 2021 – 2034, (USD Billion) (Million Units)
- 9.1 Key trends
- 9.2 Direct sales
- 9.3 Indirect sales
Chapter 10 Market Estimates & Forecast, By Region, 2021 – 2034, (USD Billion) (Million Units)
- 10.1 Key trends
- 10.2 North America
- 10.2.1 U.S.
- 10.2.2 Canada
- 10.3 Europe
- 10.3.1 Germany
- 10.3.2 UK
- 10.3.3 France
- 10.3.4 Italy
- 10.3.5 Spain
- 10.4 Asia Pacific
- 10.4.1 China
- 10.4.2 India
- 10.4.3 Japan
- 10.4.4 South Korea
- 10.4.5 Australia
- 10.4.6 Malaysia
- 10.4.7 Indonesia
- 10.5 Latin America
- 10.5.1 Brazil
- 10.5.2 Mexico
- 10.6 MEA
- 10.6.1 Saudi Arabia
- 10.6.2 UAE
- 10.6.3 South Africa
Chapter 11 Company Profiles (Business Overview, Financial Data, Product Landscape, Strategic Outlook, SWOT Analysis)
- 11.1 Agilent Technologies
- 11.2 Atlas Copco AB (Edwards)
- 11.3 Becker Pumps Corporation
- 11.4 Busch Vacuum Solutions
- 11.5 Ebara Corporation
- 11.6 Flowserve Corporation
- 11.7 Gardner Denver
- 11.8 Global Vac
- 11.9 Graham Corporation
- 11.10 Ingersoll Rand Inc.
- 11.11 Pfeiffer Vacuum GmbH
- 11.12 Tsurumi Manufacturing Co. Ltd
- 11.13 ULVAC Inc.
- 11.14 Wintek Corporation
 乾式真空幫浦市場機會、成長動力、產業趨勢分析及2025-2034年預測
 渦輪分子幫浦-全球市佔率及排名、總收入及需求預測(2025-2031年)
 實驗室真空幫浦市場:按泵浦類型、最終用戶、真空度、泵浦速和潤滑方式分類-2025-2032年全球預測流量控制市場:按組件、網路類型、材料類型、連接方式、類型、應用、最終用途分類 - 全球預測 2025-2032液環真空幫浦市場:依終端用戶產業、幫浦類型、密封介質、真空範圍、運轉速度、材質、銷售管道和馬達類型分類-2025-2032年全球預測真空幫浦市場按幫浦類型、技術、終端用戶產業、壓力範圍、工作階段、密封方式、額定功率和應用分類-2025年至2032年全球預測真空幫浦市場機會、成長動力、產業趨勢分析及2025-2034年預測
 2025年全球工業真空幫浦市場報告2025年全球液環真空幫浦市場報告2025年全球真空幫浦市場報告