


 |
市場調查報告書
商品編碼
1755354
小米市場機會、成長動力、產業趨勢分析及 2025 - 2034 年預測Millets Market Opportunity, Growth Drivers, Industry Trend Analysis, and Forecast 2025 - 2034 |
||||||
2024年,全球小米市場規模達153億美元,預計到2034年將以4.4%的複合年成長率成長,達到234億美元。這一成長主要源於消費者對富含纖維和蛋白質的健康無麩質食品日益成長的興趣。隨著人們對小米營養價值的認知不斷提高,小米在現代飲食中的應用也越來越普遍。消費者選擇小米不僅是為了傳統消費,也是為了其在功能性食品、健康飲食和永續飲食實踐中的作用。近年來,小米在許多新應用中佔據了一席之地,尤其是在烘焙食品、零食和飲料領域,它們不僅具有健康益處,還能改善口感和口感。
小米能夠抵禦惡劣的氣候條件,也使其成為水資源匱乏地區的可靠食物來源,這進一步凸顯了其對糧食安全的重要性。加工和產品開發的創新持續推動全球小米消費。隨著永續性在整個糧食體系中日益受到重視,小米正被視為氣候智慧型穀物,是環保飲食的理想選擇。城市市場對永續植物性食品的需求不斷成長,進一步支撐了小米市場的長期發展。
| 市場範圍 | |
|---|---|
| 起始年份 | 2024 |
| 預測年份 | 2025-2034 |
| 起始值 | 153億美元 |
| 預測值 | 234億美元 |
| 複合年成長率 | 4.4% |
支持性政策框架和製度激勵措施持續推動小米市場發展。全球範圍內的多項小米推廣舉措,大大提升了人們對小米食品產業的認知度,並推動了相關投資。各國政府和農業機構正在透過提供財政支持、打造價值鏈基礎設施以及培育小米產品開發領域的創業精神來鼓勵小米種植。這些措施不僅支持了農民,也有助於簡化分銷流程,拓寬小米產品在國內外市場的准入管道。
依品種分類,珍珠粟在2024年佔據市場主導地位,佔41.1%,市場規模達63億美元。每種小米品種都因其營養成分和對不同飲食的適應性而擁有獨特的價值。有些品種因其高蛋白或高鈣含量而備受青睞,而有些品種則因其在無麩質和純素飲食中的應用而日益受到關注。隨著全球需求持續轉向清潔標籤和防過敏食品,這些穀物在各地區都有強勁的成長機會。
基於自然屬性,到2024年,傳統小米將佔據主導地位,市佔率達89.5%,預計在預測期內將以5.8%的複合年成長率成長。由於價格實惠且易於獲取,此細分市場將繼續吸引更廣泛的消費者群體。然而,有機小米市場也正受到越來越多的關注,尤其是在城市市場,消費者正在尋求無化學成分和環保的食品選擇。政府推廣永續農業的計畫也增強了有機小米的吸引力。儘管有機小米目前的市場佔有率較小,但對清潔營養的需求不斷成長預計將推動其滲透,尤其是在高階零售場所和注重健康的人群中。
按形態細分,全穀物在2024年佔據了39.7%的市場佔有率,由於其營養豐富且加工程度低,依然保持著強勁的市場相關性。小米粉作為無麩質烘焙產品(包括餅乾、麵包和健康零食)的多功能配料,在全球範圍內持續受到歡迎。小米片在早餐穀物和零食棒中越來越受歡迎,反映出市場正與現代便捷消費模式保持一致。隨著飲食習慣的不斷變化,對以小米為基礎的即食和即食產品的需求也在不斷成長,這為製造商提供了在零售貨架上推出多樣化產品線的機會。
B2B 市場正在快速擴張,預計到 2034 年複合年成長率將達到 4.9%。這一成長主要源於食品製造商、機構買家和動物飼料生產商日益成長的需求,他們正將小米作為一種功能性和永續性的原料,廣泛應用於各種應用領域。小米被廣泛應用於包裝食品、學校膳食計劃和自有品牌健康食品中,這為大規模採購創造了機會。隨著越來越多的產業利用小米的健康和永續優勢,B2B 市場預計將迎來強勁成長動能。
從區域來看,亞太地區在2024年佔據了最大的收入佔有率,達到34.3%,這得益於高產量和不斷成長的國內消費。由於傳統的種植模式和日益增強的健康意識,該地區仍然是小米的主要產地。城鎮化、收入成長和農業扶持政策不僅推動了小米在傳統飲食中的使用,也推動了其在當代食品創新中的應用。
小米市場的主要參與者正在積極實施策略性舉措,以擴大市場覆蓋範圍並強化品牌定位。領先的公司正在投資產品創新,推出以小米為基礎的即食食品、零食、早餐穀物和無麩質烘焙食品,以滿足不斷變化的消費者偏好。許多公司正在與食品科技新創公司和研究機構合作,開發營養豐富的配方,以延長保存期限並提升口感,同時保留小米的天然益處。與零售連鎖店和電商平台建立策略合作夥伴關係也日益普遍,從而擴大了產品的知名度和消費者覆蓋範圍。
目錄
第1章:方法論與範圍
第2章:執行摘要
第3章:行業洞察
- 產業生態系統分析
- 供應商格局
- 利潤率
- 每個階段的增值
- 影響價值鏈的因素
- 中斷
- 產業衝擊力
- 成長動力
- 產業陷阱與挑戰
- 市場機會
- 成長潛力分析
- 監管格局
- 北美洲
- 歐洲
- 亞太地區
- 拉丁美洲
- 中東和非洲
- 波特的分析
- PESTEL分析
- 價格趨勢
- 按地區
- 按產品
- 未來市場趨勢
- 技術和創新格局
- 當前的技術趨勢
- 新興技術
- 專利態勢
- 貿易統計(HS編碼)
(註:僅提供重點國家的貿易統計)
- 主要進口國
- 主要出口國
- 永續性和環境方面
- 永續實踐
- 減少廢棄物的策略
- 生產中的能源效率
- 環保舉措
第4章:競爭格局
- 介紹
- 公司市佔率分析
- 按地區
- 北美洲
- 歐洲
- 亞太地區
- 拉丁美洲
- MEA
- 按地區
- 公司矩陣分析
- 主要市場參與者的競爭分析
- 競爭定位矩陣
- 關鍵進展
- 併購
- 夥伴關係與合作
- 新產品發布
- 擴張計劃
第5章:市場估計與預測:按類型,2021 - 2034 年
- 主要趨勢
- 珍珠粟(Bajra)
- 小米(Ragi)
- 穀子
- 黍
- 高粱(Jowar)
- 稷
- 科多小米
- 小小米
- 其他
第6章:市場估計與預測:依性質,2021 - 2034 年
- 主要趨勢
- 有機的
- 傳統的
第7章:市場估計與預測:按應用,2021 - 2034 年
- 主要趨勢
- 食物
- 烘焙產品
- 早餐麥片和粥
- 小吃和鹹味產品
- 嬰兒食品
- 傳統食物
- 其他
- 飲料
- 酒精飲料
- 非酒精飲料
- 動物飼料
- 家禽飼料
- 牛飼料
- 其他
- 營養保健品和膳食補充劑
- 其他
第8章:市場估計與預測:依形式,2021 - 2034 年
- 主要趨勢
- 全穀物
- 麵粉
- 薄片
- 即食
- 即食
- 其他
第9章:市場估計與預測:按配銷通路,2021 - 2034 年
- 主要趨勢
- B2B
- 食品製造商
- 動物飼料業
- HoReCa (飯店、餐廳、咖啡館)
- 其他
- B2C
- 超市和大賣場
- 專賣店
- 便利商店
- 網路零售
- 其他
第10章:市場估計與預測:按地區,2021 - 2034 年
- 主要趨勢
- 北美洲
- 美國
- 加拿大
- 歐洲
- 德國
- 英國
- 法國
- 西班牙
- 義大利
- 荷蘭
- 歐洲其他地區
- 亞太地區
- 中國
- 印度
- 日本
- 澳洲
- 韓國
- 亞太其他地區
- 拉丁美洲
- 巴西
- 墨西哥
- 阿根廷
- 拉丁美洲其他地區
- 中東和非洲
- 沙烏地阿拉伯
- 南非
- 阿拉伯聯合大公國
- 中東和非洲其他地區
第 11 章:公司簡介
- Nestle SA
- Archer Daniels Midland Company
- Cargill, Incorporated
- Bunge Limited
- Kellogg Company
- PepsiCo, Inc. (Quaker Oats)
- General Mills, Inc.
- Britannia Industries Ltd.
- ITC Limited
- Patanjali Ayurved Limited
- Organic India Pvt. Ltd.
- 24 Mantra Organic (Sresta Natural Bioproducts)
- Nature's Path Foods
- Bob's Red Mill Natural Foods
- Arrowhead Mills (Hain Celestial Group)
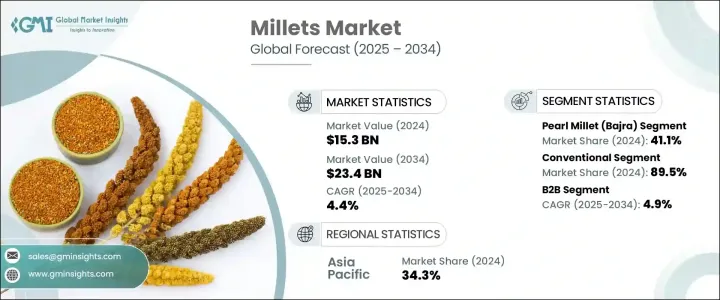
The Global Millets Market was valued at USD 15.3 billion in 2024 and is estimated to grow at a CAGR of 4.4% to reach USD 23.4 billion by 2034. This growth is largely driven by rising consumer interest in healthy, gluten-free foods rich in fiber and protein. With increasing awareness about the nutritional benefits of millets, their inclusion in modern diets is becoming more common. Consumers are turning to millets not just for traditional consumption but also for their role in functional foods, wellness diets, and sustainable food practices. In recent years, millets have found a place in a wide range of new applications, especially in baked goods, snacks, and beverages, where they offer not just health benefits but also improved texture and taste.
Their ability to withstand harsh climatic conditions also makes them a reliable food source in regions with limited water availability, reinforcing their importance for food security. Innovations in processing and product development continue to drive millet consumption globally. As sustainability becomes a stronger focus across food systems, millets are being recognized as climate-smart grains, ideal for environmentally-conscious diets. Growing demand in urban markets for sustainable and plant-based food products further supports the market's long-term trajectory.
| Market Scope | |
|---|---|
| Start Year | 2024 |
| Forecast Year | 2025-2034 |
| Start Value | $15.3 Billion |
| Forecast Value | $23.4 Billion |
| CAGR | 4.4% |
Supportive policy frameworks and institutional incentives continue to fuel this market. Several global efforts to promote millet have significantly contributed to building awareness and driving investment in millet-based food industries. Governments and agricultural bodies are encouraging millet cultivation by offering financial support, creating value-chain infrastructure, and fostering entrepreneurship in millet product development. Such measures not only support farmers but also help streamline distribution and widen accessibility for both domestic and international markets.
By type, pearl millet led the market in 2024, holding a share of 41.1%, which equates to a market size of USD 6.3 billion. Each millet variety holds unique value based on its nutrient profile and suitability for different diets. While some are favored for their high protein or calcium content, others are gaining interest for their use in gluten-free and vegan diets. As global demand continues to shift towards clean-label and allergen-friendly foods, these grains are securing strong growth opportunities across regions.
Based on nature, in 2024, conventional millets dominated with an 89.5% share and are expected to grow at a higher CAGR of 5.8% during the forecast period. This segment continues to appeal to a broader consumer base due to affordability and easy availability. However, the organic millet segment is also witnessing increased interest, especially in urban markets where consumers are seeking chemical-free and eco-friendly food options. Government programs that promote sustainable agriculture are also enhancing the appeal of organically produced millets. Although organic millets currently occupy a smaller share, rising demand for clean nutrition is expected to boost their penetration, particularly in premium retail spaces and health-conscious demographics.
When segmented by form, the whole grain accounted for 39.7% of the total market share in 2024, maintaining strong relevance due to its nutritional richness and minimal processing. Millet flour continues to gain popularity globally as a versatile ingredient in gluten-free bakery products, including cookies, breads, and health snacks. Flakes are increasingly favored for breakfast cereals and snack bars, reflecting the market's alignment with modern, convenience-driven consumption patterns. With evolving dietary habits, the demand for millet-based ready-to-cook and ready-to-eat offerings is also rising, providing manufacturers the opportunity to introduce diverse product lines across retail shelves.
The B2B segment is expanding rapidly, with a projected CAGR of 4.9% through 2034. This growth is driven by increased demand from food manufacturers, institutional buyers, and animal feed producers who are integrating millet as a functional and sustainable ingredient in a wide variety of applications. The integration of millets into packaged foods, school meal programs, and private-label health foods is opening up large-scale procurement opportunities. As more industries tap into the health and sustainability benefits of millets, the B2B segment is expected to witness strong momentum.
Regionally, Asia Pacific held the largest revenue share in 2024 at 34.3%, fueled by high production and rising domestic consumption. The region continues to be a stronghold for millets due to historical cultivation patterns and increasing health awareness. Urbanization, rising incomes, and supportive agriculture policies are boosting millet usage not only in traditional diets but also in contemporary food innovations.
Key players in the millets market are actively implementing strategic initiatives to expand their market footprint and strengthen brand positioning. Leading companies are investing in product innovation by launching millet-based ready-to-eat meals, snacks, breakfast cereals, and gluten-free bakery items to cater to evolving consumer preferences. Many are collaborating with food tech startups and research institutions to develop nutrient-dense formulations that enhance shelf life and taste while retaining the grains' natural benefits. Strategic partnerships with retail chains and e-commerce platforms are also becoming common, allowing broader product visibility and consumer reach.
Table of Contents
Chapter 1 Methodology & Scope
- 1.1 Market scope and definition
- 1.2 Research design
- 1.2.1 Research approach
- 1.2.2 Data collection methods
- 1.3 Data mining sources
- 1.3.1 Global
- 1.3.2 Regional/Country
- 1.4 Base estimates and calculations
- 1.4.1 Base year calculation
- 1.4.2 Key trends for market estimation
- 1.5 Primary research and validation
- 1.5.1 Primary sources
- 1.6 Forecast model
- 1.7 Research assumptions and limitations
Chapter 2 Executive Summary
- 2.1 Industry 3600 synopsis
- 2.2 Key market trends
- 2.2.1 Regional
- 2.2.2 Product
- 2.2.3 End use
- 2.3 TAM Analysis, 2025-2034
- 2.4 CXO perspectives: Strategic imperatives
- 2.4.1 Executive decision points
- 2.4.2 Critical success factors
- 2.5 Future Outlook and Strategic Recommendations
Chapter 3 Industry Insights
- 3.1 Industry ecosystem analysis
- 3.1.1 Supplier landscape
- 3.1.2 Profit margin
- 3.1.3 Value addition at each stage
- 3.1.4 Factor affecting the value chain
- 3.1.5 Disruptions
- 3.2 Industry impact forces
- 3.2.1 Growth drivers
- 3.2.2 Industry pitfalls and challenges
- 3.2.3 Market opportunities
- 3.3 Growth potential analysis
- 3.4 Regulatory landscape
- 3.4.1 North America
- 3.4.2 Europe
- 3.4.3 Asia Pacific
- 3.4.4 Latin America
- 3.4.5 Middle East & Africa
- 3.5 Porter's analysis
- 3.6 PESTEL analysis
- 3.6.1 Technology and innovation landscape
- 3.6.2 Current technological trends
- 3.6.3 Emerging technologies
- 3.7 Price trends
- 3.7.1 By region
- 3.7.2 By product
- 3.8 Future market trends
- 3.9 Technology and innovation landscape
- 3.9.1 Current technological trends
- 3.9.2 Emerging technologies
- 3.10 Patent Landscape
- 3.11 Trade statistics (HS code)
( Note: the trade statistics will be provided for key countries only)
- 3.11.1 Major importing countries
- 3.11.2 Major exporting countries
- 3.12 Sustainability and environmental aspects
- 3.12.1 Sustainable practices
- 3.12.2 Waste reduction strategies
- 3.12.3 Energy efficiency in production
- 3.12.4 Eco-friendly Initiatives
Chapter 4 Competitive Landscape, 2024
- 4.1 Introduction
- 4.2 Company market share analysis
- 4.2.1 By region
- 4.2.1.1 North America
- 4.2.1.2 Europe
- 4.2.1.3 Asia Pacific
- 4.2.1.4 LATAM
- 4.2.1.5 MEA
- 4.2.1 By region
- 4.3 Company matrix analysis
- 4.4 Competitive analysis of major market players
- 4.5 Competitive positioning matrix
- 4.6 Key developments
- 4.6.1 Mergers & acquisitions
- 4.6.2 Partnerships & collaborations
- 4.6.3 New product launches
- 4.6.4 Expansion plans
Chapter 5 Market Estimates and Forecast, By Type, 2021 - 2034 (USD Billion) (Kilo Tons)
- 5.1 Key trends
- 5.2 Pearl millet (Bajra)
- 5.3 Finger millet (Ragi)
- 5.4 Foxtail millet
- 5.5 Proso millet
- 5.6 Sorghum (Jowar)
- 5.7 Barnyard millet
- 5.8 Kodo millet
- 5.9 Little millet
- 5.10 Others
Chapter 6 Market Estimates and Forecast, By Nature, 2021 - 2034 (USD Billion) (Kilo Tons)
- 6.1 Key trends
- 6.2 Organic
- 6.3 Conventional
Chapter 7 Market Estimates and Forecast, By Application, 2021 - 2034 (USD Billion) (Kilo Tons)
- 7.1 Key trends
- 7.2 Food
- 7.2.1 Bakery products
- 7.2.2 Breakfast cereals & porridges
- 7.2.3 Snacks & savory products
- 7.2.4 Infant food
- 7.2.5 Traditional foods
- 7.2.6 Others
- 7.3 Beverages
- 7.3.1 Alcoholic beverages
- 7.3.2 Non-alcoholic beverages
- 7.4 Animal feed
- 7.4.1 Poultry feed
- 7.4.2 Cattle feed
- 7.4.3 Others
- 7.5 Nutraceuticals & dietary supplements
- 7.6 Others
Chapter 8 Market Estimates and Forecast, By Form, 2021 - 2034 (USD Billion) (Kilo Tons)
- 8.1 Key trends
- 8.2 Whole grain
- 8.3 Flour
- 8.4 Flakes
- 8.5 Ready-to-cook
- 8.6 Ready-to-eat
- 8.7 Others
Chapter 9 Market Estimates and Forecast, By Distribution Channel, 2021 - 2034 (USD Billion) (Kilo Tons)
- 9.1 Key trends
- 9.2 B2B
- 9.2.1 Food manufacturers
- 9.2.2 Animal feed industry
- 9.2.3 HoReCa (Hotels, Restaurants, Cafes)
- 9.2.4 Others
- 9.3 B2C
- 9.3.1 Supermarkets & Hypermarkets
- 9.3.2 Specialty stores
- 9.3.3 Convenience stores
- 9.3.4 Online retail
- 9.3.5 Others
Chapter 10 Market Estimates and Forecast, By Region, 2021 - 2034 (USD Billion) (Kilo Tons)
- 10.1 Key trends
- 10.2 North America
- 10.2.1 U.S.
- 10.2.2 Canada
- 10.3 Europe
- 10.3.1 Germany
- 10.3.2 UK
- 10.3.3 France
- 10.3.4 Spain
- 10.3.5 Italy
- 10.3.6 Netherlands
- 10.3.7 Rest of Europe
- 10.4 Asia Pacific
- 10.4.1 China
- 10.4.2 India
- 10.4.3 Japan
- 10.4.4 Australia
- 10.4.5 South Korea
- 10.4.6 Rest of Asia Pacific
- 10.5 Latin America
- 10.5.1 Brazil
- 10.5.2 Mexico
- 10.5.3 Argentina
- 10.5.4 Rest of Latin America
- 10.6 Middle East and Africa
- 10.6.1 Saudi Arabia
- 10.6.2 South Africa
- 10.6.3 UAE
- 10.6.4 Rest of Middle East and Africa
Chapter 11 Company Profiles
- 11.1 Nestle S.A.
- 11.2 Archer Daniels Midland Company
- 11.3 Cargill, Incorporated
- 11.4 Bunge Limited
- 11.5 Kellogg Company
- 11.6 PepsiCo, Inc. (Quaker Oats)
- 11.7 General Mills, Inc.
- 11.8 Britannia Industries Ltd.
- 11.9 ITC Limited
- 11.10 Patanjali Ayurved Limited
- 11.11 Organic India Pvt. Ltd.
- 11.12 24 Mantra Organic (Sresta Natural Bioproducts)
- 11.13 Nature's Path Foods
- 11.14 Bob's Red Mill Natural Foods
- 11.15 Arrowhead Mills (Hain Celestial Group)
 小米市場-2026-2031年預測
 小米市場規模、佔有率及成長分析(按類型、應用、通路和地區分類)-2026-2033年產業預測
 小米的全球市場
 雜項穀物市場規模、佔有率及成長分析(按類型、應用、通路和地區)-產業預測,2025 年至 2032 年