


 |
市場調查報告書
商品編碼
1750585
濕式煙氣脫硫系統市場機會、成長動力、產業趨勢分析及2025-2034年預測Wet Flue Gas Desulfurization System Market Opportunity, Growth Drivers, Industry Trend Analysis, and Forecast 2025 - 2034 |
||||||
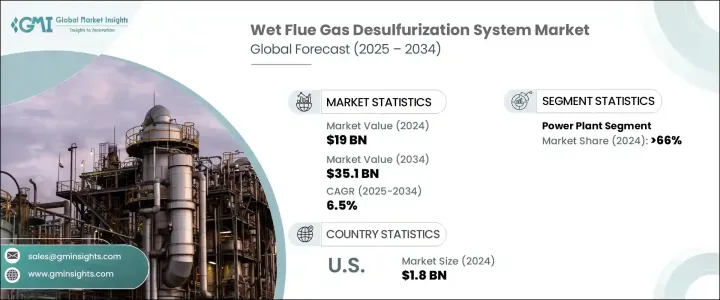
2024年,全球濕式煙氣脫硫系統市場規模達190億美元,預計到2034年將以6.5%的複合年成長率成長,達到351億美元。這得歸功於全球日益重視清潔能源,以及旨在減少工業生產(尤其是發電)二氧化硫(SO2)排放的更嚴格的環境法規。採用濕式菸氣脫硫系統對於各行業遵守這些法規並減輕其環境影響至關重要。
技術進步顯著提高了濕式煙氣脫硫 (WFGD) 系統的效率和成本效益。吸收材料和系統設計的創新增強了二氧化硫 (SO2) 的去除能力,使這些系統更容易工業應用。能夠根據特定排放標準客製化 WFGD 系統,進一步促進了其廣泛應用。能夠根據特定排放標準客製化 WFGD 系統,進一步促進了其廣泛應用。各行各業越來越青睞根據區域監管框架量身定做的解決方案,這使得 WFGD 系統成為靈活的排放控制選擇。這種適應性確保了其符合當前和未來的環境政策,這在各國政府持續收緊污染標準的背景下至關重要。此外,生產合成石膏等可用於建築材料的副產品,也為這些系統增加了經濟價值。工業界現在可以將二氧化硫捕獲物轉化為用於乾牆、水泥和農產品的創收材料,而不是將其作為廢物處理。
| 市場範圍 | |
|---|---|
| 起始年份 | 2024 |
| 預測年份 | 2025-2034 |
| 起始值 | 190億美元 |
| 預測值 | 351億美元 |
| 複合年成長率 | 6.5% |
發電業仍然是最大的應用領域,到2024年將佔66%的佔有率,這歸因於燃煤電廠的高二氧化硫排放量以及嚴格的排放管理法規。亞太地區,尤其是中國和印度,正在經歷快速的工業化進程,污染程度不斷上升,對有效的排放控制技術的需求也日益成長。
2024年,美國濕式菸氣脫硫系統市場規模達18億美元,這得益於嚴格的監管措施,例如《汞和空氣毒物標準》(MATS) 和《跨州空氣污染規則》(CSAPR),這些措施限制了發電廠的二氧化硫排放。遵守這些法規需要實施先進的排放控制技術,包括濕式煙氣脫硫系統 (WFGD)。
濕式煙氣脫硫系統市場的主要參與者包括 CECO Environmental、KC Cottrell India、Hitachi Zosen Inova AG、Marsulex Environmental、KC Cottrell India、Hitachi Zosen Inova AG、Marsulex Environmental、KC Cottrell India、Hitachi Zosen Inova AG、Marsulex Environmental、KC Cottrell India、Hitachi Zosen Inova AG、Marsulex Environmental、KC Cottrell India、Hitachi Zosen Inova AG、Marsulex Environmental、KC 托尼亞Holding AB、通用電氣、SA HAMON、Tri-Mer Corporation 和 Thermax Limited。這些公司致力於擴大產品供應並提高系統效率,以滿足不斷變化的市場需求。策略合作夥伴關係、技術創新和對永續發展的承諾是增強其市場地位和競爭力的關鍵策略。
目錄
第1章:方法論與範圍
第2章:執行摘要
第3章:行業洞察
- 產業生態系統分析
- 川普政府關稅分析
- 對貿易的影響
- 貿易量中斷
- 報復措施
- 對產業的影響
- 供應方影響(原料)
- 主要材料價格波動
- 供應鏈重組
- 生產成本影響
- 需求面影響(售價)
- 價格傳導至終端市場
- 市佔率動態
- 消費者反應模式
- 供應方影響(原料)
- 受影響的主要公司
- 策略產業反應
- 供應鏈重組
- 定價和產品策略
- 政策參與
- 展望與未來考慮
- 對貿易的影響
- 監管格局
- 產業衝擊力
- 成長動力
- 產業陷阱與挑戰
- 成長潛力分析
- 波特的分析
- PESTEL分析
第4章:競爭格局
- 介紹
- 公司市佔率分析
- 戰略儀表板
- 策略舉措
- 競爭基準測試
- 創新與永續發展格局
第5章:市場規模及預測:依應用,2021 - 2034
- 主要趨勢
- 發電廠
- 化工和石化
- 水泥
- 金屬加工和採礦
- 製造業
- 其他
第6章:市場規模及預測:依地區,2021 - 2034
- 主要趨勢
- 北美洲
- 美國
- 加拿大
- 墨西哥
- 歐洲
- 德國
- 英國
- 法國
- 西班牙
- 義大利
- 荷蘭
- 亞太地區
- 中國
- 印度
- 日本
- 韓國
- 印尼
- 澳洲
- 中東和非洲
- 沙烏地阿拉伯
- 阿拉伯聯合大公國
- 南非
- 拉丁美洲
- 巴西
- 智利
- 阿根廷
第7章:公司簡介
- Babcock & Wilcox Enterprises, Inc.
- CECO Environmental
- Ducon Infratechnologies Ltd.
- GEA Group Aktiengesellschaft
- General Electric
- Hitachi Zosen Inova AG
- KC Cottrell India
- KCH Services, Inc.
- Marsulex Environmental Technologies
- Mitsubishi Heavy Industries Ltd.
- Nederman Holding AB
- SA HAMON
- Thermax Limited.
- Tri-Mer Corporation
- Valmet
- Verantis Environmental Solutions Group
The Global Wet Flue Gas Desulfurization System Market was valued at USD 19 billion in 2024 and is estimated to grow at a CAGR of 6.5% to reach USD 35.1 billion by 2034 driven by the increasing global emphasis on cleaner energy sources and stricter environmental regulations aimed at reducing sulfur dioxide (SO?) emissions from industrial processes, particularly in power generation. Adopting WFGD systems is essential for industries to comply with these regulations and mitigate their environmental impact.
Technological advancements have significantly improved the efficiency and cost-effectiveness of WFGD systems. Innovations in absorbent materials and system designs have enhanced SO? removal capabilities, making these systems more accessible to industries. The ability to customize WFGD systems to meet specific emission standards further contributes to their widespread adoption. The ability to customize WFGD systems to meet specific emission standards further contributes to their widespread adoption. Industries are increasingly favoring solutions tailored to align with regional regulatory frameworks, making WFGD systems a flexible choice for emission control. This adaptability ensures compliance with current and future environmental policies, essential as governments continue tightening pollution standards. Additionally, the production of by-products like synthetic gypsum, which can be utilized in construction materials, adds economic value to these systems. Instead of treating sulfur dioxide capture as waste, industries can now convert it into a revenue-generating material used in drywall, cement, and agricultural products.
| Market Scope | |
|---|---|
| Start Year | 2024 |
| Forecast Year | 2025-2034 |
| Start Value | $19 Billion |
| Forecast Value | $35.1 Billion |
| CAGR | 6.5% |
The power generation sector remains the largest application segment, accounting for 66% share in 2024, attributed to the high SO? emissions associated with coal-fired power plants and the stringent regulations governing these emissions. The Asia Pacific region, particularly China and India, is experiencing rapid industrialization, increasing pollution levels, and a heightened demand for effective emission control technologies.
United States Wet Flue Gas Desulfurization System Market was valued at USD 1.8 billion in 2024, fueled by stringent regulatory measures, such as the Mercury and Air Toxics Standards (MATS) and the Cross-State Air Pollution Rule (CSAPR), which limit SO? emissions from power plants. Compliance with these regulations necessitates the implementation of advanced emission control technologies, including WFGD systems.
Key players in the Wet Flue Gas Desulfurization System Market include CECO Environmental, KC Cottrell India, Hitachi Zosen Inova AG, Marsulex Environmental Technologies, Verantis Environmental Solutions Group, KCH Services, Inc., Mitsubishi Heavy Industries Ltd., Valmet Corporation, GEA Group Aktiengesellschaft, Babcock & Wilcox Enterprises, Inc., Ducon Infratechnologies Ltd., Nederman Holding AB, General Electric, S.A. HAMON, Tri-Mer Corporation, and Thermax Limited. These companies are focusing on expanding their product offerings and enhancing system efficiencies to meet the evolving demands of the market. Strategic partnerships, technological innovations, and a commitment to sustainability are key strategies employed to strengthen their market presence and competitiveness.
Table of Contents
Chapter 1 Methodology & Scope
- 1.1 Market scope & definitions
- 1.2 Market estimates & forecast parameters
- 1.3 Forecast calculation
- 1.4 Data sources
- 1.4.1 Primary
- 1.4.2 Secondary
- 1.4.2.1 Paid
- 1.4.2.2 Public
Chapter 2 Executive Summary
- 2.1 Industry synopsis, 2021 - 2034
Chapter 3 Industry Insights
- 3.1 Industry ecosystem analysis
- 3.2 Trump administration tariffs analysis
- 3.2.1 Impact on trade
- 3.2.1.1 Trade volume disruptions
- 3.2.1.2 Retaliatory measures
- 3.2.2 Impact on the industry
- 3.2.2.1 Supply-side impact (raw materials)
- 3.2.2.1.1 Price volatility in key materials
- 3.2.2.1.2 Supply chain restructuring
- 3.2.2.1.3 Production cost implications
- 3.2.2.2 Demand-side impact (selling price)
- 3.2.2.2.1 Price transmission to end markets
- 3.2.2.2.2 Market share dynamics
- 3.2.2.2.3 Consumer response patterns
- 3.2.2.1 Supply-side impact (raw materials)
- 3.2.3 Key companies impacted
- 3.2.4 Strategic industry responses
- 3.2.4.1.1 Supply chain reconfiguration
- 3.2.4.1.2 Pricing and product strategies
- 3.2.4.1.3 Policy engagement
- 3.2.5 Outlook and future considerations
- 3.2.1 Impact on trade
- 3.3 Regulatory landscape
- 3.4 Industry impact forces
- 3.4.1 Growth drivers
- 3.4.2 Industry pitfalls & challenges
- 3.5 Growth potential analysis
- 3.6 Porter's analysis
- 3.6.1 Bargaining power of suppliers
- 3.6.2 Bargaining power of buyers
- 3.6.3 Threat of new entrants
- 3.6.4 Threat of substitutes
- 3.7 PESTEL analysis
Chapter 4 Competitive Landscape, 2025
- 4.1 Introduction
- 4.2 Company market share analysis, 2024
- 4.3 Strategic dashboard
- 4.4 Strategic initiative
- 4.5 Competitive benchmarking
- 4.6 Innovation & sustainability landscape
Chapter 5 Market Size and Forecast, By Application, 2021 - 2034 (USD Billion)
- 5.1 Key trends
- 5.2 Power plants
- 5.3 Chemical & petrochemical
- 5.4 Cement
- 5.5 Metal processing & mining
- 5.6 Manufacturing
- 5.7 Others
Chapter 6 Market Size and Forecast, By Region, 2021 - 2034 (USD Billion)
- 6.1 Key trends
- 6.2 North America
- 6.2.1 U.S.
- 6.2.2 Canada
- 6.2.3 Mexico
- 6.3 Europe
- 6.3.1 Germany
- 6.3.2 UK
- 6.3.3 France
- 6.3.4 Spain
- 6.3.5 Italy
- 6.3.6 Netherlands
- 6.4 Asia Pacific
- 6.4.1 China
- 6.4.2 India
- 6.4.3 Japan
- 6.4.4 South Korea
- 6.4.5 Indonesia
- 6.4.6 Australia
- 6.5 Middle East & Africa
- 6.5.1 Saudi Arabia
- 6.5.2 UAE
- 6.5.3 South Africa
- 6.6 Latin America
- 6.6.1 Brazil
- 6.6.2 Chile
- 6.6.3 Argentina
Chapter 7 Company Profiles
- 7.1 Babcock & Wilcox Enterprises, Inc.
- 7.2 CECO Environmental
- 7.3 Ducon Infratechnologies Ltd.
- 7.4 GEA Group Aktiengesellschaft
- 7.5 General Electric
- 7.6 Hitachi Zosen Inova AG
- 7.7 KC Cottrell India
- 7.8 KCH Services, Inc.
- 7.9 Marsulex Environmental Technologies
- 7.10 Mitsubishi Heavy Industries Ltd.
- 7.11 Nederman Holding AB
- 7.12 S.A. HAMON
- 7.13 Thermax Limited.
- 7.14 Tri-Mer Corporation
- 7.15 Valmet
- 7.16 Verantis Environmental Solutions Group
 洗滌器(FGDs)
 廢氣脫硫系統市場:按類型、組件、技術、安裝配置和最終用戶分類-2026-2032年全球市場預測工業廢氣脫硫塔市場:依技術、材料、安裝、塔型和最終用戶分類,全球預測(2026-2032)
 全球廢氣脫硫市場規模、佔有率、趨勢及成長分析報告(2026-2034年)
 2026年全球濕式煙氣脫硫系統市場報告2026年全球煙道氣體脫硫系統市場報告
 煙氣脫硫市場 - 全球產業規模、佔有率、趨勢、機會及預測(按類型、終端用戶產業、安裝量、地區和競爭格局分類,2021-2031年)
 排煙脫硫(FGD)市場按材料類型、最終用途行業和地區分類沼氣脫硫市場依技術、應用、原料、終端用戶及工廠產能分類,全球預測(2026-2032年)
 排煙脫硫系統市場規模、佔有率及成長分析(依技術、應用、吸附劑類型、安裝類型及地區分類)-2026-2033年產業預測