


 |
市場調查報告書
商品編碼
1750579
赤藻醣醇市場機會、成長動力、產業趨勢分析及 2025 - 2034 年預測Erythritol Market Opportunity, Growth Drivers, Industry Trend Analysis, and Forecast 2025 - 2034 |
||||||
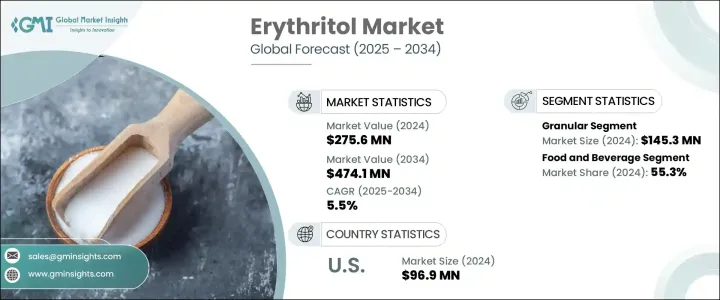
2024年,全球赤藻醣醇市場規模達2.756億美元,預計到2034年將以5.5%的複合年成長率成長,達到4.741億美元,這主要得益於消費者健康意識的提升以及對低卡路里和無糖產品的需求。隨著越來越多的人追求更健康的生活方式,赤藻醣醇作為烘焙食品、糖果和飲料等食品和飲料中的糖替代品越來越受歡迎。這一趨勢在歐洲和北美尤為明顯,這些地區向糖替代品的轉變刺激了市場的大幅擴張。此外,亞太和拉丁美洲新興市場對赤藻醣醇的日益接受也進一步支持了其持續成長。隨著這些地區經濟的成長和消費者健康意識的提升,赤藻醣醇的市場滲透率預計將持續成長。
天然和植物性食品原料的興起,正契合人們對更健康、更永續食品日益成長的需求,推動了市場發展。赤藻醣醇作為一種植物來源的糖醇,完美契合了這一趨勢,並受到尋求傳統醣類替代品的消費者的青睞。市場的整體成長反映了全球對健康生活方式的追求,推動了對赤藻醣醇等醣類替代品的持續需求。
| 市場範圍 | |
|---|---|
| 起始年份 | 2024 |
| 預測年份 | 2025-2034 |
| 起始值 | 2.756億美元 |
| 預測值 | 4.741億美元 |
| 複合年成長率 | 5.5% |
2024年,赤藻醣醇顆粒市場規模達1.453億美元,預計2025年至2034年期間的複合年成長率為5.6%,這得益於其易用性以及在各種應用領域的多功能性,尤其是在食品和飲料製造領域。赤藻醣醇的質地和甜度與糖非常相似,是烘焙食品、飲料和糖果的理想選擇。此外,赤藻醣醇易於計量和在配方中混合,也使其在住宅和商業環境中廣泛應用。顆粒狀赤藻醣醇尤其受歡迎,因為它能夠提供類似糖的口感,且不增加卡路里,為消費者提供了更健康的選擇。
食品飲料業,2024年市場規模達1.524億美元,預計2034年複合年成長率將達5.7%。消費者對更健康、低熱量和無糖產品的偏好日益成長,推動了該行業對赤藻醣醇的需求。赤藻醣醇的低升糖指數,加上其在烘焙過程中耐高溫的特性,使其成為製作各種食品(從餅乾到蛋糕和糕點)的理想選擇。
2024年,美國赤藻醣醇市場規模達9,690萬美元,預估至2034年複合年成長率為5.5%。受低碳水化合物和生酮飲食的流行推動,東北部和西部等地區對赤藻醣醇的需求強勁。隨著人們日益意識到醣類消費帶來的健康風險,赤藻醣醇在加工食品、飲料和點心中的使用量不斷增加,從而推動了市場的成長。
全球赤藻醣醇市場的主要參與者包括Foodchem International Corporation、泰萊公司、嘉吉公司、瑞士榮本茨勞爾公司和山東三元生物科技股份有限公司。各公司正透過專注於產品創新、拓展分銷管道以及投資開發永續生產方法來鞏固其市場地位,以滿足日益成長的天然甜味劑需求。為了提升其在赤藻醣醇市場的佔有率,各公司正在採取多項關鍵策略。這些策略包括專注於生產流程的技術進步以提高效率並降低成本,以及擴展產品組合以提供更廣泛的糖替代品。此外,領先的製造商正在與食品和飲料行業的主要參與者建立策略合作夥伴關係,以擴大市場准入並觸及新的消費群體。
目錄
第1章:方法論與範圍
第2章:執行摘要
第3章:行業洞察
- 產業生態系統分析
- 影響價值鏈的因素
- 利潤率分析
- 中斷
- 未來展望
- 製造商
- 經銷商
- 川普政府關稅
- 對貿易的影響
- 貿易量中斷
- 報復措施
- 對產業的影響
- 供應方影響(原料)
- 主要材料價格波動
- 供應鏈重組
- 生產成本影響
- 供應方影響(原料)
- 需求面影響(售價)
- 價格傳導至終端市場
- 市佔率動態
- 消費者反應模式
- 受影響的主要公司
- 策略產業反應
- 供應鏈重組
- 定價和產品策略
- 政策參與
- 展望與未來考慮
- 對貿易的影響
- 貿易統計(HS編碼)
- 2021-2024年主要出口國
- 2021-2024年主要進口國
註:以上貿易統計僅針對重點國家。
- 供應商格局
- 利潤率分析
- 重要新聞和舉措
- 監管格局
- FDA 法規和 GRAS 狀態
- 歐洲食品安全局(EFSA)指南
- 亞太監管環境
- 國際標準和認證
- 衝擊力
- 成長動力
- 對低熱量和無糖食品的需求不斷增加
- 消費者健康意識不斷增強
- 植物性和天然食品成分趨勢的成長
- 生酮飲食和低碳水化合物飲食的流行
- 產業陷阱與挑戰
- 與其他甜味劑相比,生產成本較高
- 新興市場消費者意識有限
- 成長動力
- 交易分析
- 進出口場景
- 關稅和非關稅壁壘
- 反傾銷措施和貿易爭端
- 自由貿易協定的影響
- 技術格局
- 現有的生產技術
- 發酵製程創新
- 純化和結晶技術
- 新興技術與專利
- 定價分析
- 價格趨勢(2021-2024年)
- 成本結構分析
- 定價策略評估
- 區域價格差異
- 價值鏈分析
- 原物料採購和供應商
- 製造和加工
- 分銷管道
- 最終用途應用
- 產業影響分析
- Covid-19影響評估
- 俄烏戰爭的影響
- 經濟衰退因素
- 供應鏈中斷
- 成長潛力分析
- 波特的分析
- PESTEL分析
第4章:競爭格局
- 介紹
- 公司市佔率分析
- 全球市佔率分佈
- 區域市佔率分析
- 關鍵參與者的層級分析
- 競爭基準測試
- 產品組合比較
- 生產能力評估
- 定價策略比較
- 分銷網路實力
- 研發能力與創新
- 策略舉措
- 併購
- 合資企業和合作夥伴關係
- 產能擴張
- 新產品發布
- 技術合作
- 競爭定位矩陣
- 市場領導者
- 新興企業
- 創新者
- 利基市場參與者
- 戰略儀表板
- Growth strategies
- Market penetration approaches
- Diversification tactics
- Sustainability initiatives
第5章:市場估計與預測:依形式,2021-2034
- 主要趨勢
- 粉末
- 顆粒狀
- 液體
第6章:市場估計與預測:依純度等級,2021-2034
- 主要趨勢
- 高純度(≥99%)
- 標準純度(95-98%)
- 其他
第7章:市場估計與預測:按應用,2021-2034
- 主要趨勢
- 食品和飲料
- 烘焙和糖果
- 飲料
- 乳製品
- 冷凍甜點
- 其他
- 製藥
- 片劑和膠囊
- 糖漿和混懸液
- 其他
- 個人護理和化妝品
- 口腔護理產品
- 保養產品
- 其他
- 其他
- 農業應用
- 工業用途
第8章:市場估計與預測:按地區,2021-2034
- 主要趨勢
- 北美洲
- 美國
- 加拿大
- 墨西哥
- 歐洲
- 英國
- 德國
- 法國
- 義大利
- 西班牙
- 俄羅斯
- 亞太地區
- 中國
- 印度
- 日本
- 韓國
- 澳洲
- 拉丁美洲
- 巴西
- 阿根廷
- MEA
- 南非
- 沙烏地阿拉伯
- 阿拉伯聯合大公國
第9章:公司簡介
- Baolingbao Biology Co., Ltd.
- Cargill, Inc.
- Changzhou Niutang Chemical Plant Co., Ltd.
- Foodchem International Corporation
- Futaste Co., Ltd.
- Ingredion Incorporated
- Jungbunzlauer Suisse AG
- Mitsubishi Chemical Group Corporation
- Nikken Chemical Co., Ltd.
- RAJVI ENTERPRISE
- Shandong Sanyuan Biotechnology Co., Ltd.
- Tate & Lyle PLC
- Xiwang Group
- Zibo ZhongShi GeRui Biotech Co., Ltd.
The Global Erythritol Market was valued at USD 275.6 million in 2024 and is estimated to grow at a CAGR of 5.5% to reach USD 474.1 million by 2034, driven by the health awareness among consumers and the demand for low-calorie and sugar-free products. As more individuals turn to healthier lifestyles, erythritol has gained popularity as a sugar substitute in foods and beverages such as baked goods, confectionery, and beverages. This trend is especially notable in Europe and North America, where the shift toward sugar alternatives has spurred significant market expansion. In addition, the increasing adoption of erythritol in emerging markets across Asia-Pacific and Latin America further supports its continued growth. As these regions grow economically and health-conscious consumer habits evolve, erythritol's market penetration is expected to increase consistently.
The market benefits from the rise in natural and plant-based food ingredients, which align with the growing demand for healthier and more sustainable options. Erythritol, as a plant-derived sugar alcohol, fits seamlessly into this trend, gaining favor with consumers seeking alternatives to traditional sugars. The overall growth of the market reflects the global push toward healthier living, driving sustained demand for sugar substitutes like erythritol.
| Market Scope | |
|---|---|
| Start Year | 2024 |
| Forecast Year | 2025-2034 |
| Start Value | $275.6 Million |
| Forecast Value | $474.1 Million |
| CAGR | 5.5% |
In 2024, the granular segment of the erythritol market was valued at USD 145.3 million and is projected to grow at a CAGR of 5.6% from 2025 to 2034 due to its ease of use and versatility in various applications, especially in food and beverage manufacturing. It closely resembles sugar in both texture and sweetness, making it ideal for baked goods, beverages, and confectionery. Its ability to be measured and mixed easily in recipes also contributes to its widespread adoption in residential and commercial settings. The granular form is particularly favored for its ability to deliver a sugar-like taste without the added calories, offering a healthier alternative for consumers.
The food & beverage sector, which accounted for USD 152.4 million in 2024 and is expected to grow at a CAGR of 5.7% through 2034. The demand for erythritol in this sector is driven by increasing consumer preference for healthier, low-calorie, and sugar-free products. Erythritol's low glycemic index, along with its ability to withstand high heat during baking, makes it an ideal choice for creating a wide range of food products, from cookies to cakes and pastries.
United States Erythritol Market was valued at USD 96.9 million in 2024, with a projected growth rate of 5.5% CAGR through 2034. The demand is strong in regions like the Northeast and West, driven by the popularity of low-carb and ketogenic diets. The growing awareness of the health risks associated with sugar consumption has led to increased use of erythritol in processed foods, beverages, and snacks, fueling market growth.
Key players in the Global Erythritol Market include Foodchem International Corporation, Tate & Lyle, Cargill, Jungbunzlauer Suisse AG, and Shandong Sanyuan Biotechnology. Companies are strengthening their positions by focusing on product innovation, expanding distribution channels, and investing in developing sustainable production methods to cater to the growing demand for natural sweeteners. To enhance their presence in the erythritol market, companies are adopting several key strategies. These include focusing on technological advancements in production processes to improve efficiency and reduce costs, as well as expanding their product portfolios to offer a wider range of sugar alternatives. Additionally, leading manufacturers are forming strategic partnerships with key players in the food and beverage sector to enhance market access and reach new consumer segments.
Table of Contents
Chapter 1 Methodology & Scope
- 1.1 Research methodology
- 1.2 Research approach & data sources
- 1.2.1 Primary research
- 1.2.2 Secondary research
- 1.2.3 Market size estimation techniques
- 1.2.4 Forecasting methodology
- 1.3 Research scope & assumptions
- 1.4 Market definition & segmentation
- 1.5 Limitations & challenges
- 1.6 Data validation & triangulation approach
Chapter 2 Executive Summary
- 2.1 Market overview & key findings
- 2.2 Market dynamics summary
- 2.3 Regional market highlights
- 2.4 Segmental performance overview
- 2.5 Competitive landscape snapshot
- 2.6 Future market outlook
- 2.7 Investment feasibility matrix
Chapter 3 Industry Insights
- 3.1 Industry ecosystem analysis
- 3.1.1 Factor affecting the value chain
- 3.1.2 Profit margin analysis
- 3.1.3 Disruptions
- 3.1.4 Future outlook
- 3.1.5 Manufacturers
- 3.1.6 Distributors
- 3.2 Trump administration tariffs
- 3.2.1 Impact on trade
- 3.2.1.1 Trade volume disruptions
- 3.2.1.2 Retaliatory measures
- 3.2.2 Impact on the industry
- 3.2.2.1 Supply-side impact (raw materials)
- 3.2.2.1.1 Price volatility in key materials
- 3.2.2.1.2 Supply chain restructuring
- 3.2.2.1.3 Production cost implications
- 3.2.2.1 Supply-side impact (raw materials)
- 3.2.3 Demand-side impact (selling price)
- 3.2.3.1 Price transmission to end markets
- 3.2.3.2 Market share dynamics
- 3.2.3.3 Consumer response patterns
- 3.2.4 Key companies impacted
- 3.2.5 Strategic industry responses
- 3.2.5.1 Supply chain reconfiguration
- 3.2.5.2 Pricing and product strategies
- 3.2.5.3 Policy engagement
- 3.2.6 Outlook and future considerations
- 3.2.1 Impact on trade
- 3.3 Trade statistics (HS code)
- 3.3.1 Major exporting countries, 2021-2024
- 3.3.2 Major importing countries, 2021-2024
- 3.4 Supplier landscape
- 3.5 Profit margin analysis
- 3.6 Key news & initiatives
- 3.7 Regulatory landscape
- 3.7.1 FDA regulations & GRAS status
- 3.7.2 European food safety authority (EFSA) guidelines
- 3.7.3 Asia-Pacific regulatory environment
- 3.7.4 International standards & certifications
- 3.8 Impact forces
- 3.8.1 Growth drivers
- 3.8.1.1 Increasing demand for low-calorie and sugar-free food products
- 3.8.1.2 Rising health consciousness among consumers
- 3.8.1.3 Growth of plant-based and natural food ingredient trends
- 3.8.1.4 Popularity of ketogenic and low-carb diets
- 3.8.2 Industry pitfalls & challenges
- 3.8.2.1 High production costs compared to other sweeteners
- 3.8.2.2 Limited consumer awareness in emerging markets
- 3.8.1 Growth drivers
- 3.9 Trade analysis
- 3.9.1 Import-export scenario
- 3.9.2 Tariff & non-tariff barriers
- 3.9.3 Anti-dumping measures & trade disputes
- 3.9.4 Free trade agreements impact
- 3.10 Technology landscape
- 3.10.1 Current production technologies
- 3.10.2 Fermentation process innovations
- 3.10.3 Purification & crystallization techniques
- 3.10.4 Emerging technologies & patents
- 3.11 Pricing Analysis
- 3.11.1 Price trends 2021-2024
- 3.11.2 Cost structure analysis
- 3.11.3 Pricing strategy assessment
- 3.11.4 Regional price variations
- 3.12 Value chain analysis
- 3.12.1 Raw material sourcing & suppliers
- 3.12.2 Manufacturing & processing
- 3.12.3 Distribution channels
- 3.12.4 End use applications
- 3.13 Industry impact analysis
- 3.13.1 Covid-19 impact assessment
- 3.13.2 Russia-Ukraine war implications
- 3.13.3 Economic recession factors
- 3.13.4 Supply chain disruptions
- 3.14 Growth potential analysis
- 3.15 Porter's analysis
- 3.16 PESTEL analysis
- 3.16.1 Political factors
- 3.16.2 Economic influences
- 3.16.3 Social trends
- 3.16.4 Technological innovations
- 3.16.5 Legal & regulatory framework
- 3.16.6 Environmental considerations
Chapter 4 Competitive Landscape, 2024
- 4.1 Introduction
- 4.2 Company market share analysis
- 4.2.1 Global market share distribution
- 4.2.2 Regional market share analysis
- 4.2.3 Tier analysis of key players
- 4.3 Competitive benchmarking
- 4.3.1 Product portfolio comparison
- 4.3.2 Production capacity assessment
- 4.3.3 Pricing strategy comparison
- 4.3.4 Distribution network strength
- 4.3.5 R&D capabilities & innovation
- 4.4 Strategic initiatives
- 4.4.1 Mergers & acquisitions
- 4.4.2 Joint ventures & partnerships
- 4.4.3 Capacity expansions
- 4.4.4 New product launches
- 4.4.5 Technological collaborations
- 4.5 Competitive positioning matrix
- 4.5.1 Market leaders
- 4.5.2 Emerging players
- 4.5.3 Innovators
- 4.5.4 Niche players
- 4.6 Strategic dashboard
Chapter 5 Market Estimates & Forecast, By Form, 2021-2034 (USD Billion) (Kilo Tons)
- 5.1 Key trends
- 5.2 Powder
- 5.3 Granular
- 5.4 Liquid
Chapter 6 Market Estimates & Forecast, By Purity Level, 2021-2034 (USD Billion) (Kilo Tons)
- 6.1 Key trends
- 6.2 High purity (=>99%)
- 6.3 Standard purity (95-98%)
- 6.4 Others
Chapter 7 Market Estimates & Forecast, By Application, 2021-2034 (USD Billion) (Kilo Tons)
- 7.1 Key trends
- 7.2 Food and beverages
- 7.2.1 Bakery & confectionery
- 7.2.2 Beverages
- 7.2.3 Dairy products
- 7.2.4 Frozen desserts
- 7.2.5 Others
- 7.3 Pharmaceutical
- 7.3.1 Tablets & capsules
- 7.3.2 Syrups & suspensions
- 7.3.3 Others
- 7.4 Personal care and cosmetics
- 7.4.1 Oral care products
- 7.4.2 Skin care products
- 7.4.3 Others
- 7.5 Others
- 7.5.1 Agricultural applications
- 7.5.2 Industrial uses
Chapter 8 Market Estimates & Forecast, By Region, 2021-2034 (USD Billion) (Kilo Tons)
- 8.1 Key trends
- 8.2 North America
- 8.2.1 U.S.
- 8.2.2 Canada
- 8.2.3 Mexico
- 8.3 Europe
- 8.3.1 UK
- 8.3.2 Germany
- 8.3.3 France
- 8.3.4 Italy
- 8.3.5 Spain
- 8.3.6 Russia
- 8.4 Asia Pacific
- 8.4.1 China
- 8.4.2 India
- 8.4.3 Japan
- 8.4.4 South Korea
- 8.4.5 Australia
- 8.5 Latin America
- 8.5.1 Brazil
- 8.5.2 Argentina
- 8.6 MEA
- 8.6.1 South Africa
- 8.6.2 Saudi Arabia
- 8.6.3 UAE
Chapter 9 Company Profiles
- 9.1 Baolingbao Biology Co., Ltd.
- 9.2 Cargill, Inc.
- 9.3 Changzhou Niutang Chemical Plant Co., Ltd.
- 9.4 Foodchem International Corporation
- 9.5 Futaste Co., Ltd.
- 9.6 Ingredion Incorporated
- 9.7 Jungbunzlauer Suisse AG
- 9.8 Mitsubishi Chemical Group Corporation
- 9.9 Nikken Chemical Co., Ltd.
- 9.10 RAJVI ENTERPRISE
- 9.11 Shandong Sanyuan Biotechnology Co., Ltd.
- 9.12 Tate & Lyle PLC
- 9.13 Xiwang Group
- 9.14 Zibo ZhongShi GeRui Biotech Co., Ltd.


