


 |
市場調查報告書
商品編碼
1750478
無軌電車市場機會、成長動力、產業趨勢分析及 2025 - 2034 年預測Trolley Bus Market Opportunity, Growth Drivers, Industry Trend Analysis, and Forecast 2025 - 2034 |
||||||
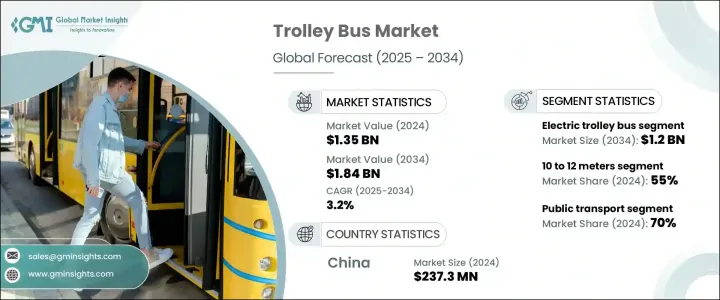
2024年,全球無軌電車市場規模達13.5億美元,預計到2034年將以3.2%的複合年成長率成長,達到18.4億美元。這得歸功於對環保公共交通方案日益成長的需求、更嚴格的排放法規以及不斷成長的城市人口。隨著越來越多的城市尋求永續的交通替代方案,無軌電車成為一種清潔、經濟高效的解決方案。這些車輛採用架空線路或混合動力系統供電,可減少對化石燃料的依賴,降低溫室氣體排放,並改善城市空氣品質。各國政府和市政當局在追求長期永續發展和減排目標的過程中,將無軌電車納入現有交通網路的優先事項。
無軌電車依靠架空線路或混合動力系統供電,在減少對傳統燃料來源的依賴方面發揮著至關重要的作用。它們的採用顯著減少了溫室氣體排放,並改善了人口稠密城市地區的空氣品質。隨著環保意識的增強,政府和城市規劃者將這些車輛納入公共交通策略,以實現氣候行動目標並降低碳足跡。無軌電車也與全球城市交通趨勢相契合,即優先考慮更清潔、更安靜、更經濟的交通方式。
| 市場範圍 | |
|---|---|
| 起始年份 | 2024 |
| 預測年份 | 2025-2034 |
| 起始值 | 13.5億美元 |
| 預測值 | 18.4億美元 |
| 複合年成長率 | 3.2% |
2024年,電動無軌電車市場佔據65%的市場佔有率,預計到2034年將創造12億美元的市場價值。由於電動無軌電車直接從電網供電,因此消除了廢氣排放,並保持了穩定的運作性能,且不存在柴油車隊常見的燃油波動問題。電動無軌電車能夠與行動充電系統整合,進一步提升了線路靈活性,使其成為擴展交通網路的可靠選擇。此外,更低的維護成本和更高的能源效率也使其在城市交通機構和營運商中日益受到青睞。
以車輛尺寸計算,10 至 12 公尺的車型在 2024 年佔據 55% 的市場佔有率,其容量和機動性實現了最佳組合,非常適合繁忙的城市線路。這些中型無軌電車可容納大量乘客,同時保持了靈活應對狹窄車道、急轉彎和擁塞交通區域的靈活性。其尺寸和設計使其非常適合短途城市環線和較長的城市走廊,從而提高了車隊的多功能性。此外,由於其能夠提供高頻次服務,且無需面對長距離公車在密集城市景觀中面臨的挑戰,此類車型的需求正在不斷成長。城市交通部門青睞這款車型,不僅因為其運作便利,還因為其與現有基礎設施的兼容性。
受公共交通現代化和零排放汽車支援措施的推動,中國無軌電車市場在2024年將達到2.373億輛。電動公共交通系統正在大規模推廣,以緩解交通堵塞,減少人口密集城市的污染。採用動態充電系統供電的無軌電車正日益受到青睞,無需完全依賴固定基礎設施即永續營運。這項出行創新與各大交通部門日益成長的脫碳和降低營運成本的措施相契合。
全球無軌電車市場的主要參與者包括 Solaris Bus & Coach、宇通客車、依維柯集團、斯柯達、SOR Libchavy、明斯克汽車廠、中通客車、Bogdan、Bozankaya 和 Etalon。為了提升市場地位,無軌電車行業的公司專注於產品創新、本地製造以及與城市交通部門建立戰略合作夥伴關係。 Solaris Bus & Coach、中通客車和Skoda等公司優先考慮行動充電系統和模組化設計特性,以提高車輛效率和適應性。此外,各公司還投資研發以減輕車輛重量、延長續航里程並融入即時遠端資訊處理技術,以便更好地管理車隊。在亞太和拉丁美洲市場,製造商正在利用合資企業和政府合作來擴大其影響力。
目錄
第1章:方法論與範圍
第2章:執行摘要
第3章:行業洞察
- 產業生態系統分析
- 供應商格局
- 原料供應商和零件製造商
- 無軌電車原始設備製造商和系統整合商
- 基礎設施提供者
- 分銷管道
- 最終使用和運輸當局
- 利潤率分析
- 供應商格局
- 川普政府關稅的影響
- 對貿易的影響
- 貿易量中斷
- 報復措施
- 對產業的影響
- 供給側影響(原料)
- 主要材料價格波動
- 供應鏈重組
- 生產成本影響
- 需求面影響(售價)
- 價格傳導至終端市場
- 市佔率動態
- 消費者反應模式
- 供給側影響(原料)
- 策略產業反應
- 供應鏈重組
- 對貿易的影響
- 定價和產品策略
- 技術與創新格局
- 自主功能和智慧連接
- 高級駕駛輔助系統 (ADAS)
- 再生煞車技術
- 先進的控制系統與安全機制
- 專利分析
- 監管格局
- 排放標準和環境法規
- 政府措施和補貼
- 都市交通政策
- 安全標準與合規性
- 用例
- 重要新聞和舉措
- 成本分解分析
- 價格趨勢分析
- 產品
- 地區
- 對部隊的影響
- 成長動力
- 更重視零排放大眾運輸
- 城市人口和出行需求不斷成長
- 電池系統的技術進步
- 相較於其他電動交通方式具有成本優勢
- 產業陷阱與挑戰
- 初始基礎設施成本高
- 架空線路系統的運作限制
- 成長動力
- 成長潛力分析
- 波特的分析
- PESTEL分析
- 永續性分析
- 總擁有成本(TCO)分析
- 收購成本
- 基礎設施成本
- 營運成本
- 維護成本
- 報廢和處置成本
第4章:競爭格局
- 介紹
- 公司市佔率分析
- 競爭定位矩陣
- 戰略展望矩陣
第5章:市場估計與預測:按產品,2021 - 2034 年
- 主要趨勢
- 電動無軌電車
- 混合動力/電池無軌電車
第6章:市場估計與預測:依長度,2021 - 2034
- 主要趨勢
- 最遠10米
- 10-12米
- 超過12米
第7章:市場估計與預測:依座位容量,2021 - 2034 年
- 主要趨勢
- 少於50個席位
- 50-100個座位
- 超過100個座位
第8章:市場估計與預測:按應用,2021 - 2034 年
- 主要趨勢
- 大眾運輸
- 旅遊
- 機場接駁車
- 其他
第9章:市場估計與預測:按地區,2021 - 2034 年
- 北美洲
- 美國
- 加拿大
- 歐洲
- 英國
- 德國
- 法國
- 義大利
- 西班牙
- 烏克蘭
- 俄羅斯
- 亞太地區
- 中國
- 印度
- 日本
- 澳洲
- 韓國
- 東南亞
- 拉丁美洲
- 巴西
- 墨西哥
- 阿根廷
- 智利
- MEA
- 南非
- 沙烏地阿拉伯
- 阿拉伯聯合大公國
第10章:公司簡介
- BKM
- Bogdan
- Bozankaya
- CAIO Induscar
- Carrosserie HESS
- Dongfeng Yangtse
- Electronmash
- Etalon
- Gillig
- Iveco
- Kiepe Electric
- MINSK AUTOMOBILE PLANT
- New Flyer
- PC Transport Systems
- Škoda Group
- Solaris Bus & Coach
- SOR Libchavy
- Sunwin
- Yutong Bus
- Zhongtong Bus
The Global Trolley Bus Market was valued at USD 1.35 billion in 2024 and is estimated to grow at a CAGR of 3.2% to reach USD 1.84 billion by 2034, fueled by the rising demand for eco-friendly public transit options, stricter emission regulations, and expanding urban populations. As more cities seek sustainable transportation alternatives, trolley buses emerge as a clean, cost-effective solution. Operating on electricity supplied through overhead wires or hybrid systems, these vehicles reduce reliance on fossil fuels, lower greenhouse gas emissions, and improve urban air quality. Governments and municipalities prioritize trolley bus integration into existing networks as they pursue long-term sustainability and emission-reduction targets.
Operating on electricity supplied through overhead wires or hybrid systems, trolley buses play a vital role in reducing dependence on traditional fuel sources. Their adoption significantly reduces greenhouse gas emissions and enhances air quality in densely populated urban areas. As environmental awareness increases, governments and city planners incorporate these vehicles into public transportation strategies to meet climate action goals and lower carbon footprints. Trolley buses also align well with global urban mobility trends, where cleaner, quieter, and more cost-effective transit options are prioritized.
| Market Scope | |
|---|---|
| Start Year | 2024 |
| Forecast Year | 2025-2034 |
| Start Value | $1.35 billion |
| Forecast Value | $1.84 billion |
| CAGR | 3.2% |
The electric trolley buses segment held a 65% share in 2024 and is projected to generate USD 1.2 billion by 2034. Since they draw power directly from the grid, these buses eliminate tailpipe emissions and deliver consistent operational performance without the fuel volatility associated with diesel fleets. Their ability to integrate with in-motion charging systems further enhances their route flexibility, making them a dependable choice for expanding transit networks. Moreover, the reduced maintenance costs and improved energy efficiency add to their growing appeal among city transit agencies and operators.
Based on vehicle size, the 10 to 12-meter segment held a 55% share in 2024, offering an optimal combination of capacity and maneuverability, making it highly effective for busy metropolitan routes. These medium-sized trolley buses accommodate many passengers while maintaining the agility to handle narrow lanes, sharp turns, and congested traffic zones. Their size and design make them well-suited for short city loops and longer urban corridors, improving fleet versatility. Additionally, the demand for this category is rising due to its ability to offer high-frequency service without the challenges of longer buses in dense cityscapes. Urban transportation authorities favor this segment not only for its operational convenience but also for its compatibility with existing infrastructure.
China Trolley Bus Market generated 237.3 million in 2024, driven by initiatives aimed at modernizing mass transit and supporting zero-emission vehicles. Electrified public transit systems are being adopted at scale to manage traffic congestion and reduce pollution in densely populated cities. Trolley buses powered through in-motion charging systems are gaining traction, enabling continuous operation without full dependence on fixed infrastructure. This mobility innovation aligns with the growing push for decarbonization and reduced operational costs across major transit authorities.
Key players in the Global Trolley Bus Market include Solaris Bus & Coach, Yutong Bus, Iveco Group, Skoda, SOR Libchavy, MINSK AUTOMOBILE PLANT, Zhongtong Bus, Bogdan, Bozankaya, and Etalon. To enhance their market position, companies in the trolley bus industry focus on product innovation, local manufacturing, and strategic partnerships with urban transit authorities. Players like Solaris Bus & Coach, Zhongtong Bus, and Skoda prioritize in-motion charging systems and modular design features to increase vehicle efficiency and adaptability. Additionally, firms invest in R&D to lower vehicle weight, extend range, and incorporate real-time telematics for better fleet management. In the Asia-Pacific and Latin America markets, manufacturers are leveraging joint ventures and government collaborations to expand their presence.
Table of Contents
Chapter 1 Methodology & Scope
- 1.1 Research design
- 1.1.1 Research approach
- 1.1.2 Data collection methods
- 1.2 Base estimates & calculations
- 1.2.1 Base year calculation
- 1.2.2 Key trends for market estimation
- 1.3 Forecast model
- 1.4 Primary research and validation
- 1.4.1 Primary sources
- 1.4.2 Data mining sources
- 1.5 Market scope & definition
Chapter 2 Executive Summary
- 2.1 Industry synopsis, 2021 - 2034
Chapter 3 Industry Insights
- 3.1 Industry ecosystem analysis
- 3.1.1 Supplier landscape
- 3.1.1.1 Raw material suppliers and component manufacturers
- 3.1.1.2 Trolley Bus OEMs and system integrators
- 3.1.1.3 Infrastructure providers
- 3.1.1.4 Distribution channels
- 3.1.1.5 End use and transit authorities
- 3.1.2 Profit margin analysis
- 3.1.1 Supplier landscape
- 3.2 Impact of Trump administration tariffs
- 3.2.1 Impact on trade
- 3.2.1.1 Trade volume disruptions
- 3.2.1.2 Retaliatory measures
- 3.2.2 Impact on industry
- 3.2.2.1 Supply-side impact (raw materials)
- 3.2.2.1.1 Price volatility in key materials
- 3.2.2.1.2 Supply chain restructuring
- 3.2.2.1.3 Production cost implications
- 3.2.2.2 Demand-side impact (selling price)
- 3.2.2.2.1 Price transmission to end markets
- 3.2.2.2.2 Market share dynamics
- 3.2.2.2.3 Consumer response patterns
- 3.2.2.1 Supply-side impact (raw materials)
- 3.2.3 Strategic industry responses
- 3.2.3.1 Supply chain reconfiguration
- 3.2.1 Impact on trade
- 3.3 Pricing and product strategies
- 3.4 Technology & innovation landscape
- 3.4.1 Autonomous features and smart connectivity
- 3.4.2 Advanced driver assistance systems (ADAS)
- 3.4.3 Regenerative braking technologies
- 3.4.4 Advanced control systems and safety mechanisms
- 3.5 Patent analysis
- 3.6 Regulatory landscape
- 3.6.1 Emission standards and environmental regulations
- 3.6.2 Government initiatives and subsidies
- 3.6.3 Urban transport policies
- 3.6.4 Safety standards and compliance
- 3.7 Use cases
- 3.8 Key news & initiatives
- 3.9 Cost break-down analysis
- 3.10 Price trend analysis
- 3.10.1 Product
- 3.10.2 Region
- 3.11 Impact on forces
- 3.11.1 Growth drivers
- 3.11.1.1 Increasing focus on zero-emission public transport
- 3.11.1.2 Rising urban population and mobility needs
- 3.11.1.3 Technological advancements in battery systems
- 3.11.1.4 Cost advantages over other electric transit options
- 3.11.2 Industry pitfalls & challenges
- 3.11.2.1 High initial infrastructure costs
- 3.11.2.2 Operational constraints of overhead wire systems
- 3.11.1 Growth drivers
- 3.12 Growth potential analysis
- 3.13 Porter's analysis
- 3.14 PESTEL analysis
- 3.15 Sustainability analysis
- 3.16 Total Cost of Ownership (TCO) analysis
- 3.16.1 Acquisition cost
- 3.16.2 Infrastructure costs
- 3.16.3 Operational costs
- 3.16.4 Maintenance costs
- 3.16.5 End-of-Life and disposal costs
Chapter 4 Competitive Landscape, 2024
- 4.1 Introduction
- 4.2 Company market share analysis
- 4.3 Competitive positioning matrix
- 4.4 Strategic outlook matrix
Chapter 5 Market Estimates & Forecast, By Product, 2021 - 2034 ($Mn, Units)
- 5.1 Key trends
- 5.2 Electric trolley bus
- 5.3 Hybrid/Battery trolley bus
Chapter 6 Market Estimates & Forecast, By Length, 2021 - 2034 ($Mn Units)
- 6.1 Key trends
- 6.2 Up to 10 meters
- 6.3 10-12 meters
- 6.4 More than 12 meters
Chapter 7 Market Estimates & Forecast, By Seating Capacity, 2021 - 2034 ($Mn, Units)
- 7.1 Key trends
- 7.2 Less than 50 seats
- 7.3 50-100 seat
- 7.4 Above 100 seats
Chapter 8 Market Estimates & Forecast, By Application, 2021 - 2034 ($Mn, Units)
- 8.1 Key trends
- 8.2 Public transport
- 8.3 Tourism
- 8.4 Airport shuttle
- 8.5 Others
Chapter 9 Market Estimates & Forecast, By Region, 2021 - 2034 ($Mn, Units)
- 9.1 North America
- 9.1.1 U.S.
- 9.1.2 Canada
- 9.2 Europe
- 9.2.1 UK
- 9.2.2 Germany
- 9.2.3 France
- 9.2.4 Italy
- 9.2.5 Spain
- 9.2.6 Ukraine
- 9.2.7 Russia
- 9.3 Asia Pacific
- 9.3.1 China
- 9.3.2 India
- 9.3.3 Japan
- 9.3.4 Australia
- 9.3.5 South Korea
- 9.3.6 Southeast Asia
- 9.4 Latin America
- 9.4.1 Brazil
- 9.4.2 Mexico
- 9.4.3 Argentina
- 9.4.4 Chile
- 9.5 MEA
- 9.5.1 South Africa
- 9.5.2 Saudi Arabia
- 9.5.3 UAE
Chapter 10 Company Profiles
- 10.1 BKM
- 10.2 Bogdan
- 10.3 Bozankaya
- 10.4 CAIO Induscar
- 10.5 Carrosserie HESS
- 10.6 Dongfeng Yangtse
- 10.7 Electronmash
- 10.8 Etalon
- 10.9 Gillig
- 10.10 Iveco
- 10.11 Kiepe Electric
- 10.12 MINSK AUTOMOBILE PLANT
- 10.13 New Flyer
- 10.14 PC Transport Systems
- 10.15 Škoda Group
- 10.16 Solaris Bus & Coach
- 10.17 SOR Libchavy
- 10.18 Sunwin
- 10.19 Yutong Bus
- 10.20 Zhongtong Bus
 城際電動巴士市場預測至2034年-全球動力系統、電池容量、巴士長度、座位數、續航里程、應用及區域分析
 公車市場規模、佔有率、趨勢和預測:按類型、燃料類型、座位容量、應用和地區分類,2026-2034 年
 2026年全球巴士和長途客車市場報告
 受電弓充電器市場規模、佔有率和趨勢分析報告:按組件、充電方式、充電基礎設施類型、地區和細分市場預測(2026-2033 年)2026年全球包車服務市場報告2026年全球豪華客車市場報告
 包車服務市場:2026-2032年全球市場預測(按服務類型、乘客容量、車輛類型、行駛里程、最終用戶和預訂方式分類)公車市場:2026-2032年全球市場預測(依車輛類型、燃料類型、座位數及應用分類)鉸接式客車市場:依推進系統、乘客容量、長度、驅動系統和應用分類,全球預測,2026-2032年電動公車充電受電弓市場(按受電弓類型、充電方式、額定功率和最終用戶分類)-全球預測,2026-2032年