


 |
市場調查報告書
商品編碼
1750322
棗椰樹市場機會、成長動力、產業趨勢分析及 2025 - 2034 年預測Date Palm Market Opportunity, Growth Drivers, Industry Trend Analysis, and Forecast 2025 - 2034 |
||||||
2024年,全球椰棗市場價值達92億美元,預計2034年將以3.5%的複合年成長率成長,達到131億美元。椰棗作為一種天然、營養豐富的食品,正日益受到人們的青睞。人們對椰棗健康益處的認知不斷提高,以及對低加工天然甜味劑的需求不斷成長,推動了全球椰棗消費。受可支配收入成長和農業技術改進帶來的產量效率提升的推動,椰棗的產值和產量持續成長。
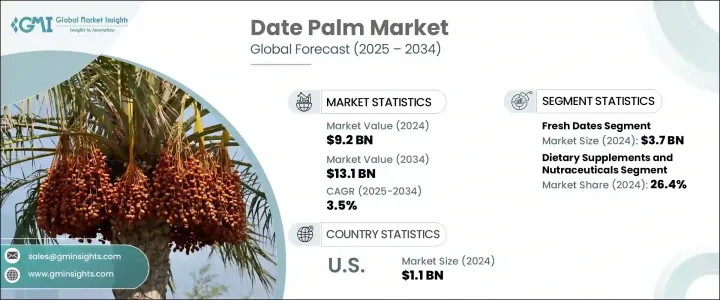
有利的氣候條件以及不斷擴大的種植規模,提升了主要產區的競爭力。灌溉系統的完善、政府的支持以及農藝實踐的改進,有助於提高產量和品質,使生產者能夠更有效率地滿足日益成長的國際需求。同時,隨著消費者偏好健康、功能性食品,全球消費領域正拓展至傳統市場之外,北美、東亞和歐洲的消費市場也日益受到青睞。注重健康的消費者越來越青睞椰棗,因為它們天然甜度高、纖維含量高且具有抗氧化特性。隨著植物性和清潔標籤趨勢持續主導食品產業,椰棗不僅被視為零食,也成為能量棒、冰沙和保健產品的關鍵成分。這種消費模式的轉變推動了主流和利基市場的穩定擴張。
| 市場範圍 | |
|---|---|
| 起始年份 | 2024 |
| 預測年份 | 2025-2034 |
| 起始值 | 92億美元 |
| 預測值 | 131億美元 |
| 複合年成長率 | 3.5% |
2024年,鮮棗市場規模達37億美元,預計2034年將以3.7%的複合年成長率成長。消費者對新鮮、未加工的棗子表現出強烈的偏好,因為它們富含天然纖維、抗氧化劑和天然糖。在節日和宗教節日期間,鮮棗的需求尤其旺盛,因為在這些節日和宗教節日期間,鮮棗在飲食中扮演著重要的角色。鮮棗吸引了注重健康的人士,他們尋求符合清潔飲食趨勢的植物性零食。
2024年,營養保健品和膳食補充劑市場規模達25億美元,預計到2034年將以3.4%的複合年成長率成長。椰棗粉、椰棗萃取物和椰棗糊等衍生物因其豐富的營養成分而被用於健康產品中。這些產品富含多酚、鐵、鉀和鎂,因其增強免疫力、促進消化和支持代謝健康而備受青睞。椰棗衍生補充劑的清潔標籤和藥用價值使其在預防性保健市場中極具吸引力。
2024年,美國棗椰樹市場規模達11億美元,並以驚人的速度擴張,預計2034年複合年成長率將達到6.9%。消費者需求的驅動力源於人們對健康飲食習慣的日益重視以及對永續農業日益成長的興趣。政府的支持計畫和農業措施使種植者能夠降低生產成本,並投資於改良的種植技術,從而提高整體產量和市場反應能力。
全球椰棗產業的主要參與者包括 Phoenix Agrotech、Royal Palm Dates Group、Al Barakah Dates Factory LLC、Hadiklaim 和 Bard Valley Natural Delights。為了保持競爭力,領先的椰棗公司專注於多種策略,例如透過垂直整合來控制品質和供應,投資環保農業技術,以及實現產品線多元化,包括有機椰棗和能量棒等加值產品。他們也正在加強全球物流,擴大線上分銷,並與健康品牌建立合作夥伴關係,以提高知名度。
目錄
第1章:方法論與範圍
第2章:執行摘要
第3章:行業洞察
- 產業生態系統分析
- 影響價值鏈的因素
- 利潤率分析
- 中斷
- 未來展望
- 製造商
- 經銷商
- 川普政府關稅
- 對貿易的影響
- 貿易量中斷
- 報復措施
- 對產業的影響
- 供給側影響(原料)
- 主要材料價格波動
- 供應鏈重組
- 生產成本影響
- 供給側影響(原料)
- 需求面影響(售價)
- 價格傳導至終端市場
- 市佔率動態
- 消費者反應模式
- 受影響的主要公司
- 策略產業反應
- 供應鏈重組
- 定價和產品策略
- 政策參與
- 展望與未來考慮
- 對貿易的影響
- 貿易統計(HS編碼)
- 2021-2024年主要出口國
- 2021-2024年主要進口國
3.3.3 註:以上貿易統計僅提供重點國家。
- 供應商格局
- 利潤率分析
- 重要新聞和舉措
- 監管格局
- 全球監理框架
- FDA 法規(美國)
- EFSA法規(歐洲)
- FSSAI法規(印度)
- GCC標準化組織(GSO)
- 其他區域監管機構
- 品質標準和認證
- 食品法典標準
- ISO 日期標準
- 有機認證
- 良好農業規範(GAP)
- 良好生產規範 (GMP)
- 標籤和包裝法規
- 進出口法規
- 食品安全和品質控制措施
- 監管挑戰和合規策略
- 未來監理趨勢及影響分析
- 全球監理框架
- 衝擊力
- 成長動力
- 天然甜味劑和健康零食的需求不斷成長
- 擴大非傳統地區的種植
- 政府對農業基礎建設的支持與投資
- 宗教和文化活動期間全球消費增加
- 產業陷阱與挑戰
- 易受氣候變遷和水資源短缺影響
- 由於儲存和加工設施不足而造成的收穫後損失
- 成長動力
- 加工技術與製造
- 棗果加工概述
- 傳統加工方法
- 現代加工技術
- 洗滌和清潔
- 分類和分級
- 乾燥和脫水
- 去核並切碎
- 包裝與保存
- 棗糖漿生產
- 提取方法
- 濃縮和精煉
- 品質控制和標準
- 棗泥、棗粉生產
- 製造過程
- 設備與技術
- 品質參數
- 加值加工
- 發酵技術
- 生物活性化合物的萃取
- 新穎的加工技術
- 包裝創新與保存期限延長
- 品質保證與食品安全體系
- 科技進步和未來趨勢
- 供應鏈分析和分銷管道
- 供應鏈結構
- 供應鏈中的關鍵利害關係人
- 農民和生產者
- 加工商和製造商
- 分銷商和批發商
- 零售商和最終用戶
- 分銷管道
- 直銷
- 超市和大賣場
- 專賣店
- 網路零售
- 傳統市場
- 供應鏈挑戰
- 收穫後損失
- 冷鏈基礎設施
- 運輸和物流
- 品質控制和可追溯性
- 供應鏈最佳化策略
- 垂直整合
- 協作方法
- 技術整合
- 永續供應鏈實踐
- 電子商務與數位平台
- 棗椰樹供應鏈管理的未來趨勢
- 技術創新與研發
- 棗椰樹種植的創新
- 精準農業和智慧農業
- 用於授粉和監測的無人機技術
- 物聯網和人工智慧在棗農中的應用
- 基因改良和育種計劃
- 氣候智慧型農業實踐
- 收穫技術的進步
- 機械化收穫設備
- 機器人和自動化系統
- 搖晃機和其他創新
- 加工和加值方面的創新
- 新型萃取技術
- 先進的乾燥和保存方法
- 奈米科技應用
- 發酵和生物加工創新
- 包裝創新
- 智慧主動包裝
- 永續包裝解決方案
- 氣調包裝(MAP)
- 保存期限延長技術
- 供應鏈管理中的數位技術
- 區塊鏈用於可追溯性
- 巨量資料分析
- 電子商務和數位行銷平台
- 專利格局和智慧財產權
- 研究機構與創新中心
- 未來科技趨勢
- 棗椰樹種植的創新
- 定價分析和成本結構
- 全球定價趨勢
- 按品種進行價格點分析
- 按地區分析價格點
- 依產品類型進行價格點分析
- 影響定價的因素
- 生產成本
- 品質和等級
- 供需動態
- 季節變化
- 成本結構分析
- 種植和收穫成本
- 加工製造成本
- 包裝和分銷成本
- 行銷和銷售成本
- 跨價值鏈的利潤分析
- 價格預測與未來趨勢
- 成長潛力分析
- 波特的分析
- PESTEL分析
第4章:競爭格局
- 介紹
- 公司市佔率分析
- 競爭定位矩陣
- 戰略展望矩陣
- 投資機會和策略建議
- 給市場參與者的策略建議
- 對於生產者和農民
- 對於加工商和製造商
- 對於分銷商和零售商
- 對於投資者和金融機構
- 對於政府和監管機構
- 市場進入策略
- 合資企業和合作夥伴關係
- 併購
- 許可和特許經營
- 直接投資
- 產品開發與創新策略
- 行銷和品牌策略
- 風險評估和緩解策略
- 長期成長策略
- 給市場參與者的策略建議
第5章:市場估計與預測:依產品類型,2021-2034
- 主要趨勢
- 鮮棗
- 乾棗
- 棗糖漿
- 棗泥
- 棗粉
- 其他棗類產品
第6章:市場估計與預測:依性質,2021-2034
- 主要趨勢
- 約定日期
- 有機棗
第7章:市場估計與預測:依形式,2021-2034
- 主要趨勢
- 整個日期
- 切碎的紅棗
- 去核紅棗
- 日期件
第 8 章:市場估計與預測:按應用,2021 年至 2034 年
- 主要趨勢
- 食品和飲料應用
- 烘焙和糖果
- 乳製品
- 小吃和酒吧
- 早餐麥片
- 飲料和飲品
- 其他食品應用
- 膳食補充品和營養保健品
- 營養補充品
- 功能性食品
- 運動營養
- 製藥應用
- 傳統醫學
- 現代製藥
- 化妝品和個人護理
- 保養產品
- 護髮產品
- 其他個人護理應用
- 動物飼料
- 牲畜飼料
- 寵物食品
- 工業應用
- 生物燃料生產
- 紡織業
- 其他工業用途
第9章:市場估計與預測:按地區,2021-2034
- 主要趨勢
- 北美洲
- 美國
- 加拿大
- 歐洲
- 英國
- 德國
- 法國
- 義大利
- 西班牙
- 荷蘭
- 亞太地區
- 中國
- 印度
- 日本
- 韓國
- 澳洲
- 拉丁美洲
- 巴西
- 墨西哥
- 阿根廷
- MEA
- 南非
- 沙烏地阿拉伯
- 阿拉伯聯合大公國
第10章:公司簡介
- Al Barakah Dates Factory LLC
- Al Wathba Marionnet
- Atul Rajasthan Date Palms
- Barari Group
- Bard Valley Natural Delights
- Barkaat Dates
- Emirates Dates
- GNS Pakistan
- Groundworks
- Haifa Datte
- Hadiklaim
- Kutch Crop Services Pvt. Ltd.
- Maghadi
- Phoenix Agrotech LLC
- Royal Palm Dates Group
- Vaidehi Foods Pvt. Ltd.
The Global Date Palm Market was valued at USD 9.2 billion in 2024 and is estimated to grow at a CAGR of 3.5% to reach USD 13.1 billion by 2034, driven by the benefits from the rising popularity of dates as a natural, nutrient-rich food choice. Increased awareness of their health benefits and the demand for minimally processed natural sweeteners have helped push consumption worldwide. Growth is consistent in value and volume, driven by rising disposable incomes and greater yield efficiency due to technological farming improvements.
Favorable climate conditions, along with expanding cultivation efforts, have made key producing regions more competitive. Enhanced irrigation systems, government support, and improved agronomic practices contribute to higher yields and better-quality harvests, allowing producers to meet rising international demand more efficiently. Meanwhile, global consumption is broadening beyond traditional markets, gaining traction in North America, East Asia, and Europe as consumer preferences lean toward wholesome, functional foods. Health-conscious consumers are increasingly drawn to dates for their natural sweetness, high fiber content, and antioxidant properties. As plant-based and clean-label trends continue to dominate the food industry, dates are being embraced not only as snacks but also as key ingredients in energy bars, smoothies, and wellness products. This shift in consumption patterns fuels steady market expansion across both mainstream and niche sectors.
| Market Scope | |
|---|---|
| Start Year | 2024 |
| Forecast Year | 2025-2034 |
| Start Value | $9.2 Billion |
| Forecast Value | $13.1 Billion |
| CAGR | 3.5% |
The fresh dates segment generated USD 3.7 billion in 2024 and is projected to grow at a CAGR of 3.7% through 2034. Consumers are showing a strong preference for fresh, unprocessed dates due to their naturally high fiber, antioxidants, and natural sugars. This demand is high during festive and religious seasons, where fresh dates play an essential dietary role. Fresh dates appeal to health-conscious individuals seeking plant-based snacks that align with clean eating trends.
The nutraceutical and dietary supplements segment was valued at USD 2.5 billion in 2024 and is expected to grow with a CAGR of 3.4% through 2034. Derivatives such as date powders, extracts, and pastes are used in health-oriented products due to their dense nutritional profile. Known for their high levels of polyphenols, iron, potassium, and magnesium, these products are favored for boosting immunity, aiding digestion, and supporting metabolic health. The clean label and medicinal appeal of date-derived supplements make them highly attractive in the preventive health market.
U.S. Date Palm Market was valued at USD 1.1 billion in 2024 and is expanding at an impressive pace with a CAGR of 6.9% projected through 2034. Consumer demand is driven by a growing awareness of healthy eating habits and an increasing interest in sustainable agriculture. Government support programs and agricultural initiatives enable growers to reduce production costs and invest in enhanced farming techniques, thus improving overall yield and market responsiveness.
The key players operating in the Global Date Palm Industry are Phoenix Agrotech, Royal Palm Dates Group, Al Barakah Dates Factory L.L.C, Hadiklaim, and Bard Valley Natural Delights. To stay competitive, leading date palm companies focus on strategies like vertical integration to control quality and supply, investing in eco-friendly farming technologies, and diversifying product lines to include value-added items like organic dates and energy bars. They are also strengthening global logistics, expanding online distribution, and forming partnerships with wellness brands to boost visibility.
Table of Contents
Chapter 1 Methodology & Scope
- 1.1 Market scope & definitions
- 1.2 Base estimates & calculations
- 1.3 Forecast calculations
- 1.4 Data sources
- 1.4.1 Primary
- 1.4.2 Secondary
- 1.4.2.1 Paid sources
- 1.4.2.2 Public sources
Chapter 2 Executive Summary
- 2.1 Industry synopsis, 2021-2034
Chapter 3 Industry Insights
- 3.1 Industry ecosystem analysis
- 3.1.1 Factor affecting the value chain
- 3.1.2 Profit margin analysis
- 3.1.3 Disruptions
- 3.1.4 Future outlook
- 3.1.5 Manufacturers
- 3.1.6 Distributors
- 3.2 Trump administration tariffs
- 3.2.1 Impact on trade
- 3.2.1.1 Trade volume disruptions
- 3.2.1.2 Retaliatory measures
- 3.2.2 Impact on the industry
- 3.2.2.1 Supply-side impact (raw materials)
- 3.2.2.1.1 Price volatility in key materials
- 3.2.2.1.2 Supply chain restructuring
- 3.2.2.1.3 Production cost implications
- 3.2.2.1 Supply-side impact (raw materials)
- 3.2.3 Demand-side impact (selling price)
- 3.2.3.1 Price transmission to end markets
- 3.2.3.2 Market share dynamics
- 3.2.3.3 Consumer response patterns
- 3.2.4 Key companies impacted
- 3.2.5 Strategic industry responses
- 3.2.5.1 Supply chain reconfiguration
- 3.2.5.2 Pricing and product strategies
- 3.2.5.3 Policy engagement
- 3.2.6 Outlook and future considerations
- 3.2.1 Impact on trade
- 3.3 Trade statistics (HS code)
- 3.3.1 Major exporting countries, 2021-2024 (kilo tons)
- 3.3.2 Major importing countries, 2021-2024 (kilo tons)
3.3.3 Note: the above trade statistics will be provided for key countries only.
- 3.4 Supplier landscape
- 3.5 Profit margin analysis
- 3.6 Key news & initiatives
- 3.7 Regulatory landscape
- 3.7.1 Global regulatory framework
- 3.7.1.1 FDA regulations (United States)
- 3.7.1.2 EFSA regulations (Europe)
- 3.7.1.3 FSSAI regulations (India)
- 3.7.1.4 GCC standardization organization (GSO)
- 3.7.1.5 Other regional regulatory bodies
- 3.7.2 Quality standards and certifications
- 3.7.2.1 Codex alimentarius standards
- 3.7.2.2 ISO standards for dates
- 3.7.2.3 Organic certifications
- 3.7.2.4 Good agricultural practices (GAP)
- 3.7.2.5 Good manufacturing practices (GMP)
- 3.7.3 Labeling and packaging regulations
- 3.7.4 Import-export regulations
- 3.7.5 Food safety and quality control measures
- 3.7.6 Regulatory challenges and compliance strategies
- 3.7.7 Future regulatory trends and impact analysis
- 3.7.1 Global regulatory framework
- 3.8 Impact forces
- 3.8.1 Growth drivers
- 3.8.1.1 Rising demand for natural sweeteners and healthy snacks
- 3.8.1.2 Expanding cultivation in non-traditional regions
- 3.8.1.3 Government support and investment in agricultural infrastructure
- 3.8.1.4 Increased global consumption during religious and cultural events
- 3.8.2 Industry pitfalls & challenges
- 3.8.2.1 Vulnerability to climate change and water scarcity
- 3.8.2.2 Post-harvest losses due to inadequate storage and processing facilities
- 3.8.1 Growth drivers
- 3.9 Processing technologies and manufacturing
- 3.9.1 Date fruit processing overview
- 3.9.2 Traditional processing methods
- 3.9.3 Modern processing technologies
- 3.9.3.1 Washing and cleaning
- 3.9.3.2 Sorting and grading
- 3.9.3.3 Drying and dehydration
- 3.9.3.4 Pitting and chopping
- 3.9.3.5 Packaging and preservation
- 3.9.4 Date syrup production
- 3.9.4.1 Extraction methods
- 3.9.4.2 Concentration and refining
- 3.9.4.3 Quality control and standards
- 3.9.5 Date paste and powder production
- 3.9.5.1 Manufacturing process
- 3.9.5.2 Equipment and technology
- 3.9.5.3 Quality parameters
- 3.9.6 Value-added processing
- 3.9.6.1 Fermentation technologies
- 3.9.6.2 Extraction of bioactive compounds
- 3.9.6.3 Novel processing techniques
- 3.9.7 Packaging innovations and shelf-life extension
- 3.9.8 Quality assurance and food safety systems
- 3.9.9 Technological advancements and future trends
- 3.10 Supply chain analysis and distribution channels
- 3.10.1 Supply chain structure
- 3.10.2 Key stakeholders in the supply chain
- 3.10.2.1 Farmers and producers
- 3.10.2.2 Processors and manufacturers
- 3.10.2.3 Distributors and wholesalers
- 3.10.2.4 Retailers and end-users
- 3.10.3 Distribution channels
- 3.10.3.1 Direct sales
- 3.10.3.2 Supermarkets and hypermarkets
- 3.10.3.3 Specialty stores
- 3.10.3.4 Online retail
- 3.10.3.5 Traditional markets
- 3.10.4 Supply chain challenges
- 3.10.4.1 Post-harvest losses
- 3.10.4.2 Cold chain infrastructure
- 3.10.4.3 Transportation and logistics
- 3.10.4.4 Quality control and traceability
- 3.10.5 Supply chain optimization strategies
- 3.10.5.1 Vertical integration
- 3.10.5.2 Collaborative approaches
- 3.10.5.3 Technology integration
- 3.10.5.4 Sustainable supply chain practices
- 3.10.6 E-commerce and digital platforms
- 3.10.7 Future trends in date palm supply chain management
- 3.11 Technological innovations and R&D
- 3.11.1 Innovations in date palm cultivation
- 3.11.1.1 Precision agriculture and smart farming
- 3.11.1.2 Drone technology for pollination and monitoring
- 3.11.1.3 IOT and AI applications in date farming
- 3.11.1.4 Genetic improvement and breeding programs
- 3.11.1.5 Climate-smart agricultural practices
- 3.11.2 Advancements in harvesting technologies
- 3.11.2.1 Mechanized harvesting equipment
- 3.11.2.2 Robotic and automated systems
- 3.11.2.3 Shaking machines and other innovations
- 3.11.3 Innovations in processing and value addition
- 3.11.3.1 Novel extraction technologies
- 3.11.3.2 Advanced drying and preservation methods
- 3.11.3.3 Nanotechnology applications
- 3.11.3.4 Fermentation and bioprocessing innovations
- 3.11.4 Packaging innovations
- 3.11.4.1 Smart and active packaging
- 3.11.4.2 Sustainable packaging solutions
- 3.11.4.3 Modified atmosphere packaging (MAP)
- 3.11.4.4 Shelf-life extension technologies
- 3.11.5 Digital technologies in supply chain management
- 3.11.5.1 Blockchain for traceability
- 3.11.5.2 Big data analytics
- 3.11.5.3 E-commerce and digital marketing platforms
- 3.11.6 Patent landscape and intellectual property
- 3.11.7 Research institutions and innovation hubs
- 3.11.8 Future technological trends
- 3.11.1 Innovations in date palm cultivation
- 3.12 Pricing analysis and cost structure
- 3.12.1 Global pricing trends
- 3.12.2 Price point analysis by variety
- 3.12.3 Price point analysis by region
- 3.12.4 Price point analysis by product type
- 3.12.5 Factors influencing pricing
- 3.12.5.1 Production costs
- 3.12.5.2 Quality and grade
- 3.12.5.3 Supply-demand dynamics
- 3.12.5.4 Seasonal variations
- 3.12.6 Cost structure analysis
- 3.12.6.1 Cultivation and harvesting costs
- 3.12.6.2 Processing and manufacturing costs
- 3.12.6.3 Packaging and distribution costs
- 3.12.6.4 Marketing and sales costs
- 3.12.7 Margin analysis across value chain
- 3.12.8 Price forecast and future trends
- 3.13 Growth potential analysis
- 3.14 Porter’s analysis
- 3.15 PESTEL analysis
Chapter 4 Competitive Landscape, 2024
- 4.1 Introduction
- 4.2 Company market share analysis
- 4.3 Competitive positioning matrix
- 4.4 Strategic outlook matrix
- 4.5 Investment opportunities and strategic recommendations
- 4.5.1 Strategic recommendations for market participants
- 4.5.1.1 For producers and farmers
- 4.5.1.2 For processors and manufacturers
- 4.5.1.3 For distributors and retailers
- 4.5.1.4 For investors and financial institutions
- 4.5.1.5 For government and regulatory bodies
- 4.5.2 Market entry strategies
- 4.5.2.1 Joint ventures and partnerships
- 4.5.2.2 Mergers and acquisitions
- 4.5.2.3 Licensing and franchising
- 4.5.2.4 Direct investment
- 4.5.3 Product development and innovation strategies
- 4.5.4 Marketing and branding strategies
- 4.5.5 Risk assessment and mitigation strategies
- 4.5.6 Long-term growth strategies
- 4.5.1 Strategic recommendations for market participants
Chapter 5 Market Estimates & Forecast, By Product Type, 2021-2034 (USD Billion) (Kilo Tons)
- 5.1 Key trends
- 5.2 Fresh dates
- 5.3 Dried dates
- 5.4 Date syrup
- 5.5 Date paste
- 5.6 Date powder
- 5.7 Other date products
Chapter 6 Market Estimates & Forecast, By Nature, 2021-2034 (USD Billion) (Kilo Tons)
- 6.1 Key trends
- 6.2 Conventional dates
- 6.3 Organic dates
Chapter 7 Market Estimates & Forecast, By Form, 2021-2034 (USD Billion) (Kilo Tons)
- 7.1 Key trends
- 7.2 Whole dates
- 7.3 Chopped dates
- 7.4 Pitted dates
- 7.5 Date pieces
Chapter 8 Market Estimates & Forecast, By Application, 2021-2034 (USD Billion) (Kilo Tons)
- 8.1 Key trends
- 8.2 Food and beverage applications
- 8.2.1 Bakery and confectionery
- 8.2.2 Dairy products
- 8.2.3 Snacks and bars
- 8.2.4 Breakfast cereals
- 8.2.5 Beverages and drinks
- 8.2.6 Other food applications
- 8.3 Dietary supplements and nutraceuticals
- 8.3.1 Nutritional supplements
- 8.3.2 Functional foods
- 8.3.3 Sports nutrition
- 8.4 Pharmaceutical applications
- 8.4.1 Traditional medicine
- 8.4.2 Modern pharmaceuticals
- 8.5 Cosmetics and personal care
- 8.5.1 Skincare products
- 8.5.2 Haircare products
- 8.5.3 Other personal care applications
- 8.6 Animal feed
- 8.6.1 Livestock feed
- 8.6.2 Pet food
- 8.7 Industrial applications
- 8.7.1 Biofuel production
- 8.7.2 Textile industry
- 8.7.3 Other industrial uses
Chapter 9 Market Estimates & Forecast, By Region, 2021-2034 (USD Billion) (Kilo Tons)
- 9.1 Key trends
- 9.2 North America
- 9.2.1 U.S.
- 9.2.2 Canada
- 9.3 Europe
- 9.3.1 UK
- 9.3.2 Germany
- 9.3.3 France
- 9.3.4 Italy
- 9.3.5 Spain
- 9.3.6 Netherlands
- 9.4 Asia Pacific
- 9.4.1 China
- 9.4.2 India
- 9.4.3 Japan
- 9.4.4 South Korea
- 9.4.5 Australia
- 9.5 Latin America
- 9.5.1 Brazil
- 9.5.2 Mexico
- 9.5.3 Argentina
- 9.6 MEA
- 9.6.1 South Africa
- 9.6.2 Saudi Arabia
- 9.6.3 UAE
Chapter 10 Company Profiles
- 10.1 Al Barakah Dates Factory L.L.C
- 10.2 Al Wathba Marionnet
- 10.3 Atul Rajasthan Date Palms
- 10.4 Barari Group
- 10.5 Bard Valley Natural Delights
- 10.6 Barkaat Dates
- 10.7 Emirates Dates
- 10.8 GNS Pakistan
- 10.9 Groundworks
- 10.10 Haifa Datte
- 10.11 Hadiklaim
- 10.12 Kutch Crop Services Pvt. Ltd.
- 10.13 Maghadi
- 10.14 Phoenix Agrotech LLC
- 10.15 Royal Palm Dates Group
- 10.16 Vaidehi Foods Pvt. Ltd.
