


 |
市場調查報告書
商品編碼
1684596
日期產品市場機會、成長動力、產業趨勢分析與預測 2025 - 2034Date Product Market Opportunity, Growth Drivers, Industry Trend Analysis, and Forecast 2025 - 2034 |
||||||
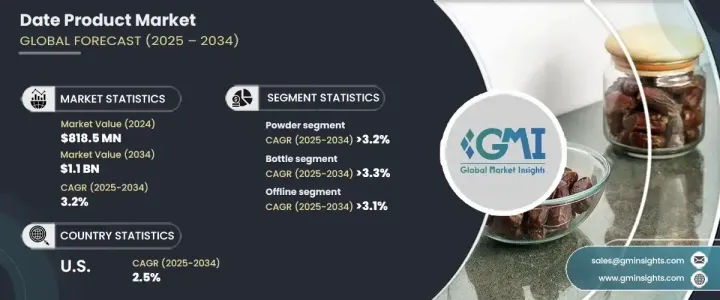
2024 年全球棗子產品市場價值為 8.185 億美元,預計 2025 年至 2034 年期間將以 3.2% 的複合年成長率穩步成長。隨著對清潔標籤、有機成分的需求不斷增加,棗糊、糖漿和棗粉等棗子產品作為精製糖的天然替代品,用途廣泛,越來越受歡迎。
隨著消費者健康意識的增強,他們意識到棗的許多健康益處,從而推動了市場擴張。棗不僅富含纖維,而且還具有抗氧化特性並有助於消化,這使其成為尋求營養食品的人們的一個有吸引力的選擇。人們對植物性飲食和純素食主義的興趣日益濃厚,進一步推動了市場的發展,這兩者都推動了對零食、飲料和糖果中棗類成分的需求。
| 市場範圍 | |
|---|---|
| 起始年份 | 2024 |
| 預測年份 | 2025-2034 |
| 起始值 | 8.185億美元 |
| 預測值 | 11億美元 |
| 複合年成長率 | 3.2% |
除了健康趨勢外,包裝創新在提高椰棗產品的可及性方面也發揮關鍵作用。現代包裝解決方案使消費者更方便地將基於棗的成分納入日常飲食中,從而增強了其吸引力。隨著越來越多的人尋求天然、未經加工的替代品,從保健健身到食品製造等各個行業對棗產品的需求持續成長。
僅棗粉部分,2024 年的價值就達到 3.272 億美元,預計在整個預測期內的複合年成長率為 3.2%。棗粉越來越受到注重健康的人士的青睞,因為它是一種有益健康的天然甜味選擇。棗粉富含維生素、纖維和抗氧化劑,正成為冰沙、蛋白質奶昔和能量棒的主要成分。清潔標籤趨勢強調有機、最低限度加工的成分,進一步促進了該產品在尋求非基因改造替代品的消費者中的受歡迎程度的上升。
在包裝方面,瓶裝部分的市值在 2024 年為 3.696 億美元,預計未來十年的複合年成長率為 3.3%。瓶裝包裝正迅速成為棗子產品的首選,尤其是棗子糖漿等液體產品。瓶裝包裝的便利性、易用性和卓越的保存性使其成為保持產品新鮮度和確保品質的高效解決方案。包裝的透明度也使得消費者能夠在購買前評估產品的完整性,進一步提升了其受歡迎程度。
2024 年,美國棗類產品市場規模達到 1.373 億美元,預計到 2034 年複合年成長率將達到 2.5%。隨著對高纖維和富含抗氧化劑產品的需求不斷增加,以棗子為基礎的成分正成為能量棒、冰沙和烘焙食品等以健康為中心的產品的常見成分。
目錄
第 1 章:方法論與範圍
- 市場範圍和定義
- 基礎估算與計算
- 預測計算
- 資料來源
- 基本的
- 次要
- 付費來源
- 公共資源
第 2 章:執行摘要
第 3 章:產業洞察
- 產業生態系統分析
- 影響價值鏈的因素
- 利潤率分析
- 中斷
- 未來展望
- 製造商
- 經銷商
- 供應商概況
- 利潤率分析
- 重要新聞及舉措
- 監管格局
- 衝擊力
- 成長動力
- 對天然甜味劑的需求不斷增加
- 消費者健康意識不斷增強
- 植物性飲食和純素飲食的流行
- 有機產品和清潔標籤產品的成長
- 產業陷阱與挑戰
- 棗製品生產成本高
- 某些地區的認知度有限
- 成長動力
- 成長潛力分析
- 波特的分析
- PESTEL 分析
第4章:競爭格局
- 介紹
- 公司市佔率分析
- 競爭定位矩陣
- 戰略展望矩陣
第 5 章:市場估計與預測:按類型,2021 年至 2034 年
- 主要趨勢
- 粉末
- 糖漿
- 貼上
- 其他
第6章:市場估計與預測:依包裝類型,2021-2034 年
- 主要趨勢
- 小袋
- 管
- 瓶子
- 其他
第 7 章:市場估計與預測:按配銷通路,2021-2034 年
- 主要趨勢
- 離線
- 便利商店
- 專賣店
- 超市/大賣場
- 其他
- 線上
- 品牌網站
- 電子商務平台
第 8 章:市場估計與預測:按地區,2021 年至 2034 年
- 主要趨勢
- 北美洲
- 美國
- 加拿大
- 歐洲
- 英國
- 德國
- 法國
- 義大利
- 西班牙
- 俄羅斯
- 亞太地區
- 中國
- 印度
- 日本
- 韓國
- 澳洲
- 拉丁美洲
- 巴西
- 墨西哥
- 中東及非洲
- 南非
- 沙烏地阿拉伯
- 阿拉伯聯合大公國
第9章:公司簡介
- Al Barakah Dates Factory
- Al Foah
- Arat Company PJS
- Arava Dates
- Ario
- Atul Rajasthan Date Palm
- Barari Group
- Bateel International
- Bayara Saudi Arabia
- Emirates Dates
- GNS Pakistan
- Hadiklaim Date Growers Cooperative
The Global Date Product Market was valued at USD 818.5 million in 2024 and is projected to experience steady growth at a CAGR of 3.2% from 2025 to 2034. This growth is largely attributed to a shift in consumer preferences towards natural, healthy sweeteners and functional food options. With an increasing demand for clean-label, organic ingredients, date products such as paste, syrup, and powder are gaining popularity due to their versatility as natural alternatives to refined sugars.
As consumers become more health-conscious, their awareness of the numerous health benefits of dates has fueled market expansion. Dates are not only rich in fiber, but they also boast antioxidant properties and aid in digestion, making them an attractive option for those seeking nutritious food choices. The market is further driven by rising interest in plant-based diets and veganism, both of which have boosted demand for date-based ingredients in snacks, beverages, and confectionery.
| Market Scope | |
|---|---|
| Start Year | 2024 |
| Forecast Year | 2025-2034 |
| Start Value | $818.5 Million |
| Forecast Value | $1.1 Billion |
| CAGR | 3.2% |
In addition to health trends, innovations in packaging are playing a pivotal role in increasing the accessibility of date products. Modern packaging solutions make it more convenient for consumers to incorporate date-based ingredients into their daily diets, thus enhancing their appeal. As more people seek natural, unprocessed alternatives, the demand for date products continues to grow across various industries, from wellness and fitness to food manufacturing.
The date powder segment alone was valued at USD 327.2 million in 2024 and is projected to grow at a CAGR of 3.2% throughout the forecast period. Date powder is increasingly favored by health-conscious individuals as it provides a wholesome, natural sweetening option. Packed with vitamins, fiber, and antioxidants, date powder is becoming a staple ingredient in smoothies, protein shakes, and energy bars. The clean-label trend, which emphasizes organic, minimally processed ingredients, further contributes to the product's rise in popularity among consumers looking for non-GMO alternatives.
In terms of packaging, the bottle segment held a market value of USD 369.6 million in 2024 and is expected to expand at a CAGR of 3.3% over the next decade. Bottled packaging is rapidly becoming the preferred choice for date products, particularly for liquid offerings like date syrup. The convenience, ease of use, and superior preservation that bottle packaging offers make it a highly effective solution for maintaining product freshness and ensuring quality. The transparency of the packaging also allows consumers to assess the product's integrity before purchasing, further boosting its popularity.
The date product market in the U.S. reached USD 137.3 million in 2024 and is anticipated to grow at a CAGR of 2.5% through 2034. This is largely due to growing consumer preference for healthier, more natural alternatives to refined sugars. With increasing demand for high-fiber and antioxidant-rich products, date-based ingredients are becoming a common feature in health-focused offerings such as energy bars, smoothies, and baked goods.
Table of Contents
Chapter 1 Methodology & Scope
- 1.1 Market scope & definitions
- 1.2 Base estimates & calculations
- 1.3 Forecast calculations
- 1.4 Data sources
- 1.4.1 Primary
- 1.4.2 Secondary
- 1.4.2.1 Paid sources
- 1.4.2.2 Public sources
Chapter 2 Executive Summary
- 2.1 Industry synopsis, 2021-2034
Chapter 3 Industry Insights
- 3.1 Industry ecosystem analysis
- 3.1.1 Factor affecting the value chain
- 3.1.2 Profit margin analysis
- 3.1.3 Disruptions
- 3.1.4 Future outlook
- 3.1.5 Manufacturers
- 3.1.6 Distributors
- 3.2 Supplier landscape
- 3.3 Profit margin analysis
- 3.4 Key news & initiatives
- 3.5 Regulatory landscape
- 3.6 Impact forces
- 3.6.1 Growth drivers
- 3.6.1.1 Increasing demand for natural sweeteners
- 3.6.1.2 Rising health consciousness among consumers
- 3.6.1.3 Popularity of plant-based and vegan diets
- 3.6.1.4 Growth in organic and clean-label products
- 3.6.2 Industry pitfalls & challenges
- 3.6.2.1 High production costs of date products
- 3.6.2.2 Limited awareness in certain regions
- 3.6.1 Growth drivers
- 3.7 Growth potential analysis
- 3.8 Porter's analysis
- 3.9 PESTEL analysis
Chapter 4 Competitive Landscape, 2024
- 4.1 Introduction
- 4.2 Company market share analysis
- 4.3 Competitive positioning matrix
- 4.4 Strategic outlook matrix
Chapter 5 Market Estimates & Forecast, By Type, 2021-2034 (USD Million) (Tons)
- 5.1 Key trends
- 5.2 Powder
- 5.3 Syrup
- 5.4 Paste
- 5.5 Others
Chapter 6 Market Estimates & Forecast, By Packaging type, 2021-2034 (USD Million) (Tons)
- 6.1 Key trends
- 6.2 Pouch
- 6.3 Tubes
- 6.4 Bottles
- 6.5 Others
Chapter 7 Market Estimates & Forecast, By Distribution channel, 2021-2034 (USD Million) (Tons)
- 7.1 Key trends
- 7.2 Offline
- 7.2.1 Convenience store
- 7.2.2 Specialty stores
- 7.2.3 Supermarkets/hypermarkets
- 7.2.4 Others
- 7.3 Online
- 7.3.1 Brand websites
- 7.3.2 E-commerce platforms
Chapter 8 Market Estimates & Forecast, By Region, 2021-2034 (USD Million) (Tons)
- 8.1 Key trends
- 8.2 North America
- 8.2.1 U.S.
- 8.2.2 Canada
- 8.3 Europe
- 8.3.1 UK
- 8.3.2 Germany
- 8.3.3 France
- 8.3.4 Italy
- 8.3.5 Spain
- 8.3.6 Russia
- 8.4 Asia Pacific
- 8.4.1 China
- 8.4.2 India
- 8.4.3 Japan
- 8.4.4 South Korea
- 8.4.5 Australia
- 8.5 Latin America
- 8.5.1 Brazil
- 8.5.2 Mexico
- 8.6 MEA
- 8.6.1 South Africa
- 8.6.2 Saudi Arabia
- 8.6.3 UAE
Chapter 9 Company Profiles
- 9.1 Al Barakah Dates Factory
- 9.2 Al Foah
- 9.3 Arat Company PJS
- 9.4 Arava Dates
- 9.5 Ario
- 9.6 Atul Rajasthan Date Palm
- 9.7 Barari Group
- 9.8 Bateel International
- 9.9 Bayara Saudi Arabia
- 9.10 Emirates Dates
- 9.11 GNS Pakistan
- 9.12 Hadiklaim Date Growers Cooperative
