


 |
市場調查報告書
商品編碼
1750306
先進光學材料市場機會、成長動力、產業趨勢分析及 2025 - 2034 年預測Advanced Optics Material Market Opportunity, Growth Drivers, Industry Trend Analysis, and Forecast 2025 - 2034 |
||||||
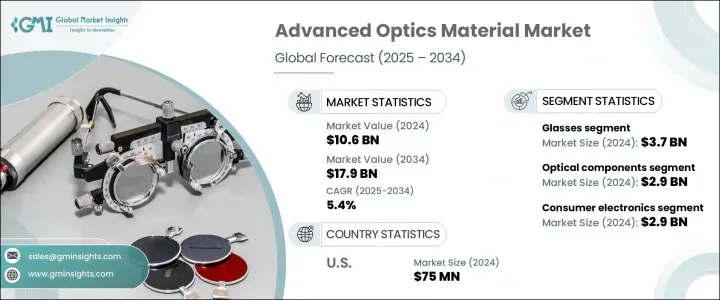
2024年,全球先進光學材料市場規模達106億美元,預計到2034年將以5.4%的複合年成長率成長,達到179億美元,這得益於各行各業對精密高性能光學元件日益成長的需求。擴增實境(AR)、虛擬實境(VR)、雷射雷達(LiDAR)和數位技術的快速普及,提升了先進光學元件在汽車系統、智慧消費性電子產品和國防應用中的重要性。同樣,對微創診斷和即時健康監測的日益依賴,也推動了精密光學元件在醫療保健領域的應用。
製造業的進步,尤其是透過人工智慧驅動的積層製造和雷射輔助工藝,正在使客製化光學元件更加可行且更具可擴展性。這些技術正在縮短生產時間、最大限度地減少浪費,並實現複雜光學幾何形狀所需的精度,這在航太、國防和生物醫學成像等領域尤其有價值。同時,奈米結構和元光學材料的持續研究推動著各種應用中更緊湊、更輕、更高效的光學解決方案的演變。這些新一代材料對光的行為(例如在奈米級的彎曲、濾波或聚焦)提供了前所未有的控制,為擴增實境、量子運算和光子晶片的革命性發展鋪平了道路。這些創新共同設定了新的性能基準,並拓展了先進光學的前沿。
| 市場範圍 | |
|---|---|
| 起始年份 | 2024 |
| 預測年份 | 2025-2034 |
| 起始值 | 106億美元 |
| 預測值 | 179億美元 |
| 複合年成長率 | 5.4% |
就材料而言,2024年玻璃佔35.3%的市場佔有率,估值達37億美元。玻璃因其卓越的清晰度和熱穩定性,在高性能鏡頭和精密光學元件中備受青睞。然而,聚合物基替代品因其成本效益和輕量化特性,在消費性電子產品和醫療器材領域也逐漸普及。新型聚合物成分具有更強的抗紫外線和折射性能,進一步拓展了其應用範圍。此外,藍寶石和鈮酸鋰等特殊材料因其耐熱性和雙折射特性,在高頻和雷射系統中日益受到青睞。
消費電子領域在2024年的市場規模為29億美元,預計到2034年的複合年成長率為5.9%。智慧眼鏡、可折疊顯示器以及緊湊型高解析度攝影機的進步,推動了對多功能且節省空間的光學材料的需求。醫療保健領域將光學元件整合到診斷工具、手術設備和生物相容性儀器中,以提高精確度和病患安全性。在國防和工業安全領域,能夠承受極端溫度並提供高解析度監控和瞄準的堅固耐用的光學元件的需求正在不斷成長。
美國先進光學材料市場規模達7,500萬美元,預計年複合成長率將達到6.9%,這得益於該地區航太、國防和科技開發活動的集中。政府和私人部門在光子學、整合光學和量子技術領域的大量投資,進一步推動了氮化矽和鈮酸鋰等新型材料在下一代通訊和感測應用中的應用。
該行業的領先公司包括豪雅 (Hoya Corporation)、愛特蒙特光學 (Edmund Optics)、CoorsTek、賀利氏控股 (Heraeus Holding) 和康寧公司 (Corning Incorporated)。這些公司專注於擴大研發投入、進行跨產業合作並增強製造能力。透過在材料科學領域進行創新並順應新興技術趨勢,這些公司旨在保持其全球領先地位,並滿足傳統和顛覆性應用領域不斷變化的客戶需求。
目錄
第1章:方法論與範圍
第2章:執行摘要
第3章:行業洞察
- 產業生態系統分析
- 影響價值鏈的因素
- 利潤率分析
- 中斷
- 未來展望
- 製造商
- 經銷商
- 川普政府關稅
- 對貿易的影響
- 貿易量中斷
- 報復措施
- 對產業的影響
- 供應方影響(原料)
- 主要材料價格波動
- 供應鏈結構
- 生產成本影響
- 供應方影響(原料)
- 需求面影響(售價)
- 價格傳導至終端市場
- 市佔率動態
- 消費者反應模式
- 受影響的主要公司
- 策略產業反應
- 供應鏈重組
- 定價和產品策略
- 政策參與
- 展望與未來考慮
- 對貿易的影響
- 貿易統計資料(HS 編碼) 註:以上貿易統計僅提供重點國家。
- 2021-2024年主要出口國
- 2021-2024年主要進口國
- 供應商格局
- 利潤率分析
- 重要新聞和舉措
- 監管格局
- 衝擊力
- 成長動力
- 對高性能光學元件的需求不斷成長
- 光子學和量子光學的進展
- 電信領域的應用日益增多
- 醫療保健和醫療器材領域的採用率不斷上升
- 產業陷阱與挑戰
- 生產成本高
- 原料供應
- 監管挑戰
- 成長動力
- 市場機會
- 擴增實境和虛擬實境的新興應用
- 對先進感測技術的需求不斷成長
- 自動駕駛汽車系統的擴展
- 仿生光學材料的開發
- 成長潛力分析
- 監理框架分析
- REACH和ROHS法規
- 出口管制法規
- 環境合規要求
- 處理和加工的安全標準
- 技術格局
- 當前的技術趨勢
- 新興技術
- 研發措施與創新管道
- 專利分析
- 波特的分析
- PESTEL分析
第4章:競爭格局
- 介紹
- 市佔率分析
- 全球製造商市場佔有率
- 各製造商的區域市場佔有率
- 競爭基準測試
- 產品組合比較
- 技術能力比較
- 研發投入對比
- 製造能力比較
- 策略舉措和發展
- 併購
- 夥伴關係與合作
- 產品發布和創新
- 擴張計劃
- 競爭定位矩陣
- 戰略儀表板
第5章:市場估計與預測:依材料類型,2021-2034
- 主要趨勢
- 玻璃材質
- 光學玻璃
- 熔融石英
- 硼矽酸鹽玻璃
- 特種玻璃
- 其他
- 聚合物材料
- 聚甲基丙烯酸甲酯(PMMA)
- 聚碳酸酯(PC)
- 環狀烯烴聚合物(COP)
- 環烯烴共聚物(COC)
- 其他
- 晶體材料
- 藍寶石
- 矽
- 鎗
- 硒化鋅
- 氟化鈣
- 其他
- 陶瓷材料
- 透明陶瓷
- 氧氮化鋁(ALON)
- 鎂鋁尖晶石
- 釔鋁石榴石(YAG)
- 其他
- 金屬材料
- 鋁
- 銀
- 金子
- 其他
- 先進複合材料
- 光子晶體
- 超材料
- 奈米材料
- 其他
第6章:市場估計與預測:按應用,2021-2034
- 主要趨勢
- 光學元件
- 鏡頭
- 鏡子
- 棱鏡
- 視窗
- 過濾器
- 繞射光柵
- 其他
- 光電裝置
- 發光二極體 (LED)
- 雷射二極體
- 光電探測器
- 太陽能電池
- 光調製器
- 其他
- 影像系統
- 相機
- 顯微鏡
- 望遠鏡
- 熱成像
- 其他
- 光通訊
- 光纖
- 波導
- 光放大器
- 光開關
- 其他
- 感測與測量
- 光學感測器
- 光譜學
- 干涉測量法
- 其他
- 顯示技術
- LCD顯示器
- OLED顯示器
- AR/VR顯示器
- 其他
- 其他
第7章:市場估計與預測:按最終用途產業,2021-2034 年
- 主要趨勢
- 消費性電子產品
- 智慧型手機
- 相機
- 穿戴式裝置
- 其他
- 醫療保健
- 診斷設備
- 手術器械
- 治療系統
- 醫學影像
- 其他
- 國防和安全
- 夜視
- 瞄準系統
- 監視
- 其他
- 電信
- 光網路
- 資料中心
- 5G基礎設施
- 其他
- 汽車
- 照明系統
- 抬頭顯示器
- LiDAR系統
- 駕駛員輔助系統
- 其他
- 航太
- 航空電子設備
- 導航系統
- 衛星組件
- 其他
- 工業的
- 機器視覺
- 雷射加工
- 品質管制
- 其他
- 能源
- 太陽能
- 光電
- 其他
- 研究與開發
- 其他
第8章:市場估計與預測:按地區,2021-2034
- 主要趨勢
- 北美洲
- 美國
- 加拿大
- 歐洲
- 英國
- 德國
- 法國
- 義大利
- 西班牙
- 歐洲其他地區
- 亞太地區
- 中國
- 印度
- 日本
- 韓國
- 澳洲
- 亞太其他地區
- 拉丁美洲
- 巴西
- 墨西哥
- 阿根廷
- 拉丁美洲其他地區
- MEA
- 南非
- 沙烏地阿拉伯
- 阿拉伯聯合大公國
- 中東和非洲其他地區
第9章:公司簡介
- CoorsTek
- Corning Incorporated
- Edmund Optics
- Heraeus Holding
- Hoya Corporation
- II-VI Incorporated
- Materion Corporation
- Newport Corporation
- Nikon Corporation
- Ohara Corporation
- SCHOTT
- Sumitomo Electric Industries
- Surmet Corporation
- Thorlabs
- ZEISS Group
The Global Advanced Optics Material Market was valued at USD 10.6 billion in 2024 and is estimated to grow at a CAGR of 5.4% to reach USD 17.9 billion by 2034, driven by the increasing demand for precise, high-performance optical components across multiple industries. Rapid adoption of AR, VR, LiDAR, and digital technologies elevates the importance of advanced optics in automotive systems, smart consumer electronics, and defense applications. Similarly, the growing reliance on minimally invasive diagnostics and real-time health monitoring is boosting the adoption of precision optics in the healthcare sector.
Advancements in manufacturing, particularly through AI-driven additive and laser-assisted processes, are making custom optical parts more feasible and scalable. These technologies are reducing production time, minimizing waste, and enabling the precision required for intricate optical geometries, which is especially valuable in fields like aerospace, defense, and biomedical imaging. In parallel, ongoing research in nanostructured and meta-optical materials drives the evolution of more compact, lightweight, and efficient optical solutions across diverse applications. These next-generation materials offer unprecedented control over light behavior, such as bending, filtering, or focusing at nanoscale levels, paving the way for revolutionary developments in augmented reality, quantum computing, and photonic chips. Together, these innovations are setting new performance benchmarks and expanding the frontier of advanced optics.
| Market Scope | |
|---|---|
| Start Year | 2024 |
| Forecast Year | 2025-2034 |
| Start Value | $10.6 Billion |
| Forecast Value | $17.9 Billion |
| CAGR | 5.4% |
In terms of material, glass held 35.3% market share in 2024 with a valuation of USD 3.7 billion. Glass is favored for its superior clarity and heat stability in high-performance lenses and precision optics. However, polymer-based alternatives gain ground in consumer electronics and medical instruments due to their cost-effectiveness and lightweight properties. Newer polymer compositions with enhanced UV resistance and refractive performance expand their utility. Additionally, specialty materials such as sapphire and lithium niobate are gaining prominence in high-frequency and laser-based systems due to their thermal durability and birefringence characteristics.
The consumer electronics segment accounted for USD 2.9 billion in 2024, with a projected CAGR of 5.9% through 2034. Advancements in smart glasses, foldable displays, and compact, high-resolution cameras fuel demand for multifunctional and space-efficient optical materials. The healthcare sector integrates optics into diagnostic tools, surgical devices, and biocompatible instruments, enhancing precision and patient safety. In defense and industrial security, rugged optics that can withstand extreme temperatures and deliver high-resolution surveillance and targeting are seeing rising demand.
United States Advanced Optics Material Market reached USD 75 million and is expected to grow at a 6.9% CAGR, underpinned by a concentration of aerospace, defense, and tech development activities across the region. Substantial government and private investment in photonics, integrated optics, and quantum technologies is further propelling the use of novel materials like silicon nitride and lithium niobate in next-gen communication and sensing applications.
Leading companies in this industry include Hoya Corporation, Edmund Optics, CoorsTek, Heraeus Holding, and Corning Incorporated. These players focus on expanding R&D investments, forming cross-industry collaborations, and strengthening their manufacturing capabilities. By innovating in material science and aligning with emerging tech trends, these companies aim to maintain their global leadership and meet evolving customer needs in traditional and disruptive application areas.
Table of Contents
Chapter 1 Methodology & Scope
- 1.1 Market scope & definitions
- 1.2 Base estimates & calculations
- 1.3 Forecast calculations
- 1.4 Data sources
- 1.4.1 Primary
- 1.4.2 Secondary
- 1.4.2.1 Paid sources
- 1.4.2.2 Public sources
Chapter 2 Executive Summary
- 2.1 Industry synopsis, 2021-2034
Chapter 3 Industry Insights
- 3.1 Industry ecosystem analysis
- 3.1.1 Factor affecting the value chain
- 3.1.2 Profit margin analysis
- 3.1.3 Disruptions
- 3.1.4 Future outlook
- 3.1.5 Manufacturers
- 3.1.6 Distributors
- 3.2 Trump administration tariffs
- 3.2.1 Impact on trade
- 3.2.1.1 Trade volume disruptions
- 3.2.1.2 Retaliatory measures
- 3.2.2 Impact on the industry
- 3.2.2.1 Supply-side impact (raw materials)
- 3.2.2.1.1 Price volatility in key materials
- 3.2.2.1.2 Supply chain structure
- 3.2.2.1.3 Production cost implications
- 3.2.2.1 Supply-side impact (raw materials)
- 3.2.3 Demand-side impact (selling price)
- 3.2.3.1 Price transmission to end markets
- 3.2.3.2 Market share dynamics
- 3.2.3.3 Consumer response patterns
- 3.2.4 Key companies impacted
- 3.2.5 Strategic industry responses
- 3.2.5.1 Supply chain reconfiguration
- 3.2.5.2 Pricing and product strategies
- 3.2.5.3 Policy engagement
- 3.2.6 Outlook and future considerations
- 3.2.1 Impact on trade
- 3.3 Trade statistics (HS code) Note: the above trade statistics will be provided for key countries only.
- 3.3.1 Major exporting countries, 2021-2024 (kilo tons)
- 3.3.2 Major importing countries, 2021-2024 (kilo tons)
- 3.4 Supplier landscape
- 3.5 Profit margin analysis
- 3.6 Key news & initiatives
- 3.7 Regulatory landscape
- 3.8 Impact forces
- 3.8.1 Growth drivers
- 3.8.1.1 Growing demand for high-performance optical components
- 3.8.1.2 Advancements in photonics and quantum optics
- 3.8.1.3 Increasing applications in telecommunication
- 3.8.1.4 Rising adoption in healthcare and medical devices
- 3.8.2 Industry pitfalls & challenges
- 3.8.2.1 High production costs
- 3.8.2.2 Raw material supply
- 3.8.2.3 Regulatory challenges
- 3.8.1 Growth drivers
- 3.9 Market opportunities
- 3.9.1 Emerging applications in augmented and virtual reality
- 3.9.2 Growing demand for advanced sensing technologies
- 3.9.3 Expansion in autonomous vehicle systems
- 3.9.4 Development of biomimetic optical materials
- 3.10 Growth potential analysis
- 3.11 Regulatory framework analysis
- 3.11.1 Reach and ROHS regulations
- 3.11.2 Export control regulations
- 3.11.3 Environmental compliance requirements
- 3.11.4 Safety standards for handling and processing
- 3.12 Technology landscape
- 3.12.1 Current technological trends
- 3.12.2 Emerging technologies
- 3.12.3 R&D initiatives and innovation pipeline
- 3.12.4 Patent analysis
- 3.13 Porter's analysis
- 3.14 PESTEL analysis
Chapter 4 Competitive Landscape, 2024
- 4.1 Introduction
- 4.2 Market share analysis
- 4.2.1 Global market share by manufacturer
- 4.2.2 Regional market share by manufacturer
- 4.3 Competitive benchmarking
- 4.3.1 Product portfolio comparison
- 4.3.2 Technological capabilities comparison
- 4.3.3 R&D investment comparison
- 4.3.4 Manufacturing capacity comparison
- 4.4 Strategic initiatives & developments
- 4.4.1 Mergers & acquisitions
- 4.4.2 Partnerships & collaborations
- 4.4.3 Product launches & innovations
- 4.4.4 Expansion plans
- 4.5 Competitive positioning matrix
- 4.6 Strategic dashboard
Chapter 5 Market Estimates & Forecast, By Material Type, 2021-2034 (USD Billion) (Kilo Tons)
- 5.1 Key trends
- 5.2 Glass materials
- 5.2.1 Optical glass
- 5.2.2 Fused silica
- 5.2.3 Borosilicate glass
- 5.2.4 Specialty glass
- 5.2.5 Others
- 5.3 Polymeric materials
- 5.3.1 Polymethyl methacrylate (PMMA)
- 5.3.2 Polycarbonate (PC)
- 5.3.3 Cyclic olefin polymer (COP)
- 5.3.4 Cyclic olefin copolymer (COC)
- 5.3.5 Others
- 5.4 Crystalline materials
- 5.4.1 Sapphire
- 5.4.2 Silicon
- 5.4.3 Germanium
- 5.4.4 Zinc selenide
- 5.4.5 Calcium fluoride
- 5.4.6 Others
- 5.5 Ceramic materials
- 5.5.1 Transparent ceramics
- 5.5.2 Aluminum oxynitride (ALON)
- 5.5.3 Magnesium aluminate spinel
- 5.5.4 Yttrium aluminum garnet (YAG)
- 5.5.5 Others
- 5.6 Metallic materials
- 5.6.1 Aluminum
- 5.6.2 Silver
- 5.6.3 Gold
- 5.6.4 Others
- 5.7 Advanced composite materials
- 5.8 Photonic crystals
- 5.9 Metamaterials
- 5.10 Nanomaterials
- 5.11 Others
Chapter 6 Market Estimates & Forecast, By Application, 2021-2034 (USD Billion) (Kilo Tons)
- 6.1 Key trends
- 6.2 Optical components
- 6.2.1 Lenses
- 6.2.2 Mirrors
- 6.2.3 Prisms
- 6.2.4 Windows
- 6.2.5 Filters
- 6.2.6 Diffraction gratings
- 6.2.7 Others
- 6.3 Optoelectronic devices
- 6.3.1 Light emitting diodes (LEDs)
- 6.3.2 Laser diodes
- 6.3.3 Photodetectors
- 6.3.4 Solar cells
- 6.3.5 Optical modulators
- 6.3.6 Others
- 6.4 Imaging systems
- 6.4.1 Cameras
- 6.4.2 Microscopes
- 6.4.3 Telescopes
- 6.4.4 Thermal imaging
- 6.4.5 Others
- 6.5 Optical communication
- 6.5.1 Optical fibers
- 6.5.2 Waveguides
- 6.5.3 Optical amplifiers
- 6.5.4 Optical switches
- 6.5.5 Others
- 6.6 Sensing and measurement
- 6.6.1 Optical sensors
- 6.6.2 Spectroscopy
- 6.6.3 Interferometry
- 6.6.4 Others
- 6.7 Display technologies
- 6.7.1 LCD displays
- 6.7.2 OLED displays
- 6.7.3 AR/VR displays
- 6.7.4 Others
- 6.8 Others
Chapter 7 Market Estimates & Forecast, By End Use Industry, 2021-2034 (USD Billion) (Kilo Tons)
- 7.1 Key trends
- 7.2 Consumer electronics
- 7.2.1 Smartphones
- 7.2.2 Cameras
- 7.2.3 Wearable devices
- 7.2.4 Others
- 7.3 Healthcare and medical
- 7.3.1 Diagnostic equipment
- 7.3.2 Surgical devices
- 7.3.3 Therapeutic systems
- 7.3.4 Medical imaging
- 7.3.5 Others
- 7.4 Defense and security
- 7.4.1 Night vision
- 7.4.2 Targeting systems
- 7.4.3 Surveillance
- 7.4.4 Others
- 7.5 Telecommunications
- 7.5.1 Optical networks
- 7.5.2 Data centers
- 7.5.3 5g infrastructure
- 7.5.4 Others
- 7.6 Automotive
- 7.6.1 Lighting systems
- 7.6.2 Heads-up displays
- 7.6.3 Lidar systems
- 7.6.4 Driver assistance systems
- 7.6.5 Others
- 7.7 Aerospace
- 7.7.1 Avionics
- 7.7.2 Navigation systems
- 7.7.3 Satellite components
- 7.7.4 Others
- 7.8 Industrial
- 7.8.1 Machine vision
- 7.8.2 Laser processing
- 7.8.3 Quality control
- 7.8.4 Others
- 7.9 Energy
- 7.9.1 Solar energy
- 7.9.2 Photovoltaics
- 7.9.3 Others
- 7.10 Research and development
- 7.11 Others
Chapter 8 Market Estimates & Forecast, By Region, 2021-2034 (USD Billion) (Kilo Tons)
- 8.1 Key trends
- 8.2 North America
- 8.2.1 U.S.
- 8.2.2 Canada
- 8.3 Europe
- 8.3.1 UK
- 8.3.2 Germany
- 8.3.3 France
- 8.3.4 Italy
- 8.3.5 Spain
- 8.3.6 Rest of Europe
- 8.4 Asia Pacific
- 8.4.1 China
- 8.4.2 India
- 8.4.3 Japan
- 8.4.4 South Korea
- 8.4.5 Australia
- 8.4.6 Rest of Asia Pacific
- 8.5 Latin America
- 8.5.1 Brazil
- 8.5.2 Mexico
- 8.5.3 Argentina
- 8.5.4 Rest of Latin America
- 8.6 MEA
- 8.6.1 South Africa
- 8.6.2 Saudi Arabia
- 8.6.3 UAE
- 8.6.4 Rest of Middle East and Africa
Chapter 9 Company Profiles
- 9.1 CoorsTek
- 9.2 Corning Incorporated
- 9.3 Edmund Optics
- 9.4 Heraeus Holding
- 9.5 Hoya Corporation
- 9.6 II-VI Incorporated
- 9.7 Materion Corporation
- 9.8 Newport Corporation
- 9.9 Nikon Corporation
- 9.10 Ohara Corporation
- 9.11 SCHOTT
- 9.12 Sumitomo Electric Industries
- 9.13 Surmet Corporation
- 9.14 Thorlabs
- 9.15 ZEISS Group
 超材料市場:按類型、整合方法、頻段、應用、最終用戶和分銷管道分類-2026-2032年全球市場預測
 超材料市場(至 2035 年):依超材料類型、產品形式、應用、企業規模、終端用戶產業和地區劃分:產業趨勢和全球預測聲波超材料市場:按應用、類型、材料和頻率範圍分類,全球預測(2026-2032年)
 超材料市場:依類型、產品、波控制、應用和最終用戶劃分-全球預測至2036年
 2034年全球電磁超材料市場機會與策略
 全球超材料市場規模、佔有率、趨勢和成長分析報告(2026-2034)
 全球超材料市場按應用、最終用戶、產品、類型和地區分類-預測至2032年2026年全球超材料市場報告
 超材料市場規模、佔有率和趨勢分析報告:按產品、應用、最終用途、地區和細分市場預測(2026-2033 年)平面超透鏡市場按類型、材質、波長和應用分類 - 全球預測 2026-2032