

 |
市場調查報告書
商品編碼
1740950
物聯網 (IoT) 貨幣化市場機會、成長動力、產業趨勢分析及 2025 - 2034 年預測Internet of Things (IoT) Monetization Market Opportunity, Growth Drivers, Industry Trend Analysis, and Forecast 2025 - 2034 |
||||||
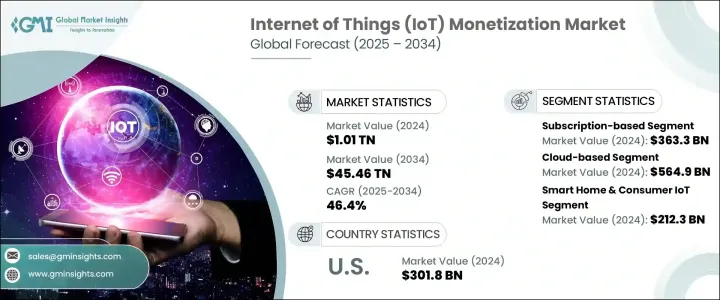
2024年,全球物聯網貨幣化市場規模達1.01兆美元,預計2034年將以46.4%的複合年成長率成長,達到45.46兆美元。隨著物聯網設備不斷深入日常生活——從智慧家庭、穿戴式裝置到工業自動化和車聯網——資料和連接貨幣化的範圍正呈指數級成長。住宅、城市和企業領域數位生態系統的興起正在改變企業對創造收入的思考。企業不再局限於一次性硬體銷售,而是迅速轉向經常性收入流、增值服務和基於結果的定價模式。
企業正在利用物聯網產生的資料來推動更智慧的決策、客製化使用者體驗,並開發響應即時使用情況的動態定價結構。隨著人工智慧和邊緣運算的蓬勃發展,企業正從被動服務模式轉向預測性和規範性的獲利策略。企業正在投資強大的雲端基礎設施、人工智慧驅動的分析和低程式碼平台,以創建可擴展的物聯網應用。同時,促進服務捆綁和跨平台整合的數位市場的興起,正在開闢新的收入管道,並深化客戶互動。
| 市場範圍 | |
|---|---|
| 起始年份 | 2024 |
| 預測年份 | 2025-2034 |
| 起始值 | 1.01兆美元 |
| 預測值 | 45.46兆美元 |
| 複合年成長率 | 46.4% |
然而,儘管物聯網貨幣化格局因創新而蓬勃發展,但它也在應對複雜的國際貿易動態。在美國貿易政策早期階段,對半導體和感測器等關鍵零件徵收關稅擾亂了全球供應鏈。這些擾亂推高了物聯網硬體的生產成本,使企業陷入困境——要麼將成本轉嫁給客戶,要麼承擔損失。這兩種選擇都影響了盈利能力,並減緩了採用速度,尤其是在中小型供應商中。作為回應,一些主要參與者選擇本地化生產以避開進口關稅。雖然這種轉變有助於降低未來貿易波動帶來的風險,但它也帶來了一些短期障礙,例如研發支出增加和延長投資回報時間。為了保持競爭力,越來越多的公司傾向於輕資產商業模式。這些模式更加重視軟體、平台和服務,使公司能夠將物聯網生態系統貨幣化,而無需過度依賴實體硬體。
訂閱模式在2024年佔據主導地位,市場估值達3,633億美元。透過提供可自訂的分級服務計劃,其中包含即時診斷、遠端監控和預測性維護等功能,企業正在將一次性設備銷售轉化為長期收入來源。這種模式使企業能夠根據使用情況進行擴展,實現靈活的定價,同時提升客戶忠誠度。預測分析在最佳化這些定價模型中發揮關鍵作用,幫助企業根據實際性能和消費趨勢調整收費。提供主動支持和持續價值的能力可以增強品牌忠誠度並推動經常性收入,使該模式成為各垂直行業最受歡迎的模式之一。
2024年,雲端運算領域創造了5,649億美元的收入,憑藉其敏捷性和成本效益,在物聯網貨幣化市場佔據主導地位。雲端基礎設施使企業能夠在全球範圍內推出互聯服務,而無需投資昂貴的本地基礎設施。它有助於即時資料收集、遠端資產控制和自動軟體更新——所有這些都是現代物聯網應用的必備功能。採用人工智慧解決方案的企業正在使用雲端平台來實施智慧計費系統、實現基於使用量的定價,並為個人用戶量身服務。這些功能在提高客戶滿意度的同時,降低了營運成本,使企業能夠快速調整業務佈局,並在不中斷的情況下進行擴展。
美國在物聯網貨幣化市場中處於領先地位,2024 年價值達 3,018 億美元。該國受益於廣泛的 5G 連接、成熟的雲端基礎設施以及支援性的政策框架。 《加州消費者隱私法案》(CCPA) 等法律為資料使用設定了明確的標準,同時也為匿名和聚合資料流的貨幣化打開了大門。汽車和醫療保健等行業正在推動這一發展勢頭。在汽車領域,連網汽車透過導航服務、維護警報和媒體訂閱等功能創造收入。在醫療保健領域,遠端監控設備支援基於結果的模式,即服務提供者的報酬是基於患者的健康狀況改善,而不僅僅是提供的服務。
為了在這個高成長市場中站穩腳跟,各大公司正在加倍投入雲端業務,增強低程式碼開發工具以實現更快的整合,並建立跨行業合作夥伴關係以提供捆綁服務。各大公司也專注於安全、匿名的資料交換,並建立針對特定產業的解決方案,以更好地服務關鍵產業。微軟、IBM、亞馬遜網路服務、西門子和谷歌等市場領導者正引領這些舉措,提供融合人工智慧、雲端運算和物聯網功能的綜合平台,為各行各業創造可衡量的價值。
目錄
第1章:方法論與範圍
第2章:執行摘要
第3章:行業洞察
- 產業生態系統分析
- 川普關稅對物聯網(IoT)貨幣化市場的影響
- 服務交付成本膨脹
- 關稅驅動的硬體成本增加
- 案例研究 - AWS IoT Core 對硬體相關服務的定價調整
- 供應鏈驅動的服務中斷
- 裝置部署延遲影響訂閱推出
- 轉向混合(雲/邊緣)模型以減輕對高稅費硬體的依賴
- 特定產業的服務影響
- 工業物聯網 (IIoT) 服務
- 消費者物聯網服務
- 服務交付成本膨脹
- 產業衝擊力
- 成長動力
- 連網設備的激增
- 人工智慧和分析技術的進步
- 5G網路擴充
- 轉向訂閱和基於結果的模式
- 產業陷阱與挑戰
- 資料隱私法規限制了貨幣化潛力
- 互通性問題阻礙了服務的可擴展性
- 成長動力
- 成長潛力分析
- 監管格局
- 技術格局
- 未來市場趨勢
- 差距分析
- 波特的分析
- PESTEL分析
第4章:競爭格局
- 介紹
- 公司市佔率分析
- 主要市場參與者的競爭分析
- 競爭定位矩陣
- 策略儀表板
第5章:市場估計與預測:依商業模式,2021-2034 年
- 主要趨勢
- 基於訂閱
- 按使用付費
- 基於結果
- 廣告和贊助
- 數據貨幣化
- 許可和特許經營
第6章:市場估計與預測:依部署類型,2021-2034
- 主要趨勢
- 基於雲端
- 本地
- 混合
第7章:市場估計與預測:按應用,2021-2034
- 主要趨勢
- 智慧家庭和消費物聯網
- 工業物聯網
- 智慧城市
- 醫療保健物聯網
- 農業物聯網
- 零售技術
- 連網汽車和遠端資訊處理
- 能源與公用事業管理
第8章:市場估計與預測:按地區,2021 年至 2034 年
- 主要趨勢
- 北美洲
- 美國
- 加拿大
- 歐洲
- 德國
- 英國
- 法國
- 西班牙
- 義大利
- 荷蘭
- 亞太地區
- 中國
- 印度
- 日本
- 澳洲
- 韓國
- 拉丁美洲
- 巴西
- 墨西哥
- 阿根廷
- 中東和非洲
- 沙烏地阿拉伯
- 南非
- 阿拉伯聯合大公國
第9章:公司簡介
- Microsoft
- Amazon Web Services, Inc.
- Google LLC
- IBM
- Siemens
- Cisco Systems, Inc.
- PTC
- Oracle Corporation
- SAP SE
- Telefonaktiebolaget LM Ericsson
- Verizon
- AT&T
- Bosch Global Software Technologies GmbH
- General Electric Company
- Huawei Technologies Co., Ltd.
- Qualcomm Technologies, Inc.
- Intel Corporation
- Salesforce, Inc.
- Semtech
The Global IoT Monetization Market was valued at USD 1.01 trillion in 2024 and is estimated to grow at a CAGR of 46.4% to reach USD 45.46 trillion by 2034. As IoT devices continue to embed themselves deeply into daily life-from smart homes and wearables to industrial automation and connected vehicles-the scope for monetizing data and connectivity is growing at an exponential pace. The rise of digital ecosystems across residential, urban, and enterprise domains is transforming how organizations think about revenue generation. No longer limited to one-time hardware sales, the focus has rapidly shifted to recurring income streams, value-added services, and outcome-based pricing models.
Businesses are harnessing IoT-generated data to fuel smarter decision-making, tailored user experiences, and develop dynamic pricing structures that respond to real-time usage. As artificial intelligence and edge computing gain traction, companies are moving beyond reactive service models toward predictive and prescriptive monetization strategies. Enterprises are investing in robust cloud infrastructure, AI-driven analytics, and low-code platforms to create scalable IoT applications. Meanwhile, the emergence of digital marketplaces that facilitate service bundling and cross-platform integration is unlocking new revenue channels and deepening customer engagement.
| Market Scope | |
|---|---|
| Start Year | 2024 |
| Forecast Year | 2025-2034 |
| Start Value | $1.01 Trillion |
| Forecast Value | $45.46 Trillion |
| CAGR | 46.4% |
But while the IoT monetization landscape is thriving with innovation, it's also navigating complex international trade dynamics. Tariffs on essential components such as semiconductors and sensors during earlier U.S. trade policy phases disrupted global supply chains. These disruptions pushed up production costs for IoT hardware, putting companies in a tight spot-either pass those costs to customers or absorb losses. Both options impacted profitability and slowed the rate of adoption, especially among small and mid-sized vendors. In response, some major players opted to localize production to sidestep import duties. While this shift helps reduce exposure to future trade volatility, it comes with short-term hurdles like increased RandD spending and longer timelines for return on investment. To remain competitive, a growing number of firms are leaning into asset-light business models. These models focus more on software, platforms, and services, allowing companies to monetize IoT ecosystems without depending heavily on physical hardware.
The subscription-based model took the lead in 2024 with a market valuation of USD 363.3 billion. By offering customizable, tiered service plans packed with features like real-time diagnostics, remote monitoring, and predictive maintenance, companies are turning one-time device sales into long-term revenue generators. This model gives businesses the ability to scale according to usage, allowing for flexible pricing while also boosting customer loyalty. Predictive analytics plays a key role in optimizing these pricing models, helping companies align charges with actual performance and consumption trends. The ability to deliver proactive support and consistent value strengthens brand loyalty and drives recurring revenue, making this model one of the most preferred across verticals.
The cloud-based segment generated USD 564.9 billion in 2024, dominating the IoT monetization market thanks to its agility and cost-efficiency. Cloud infrastructure enables businesses to roll out connected services globally without investing in expensive on-premises infrastructure. It facilitates real-time data collection, remote asset control, and automatic software updates-all essential for modern IoT applications. Enterprises adopting AI-powered solutions are using cloud platforms to implement smart billing systems, enable usage-based pricing, and customize services for individual users. These capabilities enhance customer satisfaction while reducing overhead, giving companies the ability to pivot quickly and scale without disruption.
The United States led the IoT monetization market with a value of USD 301.8 billion in 2024. The country benefits from widespread 5G connectivity, mature cloud infrastructure, and supportive policy frameworks. Laws like the California Consumer Privacy Act (CCPA) are setting clear standards for data usage while opening doors for monetizing anonymized and aggregated data streams. Industries such as automotive and healthcare are driving momentum. In the automotive space, connected vehicles are creating revenue through features like navigation services, maintenance alerts, and media subscriptions. In healthcare, remote monitoring devices support outcome-based models where providers are paid based on patient health improvements, not just services rendered.
To gain a stronger foothold in this high-growth market, companies are doubling down on cloud expansion, enhancing low-code development tools for faster integration, and establishing cross-industry partnerships that enable bundled service offerings. Firms are also focusing on secure, anonymized data exchanges and building vertical-specific solutions to better serve key sectors. Market leaders like Microsoft, IBM, Amazon Web Services, Siemens, and Google are spearheading these efforts by offering comprehensive platforms that combine AI, cloud, and IoT capabilities to create measurable value across industries.
Table of Contents
Chapter 1 Methodology and Scope
- 1.1 Market scope and definitions
- 1.2 Research design
- 1.2.1 Research approach
- 1.2.2 Data collection methods
- 1.3 Base estimates and calculations
- 1.3.1 Base year calculation
- 1.3.2 Key trends for market estimation
- 1.4 Forecast model
- 1.5 Primary research and validation
- 1.5.1 Primary sources
- 1.5.2 Data mining sources
Chapter 2 Executive Summary
- 2.1 Industry 360° synopsis
Chapter 3 Industry Insights
- 3.1 Industry ecosystem analysis
- 3.2 Impact of trump tariffs on Internet of Things (IoT) monetization market
- 3.2.1 Cost inflation in service delivery
- 3.2.1.1 Tariff-driven hardware cost increases
- 3.2.1.2 Case study - AWS IoT core’s adjusted pricing for hardware-dependent services
- 3.2.2 Supply chain-driven service disruptions
- 3.2.2.1 Delays in device deployments impacting subscription rollouts
- 3.2.2.2 Shift to hybrid (cloud/edge) models to mitigate dependency on taxed hardware
- 3.2.3 Sector-specific service impacts
- 3.2.3.1 Industrial IoT (IIoT) services
- 3.2.3.2 Consumer IoT services
- 3.2.1 Cost inflation in service delivery
- 3.3 Industry impact forces
- 3.3.1 Growth drivers
- 3.3.1.1 Proliferation of connected devices
- 3.3.1.2 Advancements in AI and analytics
- 3.3.1.3 5G network expansion
- 3.3.1.4 Shift to subscription and outcome-based models
- 3.3.2 Industry pitfalls and challenges
- 3.3.2.1 Data privacy regulations limit monetization potential
- 3.3.2.2 Interoperability issues hinder service scalability
- 3.3.1 Growth drivers
- 3.4 Growth potential analysis
- 3.5 Regulatory landscape
- 3.6 Technology landscape
- 3.7 Future market trends
- 3.8 Gap analysis
- 3.9 Porter's analysis
- 3.10 PESTEL analysis
Chapter 4 Competitive Landscape, 2024
- 4.1 Introduction
- 4.2 Company market share analysis
- 4.3 Competitive analysis of major market players
- 4.4 Competitive positioning matrix
- 4.5 Strategy dashboard
Chapter 5 Market Estimates & Forecast, By Business Model, 2021-2034 (USD Million)
- 5.1 Key trends
- 5.2 Subscription-based
- 5.3 Pay-per-use
- 5.4 Outcome-based
- 5.5 Advertising & sponsorship
- 5.6 Data monetization
- 5.7 Licensing & franchising
Chapter 6 Market Estimates & Forecast, By Deployment Type, 2021-2034 (USD Million)
- 6.1 Key trends
- 6.2 Cloud-based
- 6.3 On-premises
- 6.4 Hybrid
Chapter 7 Market Estimates & Forecast, By Application, 2021-2034 (USD Million)
- 7.1 Key trends
- 7.2 Smart home & consumer IoT
- 7.3 Industrial IoT
- 7.4 Smart cities
- 7.5 Healthcare IoT
- 7.6 Agriculture IoT
- 7.7 Retail technology
- 7.8 Connected vehicles & telematics
- 7.9 Energy & utility management
Chapter 8 Market Estimates and Forecast, By Region, 2021 – 2034 (USD Million)
- 8.1 Key trends
- 8.2 North America
- 8.2.1 U.S.
- 8.2.2 Canada
- 8.3 Europe
- 8.3.1 Germany
- 8.3.2 UK
- 8.3.3 France
- 8.3.4 Spain
- 8.3.5 Italy
- 8.3.6 Netherlands
- 8.4 Asia Pacific
- 8.4.1 China
- 8.4.2 India
- 8.4.3 Japan
- 8.4.4 Australia
- 8.4.5 South Korea
- 8.5 Latin America
- 8.5.1 Brazil
- 8.5.2 Mexico
- 8.5.3 Argentina
- 8.6 Middle East and Africa
- 8.6.1 Saudi Arabia
- 8.6.2 South Africa
- 8.6.3 UAE
Chapter 9 Company Profiles
- 9.1 Microsoft
- 9.2 Amazon Web Services, Inc.
- 9.3 Google LLC
- 9.4 IBM
- 9.5 Siemens
- 9.6 Cisco Systems, Inc.
- 9.7 PTC
- 9.8 Oracle Corporation
- 9.9 SAP SE
- 9.10 Telefonaktiebolaget LM Ericsson
- 9.11 Verizon
- 9.12 AT&T
- 9.13 Bosch Global Software Technologies GmbH
- 9.14 General Electric Company
- 9.15 Huawei Technologies Co., Ltd.
- 9.16 Qualcomm Technologies, Inc.
- 9.17 Intel Corporation
- 9.18 Salesforce, Inc.
- 9.19 Semtech


