


 |
市場調查報告書
商品編碼
1740893
結構銅線市場機會、成長動力、產業趨勢分析及 2025 - 2034 年預測Structural Copper Wire Market Opportunity, Growth Drivers, Industry Trend Analysis, and Forecast 2025 - 2034 |
||||||
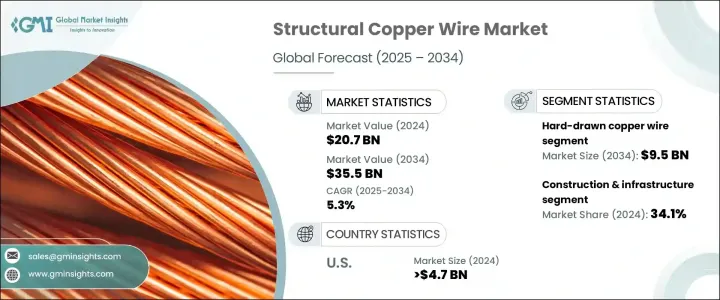
2024 年全球結構銅線市場價值為 207 億美元,預計到 2034 年將以 5.3% 的複合年成長率成長,達到 355 億美元,這得益於各關鍵行業對機械強度高、耐腐蝕的佈線解決方案的需求不斷成長。與標準銅線不同,結構銅線經過精心設計,可承受物理應力、天氣條件和長期暴露,適合在高要求環境中使用。隨著全球智慧基礎設施的擴張和工業的快速發展,這些電線在提供導電性和耐用性方面發揮著至關重要的作用。專注於大規模基礎設施、能源系統現代化以及城市電氣化的行業的需求正在激增。隨著各國注重升級其基礎設施網路,堅固可靠的銅線解決方案變得至關重要。
此外,向永續能源系統的轉變為結構性銅線開闢了新的途徑,尤其是在太陽能場、風電場和儲能系統等再生能源項目中。銅的優異導電性和耐用性使其成為這些應用中嚴苛環境的理想材料,因為長期可靠性至關重要。在太陽能系統中,銅線將太陽能板連接到電網,確保高效的電力傳輸,同時抵禦室外惡劣天氣。
| 市場範圍 | |
|---|---|
| 起始年份 | 2024 |
| 預測年份 | 2025-2034 |
| 起始值 | 207億美元 |
| 預測值 | 355億美元 |
| 複合年成長率 | 5.3% |
在各類產品中,硬拉銅線在2024年創造了最高的收入,達到56億美元,預計到2034年將達到95億美元。這些電線因其機械韌性而被廣泛選用,並且與較軟的替代品相比,它們更耐拉力。其結構使其成為涉及物理應變的應用的理想選擇,例如接地、配電和對強度和耐用性有嚴格要求的佈線安裝。硬舉銅線在壓力下仍能保持完整性,為建築和基礎設施建設提供可靠的解決方案。
建築和基礎設施產業佔據34.1%的市場佔有率,引領市場。銅以其無與倫比的導電性和比強度尺寸效率,成為建築專案的首選材料。由於銅可以在不犧牲性能的情況下實現更小直徑的導體,因此在安裝和空間最佳化方面具有優勢。在佈線系統中,與其他材料相比,單一導管可以容納更多銅線,有助於簡化施工設計。
2024年,美國結構性銅線市場規模達47億美元,預計2025年至2034年期間的複合年成長率將達到5.5%,這得益於商業和機構項目中高性能電力系統擴大採用銅線。現有電網的持續升級以及日益嚴格的能源效率法規進一步推動了對銅線的需求,因為銅線既能滿足法規要求,又能帶來節能效益。
全球結構銅線市場的主要參與者包括通用電纜技術公司、住友電工、普睿司曼集團、耐吉森和艾倫電線公司。該市場的領導者正在採取前瞻性策略,包括投資下一代製造技術以提高產品的耐用性和一致性,以及建立策略聯盟以進入尚未開發的地區。企業也透過將銅與先進合金結合來創新產品配方,以提高其在惡劣環境下的性能。許多製造商強調永續性,正在轉向可回收材料和節能工藝,以符合環境法規並滿足客戶對更環保解決方案的期望。
目錄
第1章:方法論與範圍
第2章:執行摘要
第3章:行業洞察
- 產業生態系統分析
- 影響價值鏈的因素
- 利潤率分析
- 中斷
- 未來展望
- 製造商
- 經銷商
- 川普政府關稅
- 對貿易的影響
- 貿易量中斷
- 報復措施
- 對產業的影響
- 供給側影響(原料)
- 主要材料價格波動
- 供應鏈重組
- 生產成本影響
- 需求面影響(售價)
- 價格傳導至終端市場
- 市佔率動態
- 消費者反應模式
- 供給側影響(原料)
- 受影響的主要公司
- 策略產業反應
- 供應鏈重組
- 定價和產品策略
- 政策參與
- 展望與未來考慮
- 對貿易的影響
- 貿易統計(HS編碼)
- 2021-2024年主要出口國
- 2021-2024年主要進口國
註:以上貿易統計僅提供重點國家
- 供應商格局
- 利潤率分析
- 重要新聞和舉措
- 監管格局
- 衝擊力
- 成長動力
- 基礎設施現代化和擴建
- 再生能源項目增加
- 航太和國防投資不斷成長
- 產業陷阱與挑戰
- 材料和生產成本高
- 成長動力
- 成長潛力分析
- 波特的分析
- PESTEL分析
第4章:競爭格局
- 介紹
- 公司市佔率分析
- 競爭定位矩陣
- 戰略展望矩陣
第5章:市場規模及預測:依類型,2021 - 2034
- 主要趨勢
- 硬舉銅線
- 銅包鋼絲(CCS)
- 銅包鋁線(CCA)
- 鈹銅線
- 鈦包銅線
- 其他
第6章:市場規模及預測:依應用,2021 - 2034
- 主要趨勢
- 建築與基礎設施
- 輸配電
- 鐵路和交通運輸
- 航太與國防
- 船舶和海上設施
- 其他
第7章:市場規模及預測:按電壓,2021 - 2034
- 主要趨勢
- 低電壓
- 中壓
- 高壓
第8章:市場規模及預測:按地區,2021 - 2034
- 主要趨勢
- 北美洲
- 美國
- 加拿大
- 歐洲
- 英國
- 德國
- 法國
- 義大利
- 西班牙
- 荷蘭
- 亞太地區
- 中國
- 印度
- 日本
- 韓國
- 澳洲
- 拉丁美洲
- 巴西
- 墨西哥
- 阿根廷
- MEA
- 南非
- 沙烏地阿拉伯
- 阿拉伯聯合大公國
第9章:公司簡介
- Prysmian Group
- Alan Wire Company
- Nexans
- General Cable Technologies Corporation
- Sumitomo Electric Industries
- Aviva Metals
- Luvata
- NINGBO JINTIAN COPPER (GROUP)
- SH Copper Products
- Tatung
The Global Structural Copper Wire Market was valued at USD 20.7 billion in 2024 and is estimated to grow at a CAGR of 5.3% to reach USD 35.5 billion by 2034, driven by increasing demand for mechanically robust, corrosion-resistant wiring solutions across various critical sectors. Unlike standard electrical copper wire, structural copper wire is engineered to withstand physical stress, weather conditions, and long-term exposure, making it suitable for use in high-demand environments. With the expansion of smart infrastructure and rapid industrial development worldwide, these wires play a vital role in delivering both conductivity and durability. Demand is surging from sectors focused on large-scale infrastructure, modernization of energy systems, and the push toward electrification in urban landscapes. As countries focus on upgrading their infrastructure networks, strong and reliable copper wire solutions are becoming essential.
Additionally, the shift toward sustainable energy systems opens new avenues for structural copper wiring, particularly in renewable energy projects such as solar fields, wind farms, and energy storage systems. Copper's exceptional conductivity and durability make it ideal material for the demanding environments found in these applications, where long-term reliability is essential. In solar energy systems, copper wiring connects solar panels to the grid, ensuring efficient power transmission while withstanding the outdoor elements.
| Market Scope | |
|---|---|
| Start Year | 2024 |
| Forecast Year | 2025-2034 |
| Start Value | $20.7 Billion |
| Forecast Value | $35.5 Billion |
| CAGR | 5.3% |
Among the different product categories, hard-drawn copper wire generated the highest revenue in 2024, reaching USD 5.6 billion, and is anticipated to hit USD 9.5 billion by 2034. These wires are chosen for their mechanical toughness and are more resistant to tension compared to softer alternatives. Their structure makes them ideal for applications involving physical strain, such as in grounding, power distribution, and wiring installations that demand strength and durability. Hard-drawn wires maintain their integrity under stress, providing a dependable solution for construction and infrastructure.
The construction and infrastructure industry led the market by accounting for 34.1% share. Copper's unmatched electrical conductivity and its strength-to-size efficiency make it the material of choice for building projects. Because copper allows for smaller-diameter conductors without sacrificing performance, it provides advantages in installation and space optimization. In wiring systems, more copper wires can fit into a single conduit compared to alternative materials, contributing to streamlined construction design.
United States Structural Copper Wire Market was valued at USD 4.7 billion in 2024 and is projected to grow at a CAGR of 5.5% from 2025 to 2034, driven by the growing adoption of copper wiring for high-performance electrical systems across commercial and institutional projects. Ongoing upgrades to existing electrical networks and rising energy efficiency regulations further drive the demand for copper, offering both regulatory compliance and energy-saving benefits.
Key players in the Global Structural Copper Wire Market include General Cable Technologies Corporation, Sumitomo Electric Industries, Prysmian Group, Nexans, and Alan Wire Company. Leading companies in this market are adopting forward-thinking strategies. These include investing in next-generation manufacturing technologies to enhance product durability and consistency, and forming strategic alliances to enter untapped regions. Firms are also innovating product formulations by combining copper with advanced alloys to improve performance in harsh environments. Emphasizing sustainability, many manufacturers are shifting to recyclable materials and energy-efficient processes to align with environmental regulations and meet customer expectations for greener solutions.
Table of Contents
Chapter 1 Methodology & Scope
- 1.1 Market scope & definition
- 1.2 Base estimates & calculations
- 1.3 Forecast calculation
- 1.4 Data sources
- 1.4.1 Primary
- 1.4.2 Secondary
- 1.4.2.1 Paid sources
- 1.4.2.2 Public sources
Chapter 2 Executive Summary
- 2.1 Industry synopsis, 2021 - 2034
Chapter 3 Industry Insights
- 3.1 Industry ecosystem analysis
- 3.1.1 Factor affecting the value chain
- 3.1.2 Profit margin analysis
- 3.1.3 Disruptions
- 3.1.4 Future outlook
- 3.1.5 Manufacturers
- 3.1.6 Distributors
- 3.2 Trump administration tariffs
- 3.2.1 Impact on trade
- 3.2.1.1 Trade volume disruptions
- 3.2.1.2 Retaliatory measures
- 3.2.2 Impact on the industry
- 3.2.2.1 Supply-side impact (raw materials)
- 3.2.2.1.1 Price volatility in key materials
- 3.2.2.1.2 Supply chain restructuring
- 3.2.2.1.3 Production cost implications
- 3.2.2.2 Demand-side impact (selling price)
- 3.2.2.2.1 Price transmission to end markets
- 3.2.2.2.2 Market share dynamics
- 3.2.2.2.3 Consumer response patterns
- 3.2.2.1 Supply-side impact (raw materials)
- 3.2.3 Key companies impacted
- 3.2.4 Strategic industry responses
- 3.2.4.1 Supply chain reconfiguration
- 3.2.4.2 Pricing and product strategies
- 3.2.4.3 Policy engagement
- 3.2.5 Outlook and future considerations
- 3.2.1 Impact on trade
- 3.3 Trade statistics (hs code)
- 3.3.1 Major exporting countries, 2021-2024 (usd mn)
- 3.3.2 Major importing countries, 2021-2024 (usd mn)
Note: The above trade statistics will be provided for key countries only
- 3.4 Supplier landscape
- 3.5 Profit margin analysis
- 3.6 Key news & initiatives
- 3.7 Regulatory landscape
- 3.8 Impact forces
- 3.8.1 Growth drivers
- 3.8.1.1 Infrastructure modernization & expansion
- 3.8.1.2 Rise in renewable energy projects
- 3.8.1.3 Growing aerospace & defense investments
- 3.8.2 Industry pitfalls & challenges
- 3.8.2.1 High material & production costs
- 3.8.1 Growth drivers
- 3.9 Growth potential analysis
- 3.10 Porter's analysis
- 3.11 PESTEL analysis
Chapter 4 Competitive Landscape, 2024
- 4.1 Introduction
- 4.2 Company market share analysis
- 4.3 Competitive positioning matrix
- 4.4 Strategic outlook matrix
Chapter 5 Market Size and Forecast, By Type, 2021 - 2034 (USD Million) (Tons)
- 5.1 Key trends
- 5.2 Hard-drawn copper wire
- 5.3 Copper-clad steel wire (CCS)
- 5.4 Copper-clad aluminum wire (CCA)
- 5.5 Beryllium copper wire
- 5.6 Titanium-clad copper wire
- 5.7 Others
Chapter 6 Market Size and Forecast, By Application, 2021 - 2034 (USD Million) (Tons)
- 6.1 Key trends
- 6.2 Construction & infrastructure
- 6.3 Power transmission & distribution
- 6.4 Railways & transportation
- 6.5 Aerospace & defense
- 6.6 Marine & offshore installations
- 6.7 Others
Chapter 7 Market Size and Forecast, By Voltage, 2021 - 2034 (USD Million) (Tons)
- 7.1 Key trends
- 7.2 Low voltage
- 7.3 Medium voltage
- 7.4 High voltage
Chapter 8 Market Size and Forecast, By Region, 2021 - 2034 (USD Million) (Tons)
- 8.1 Key trends
- 8.2 North America
- 8.2.1 U.S.
- 8.2.2 Canada
- 8.3 Europe
- 8.3.1 UK
- 8.3.2 Germany
- 8.3.3 France
- 8.3.4 Italy
- 8.3.5 Spain
- 8.3.6 Netherlands
- 8.4 Asia Pacific
- 8.4.1 China
- 8.4.2 India
- 8.4.3 Japan
- 8.4.4 South Korea
- 8.4.5 Australia
- 8.5 Latin America
- 8.5.1 Brazil
- 8.5.2 Mexico
- 8.5.3 Argentina
- 8.6 MEA
- 8.6.1 South Africa
- 8.6.2 Saudi Arabia
- 8.6.3 UAE
Chapter 9 Company Profiles
- 9.1 Prysmian Group
- 9.2 Alan Wire Company
- 9.3 Nexans
- 9.4 General Cable Technologies Corporation
- 9.5 Sumitomo Electric Industries
- 9.6 Aviva Metals
- 9.7 Luvata
- 9.8 NINGBO JINTIAN COPPER (GROUP)
- 9.9 SH Copper Products
- 9.10 Tatung
 銅線市場規模、佔有率、趨勢和預測:按應用和地區分類,2026-2034年
 銅合金線材市場:2026-2032年全球市場預測(依材質、終端用途產業、產品形式、線徑及製造流程分類)聚醯亞胺搪瓷市場:2026-2032年全球市場預測(依產品類型、技術、應用、終端用戶產業及銷售管道)銅包裸線市場:依產品類型、導體類型、絕緣等級、應用及通路分類-2026-2032年全球預測
 銅線市場 - 全球產業規模、佔有率、趨勢、機會及預測(銷售管道、最終用途、地區及競爭格局分類,2021-2031年)搪瓷產品市場按樹脂類型、應用方法、產品類型、終端用戶產業和分銷管道分類,全球預測(2026-2032年)
 鈀塗層銅鍵合線-2025年至2031年全球市佔率及排名、總收入及需求預測
 美國銅線市場規模、佔有率、趨勢分析報告:按電壓、應用和細分市場預測,2025-2030 年全球銅線市場:市場規模、市場佔有率、趨勢分析(按電壓、應用和地區)、細分市場預測(2025-2030 年)
 2025-2029年全球銅合金線市場