


 |
市場調查報告書
商品編碼
1740752
碳負包裝市場機會、成長動力、產業趨勢分析及 2025 - 2034 年預測Carbon-negative Packaging Market Opportunity, Growth Drivers, Industry Trend Analysis, and Forecast 2025 - 2034 |
||||||
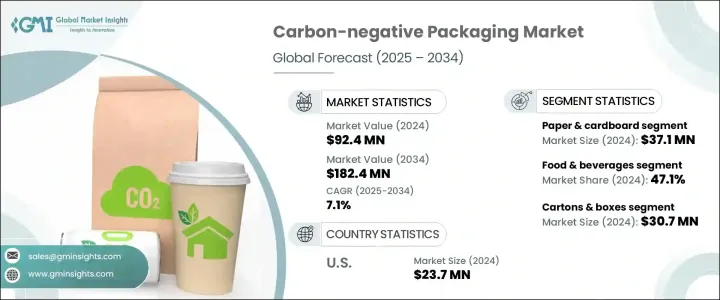
2024年,全球碳負包裝市場規模達9,240萬美元,預計到2034年將以7.1%的複合年成長率成長,達到1.824億美元。這得益於塑膠廢棄物和碳排放監管壓力的不斷加大,以及生物基聚合物、可生物分解複合材料和碳捕獲利用(CCU)領域的創新。隨著全球對永續發展的關注度不斷提升,各行各業的企業都在重新規劃其包裝策略,以最大程度地減少對環境的影響。包裝仍是企業碳足跡的主要貢獻者,隨著對更環保替代品的需求不斷成長,各企業正迅速採用碳負解決方案。
這種轉變的動力源自於監管要求、投資者預期以及消費者日益青睞環保品牌的偏好。企業不僅將永續包裝視為合規要求,更將其視為提升品牌忠誠度和開拓新市場機會的競爭優勢。隨著越來越多的企業致力於ESG(環境、社會和治理)目標,碳負包裝產業正迎來大量投資,用於材料、設計和供應鏈最佳化的創新。各大品牌意識到,積極主動邁向碳中和及更高目標,能夠在環境管理日益成為成功關鍵的市場中佔據有利地位。
| 市場範圍 | |
|---|---|
| 起始年份 | 2024 |
| 預測年份 | 2025-2034 |
| 起始值 | 9240萬美元 |
| 預測值 | 1.824億美元 |
| 複合年成長率 | 7.1% |
隨著永續發展成為企業關注的焦點,包裝產業正經歷一場變革。包裝作為企業碳足跡的關鍵貢獻者,如今正受到嚴格審查,許多企業正在重新評估其減少環境影響的策略。消費者、投資者和監管機構日益成長的壓力,促使企業採取更負責任的做法,這促使企業擴大轉向環保包裝替代品。這樣做不僅提升了品牌聲譽,也體現了對環境責任的承諾。對永續發展的日益關注,導致旨在開發和實施綠色包裝解決方案的投資激增。企業正在轉向可生物分解聚合物、可回收塑膠和紙板等更符合循環經濟原則的材料。
市場根據材料類型進行分類,主要細分領域包括可生物分解聚合物、紙張和紙板、生物基塑膠、有機纖維等。紙張和紙板是主要材料,由於其可回收性、易得性以及對無塑膠包裝日益成長的需求,2024 年其價值將達到 3,710 萬美元。許多企業,尤其是電商、外帶和個人護理行業,選擇經 FSC 認證的再生紙包裝,以實現永續發展目標,並滿足消費者對環保包裝的需求。
包裝類型包括瓶罐、托盤和容器、紙盒、袋子和小袋、包裝紙和薄膜等。 2024年,紙盒和紙箱細分市場產值達3,070萬美元。這些包裝材料因其強度高、品牌潛力大、可回收性強以及碳封存能力而廣受歡迎。紙盒和紙箱在電子商務、零售和餐飲服務業尤其受歡迎,因為永續性是這些產業品牌差異化的關鍵因素。紙盒和紙箱的碳負性特性使其成為希望提升永續發展資質,同時提供高品質環保包裝選擇的企業的理想選擇。
2024年,美國負碳包裝市場規模達2,370萬美元,這得益於消費者對環保包裝的需求以及企業對ESG目標的堅定承諾。隨著環保政策的推進,包括州級塑膠禁令和對供應鏈排放的嚴格審查,越來越多的品牌開始採用永續包裝。這刺激了老牌包裝公司和新興科技新創公司在碳封存材料和生物塑膠方面的創新。
全球碳負包裝產業的主要參與者包括利樂國際公司 (Tetra Pak International SA)、Huhtamaki、Elopak 和 Footprint。這些公司專注於開發尖端解決方案,以滿足監管壓力和消費者偏好推動的對永續包裝日益成長的需求。為了鞏固市場地位,公司強調創新與合作。許多公司在研發方面投入大量資金,以創造新的生物基材料,並探索減少碳排放的創新包裝設計。
與科技新創公司建立策略夥伴關係,並持續致力於提升包裝效率和永續性,使這些公司在競爭中保持領先地位。此外,一些公司正在擴展其產品組合,提供客製化解決方案,以滿足食品飲料、電商或化妝品等特定行業的需求。透過將業務策略與全球永續發展目標相結合,這些公司正在提升市場知名度和聲譽,吸引更廣泛的客戶群,並增加其在快速成長的負碳包裝領域的佔有率。
目錄
第1章:方法論與範圍
第2章:執行摘要
第3章:行業洞察
- 產業生態系統分析
- 影響價值鏈的因素
- 利潤率分析
- 中斷
- 未來展望
- 製造商
- 經銷商
- 川普政府關稅
- 對貿易的影響
- 貿易量中斷
- 報復措施
- 對產業的影響
- 供應方影響(原料)
- 主要材料價格波動
- 供應鏈重組
- 生產成本影響
- 需求面影響(售價)
- 價格傳導至終端市場
- 市佔率動態
- 消費者反應模式
- 供應方影響(原料)
- 受影響的主要公司
- 策略產業反應
- 供應鏈重組
- 定價和產品策略
- 政策參與
- 展望與未來考慮
- 對貿易的影響
- 供應商格局
- 利潤率分析
- 重要新聞和舉措
- 監管格局
- 衝擊力
- 成長動力
- 碳排放和塑膠廢物的監管壓力
- 企業 ESG 承諾與淨零目標
- 生物基聚合物、碳捕獲利用 (CCU) 和可生物分解複合材料的創新
- 循環經濟和零浪費計劃
- 環保包裝需求不斷成長
- 產業陷阱與挑戰
- 生產成本高,規模經濟有限
- 性能和功能限制
- 成長動力
- 成長潛力分析
- 波特的分析
- PESTEL分析
第4章:競爭格局
- 介紹
- 公司市佔率分析
- 競爭定位矩陣
- 戰略展望矩陣
第5章:市場估計與預測:依資料,2021 - 2034 年
- 主要趨勢
- 可生物分解聚合物
- 紙和紙板
- 生物基塑膠
- 有機纖維
- 其他
第6章:市場估計與預測:依包裝類型,2021 - 2034 年
- 主要趨勢
- 瓶子和罐子
- 托盤和容器
- 紙箱和盒子
- 包包和小袋
- 包裝紙和薄膜
- 其他
第7章:市場估計與預測:按最終用途產業,2021 - 2034 年
- 主要趨勢
- 食品和飲料
- 個人護理和化妝品
- 醫療保健和製藥
- 電子產品
- 其他
第8章:市場估計與預測:按地區,2021 - 2034 年
- 主要趨勢
- 北美洲
- 美國
- 加拿大
- 歐洲
- 英國
- 德國
- 法國
- 義大利
- 西班牙
- 俄羅斯
- 亞太地區
- 中國
- 印度
- 日本
- 韓國
- 澳洲
- 拉丁美洲
- 巴西
- 墨西哥
- MEA
- 南非
- 沙烏地阿拉伯
- 阿拉伯聯合大公國
第9章:公司簡介
- 360 Containers
- Bunzl UK Ltd
- Elopak
- Emmerson Packaging
- Footprint
- Genpak
- Georg Utz Holding AG
- Get Bamboo
- Green Side of Pink
- Huhtamaki
- Pregis
- Tetra Pak International SA
The Global Carbon-Negative Packaging Market was valued at USD 92.4 million in 2024 and is estimated to grow at a CAGR of 7.1% to reach USD 182.4 million by 2034, driven by increasing regulatory pressure on plastic waste and carbon emissions, along with innovations in bio-based polymers, biodegradable composites, and carbon capture utilization (CCU). As the global focus on sustainability intensifies, businesses across industries are reimagining their packaging strategies to minimize environmental impact. Packaging remains a major contributor to a company's carbon footprint, and with rising demand for greener alternatives, organizations are rapidly adopting carbon-negative solutions.
This shift is fueled by regulatory mandates, investor expectations, and evolving consumer preferences that favor eco-conscious brands. Companies are seeing sustainable packaging not just as a compliance requirement but as a competitive advantage that can boost brand loyalty and unlock new market opportunities. As more companies commit to ESG (Environmental, Social, and Governance) goals, the carbon-negative packaging industry is witnessing significant investment inflows for innovation in materials, design, and supply chain optimization. Brands are realizing that taking proactive steps towards carbon neutrality and beyond can strongly position them in a marketplace where environmental stewardship increasingly defines success.
| Market Scope | |
|---|---|
| Start Year | 2024 |
| Forecast Year | 2025-2034 |
| Start Value | $92.4 Million |
| Forecast Value | $182.4 Million |
| CAGR | 7.1% |
As sustainability becomes a central focus for businesses, the packaging industry is undergoing a transformation. Packaging, being a key contributor to a company's carbon footprint, is now under scrutiny, with many businesses reevaluating their strategies to reduce environmental impact. The growing pressure from consumers, investors, and regulatory bodies to adopt more responsible practices has driven companies to increasingly switch to eco-friendly packaging alternatives. By doing so, they not only enhance their brand reputation but also show a commitment to environmental responsibility. This growing focus on sustainability has led to a surge in investments aimed at developing and implementing green packaging solutions. Businesses are turning to materials such as biodegradable polymers, recyclable plastics, and paperboard, which are more aligned with circular economy principles.
The market is categorized based on material types, with key segments including biodegradable polymers, paper and cardboard, bio-based plastics, organic fibers, and others. Paper and cardboard are the leading materials, valued at USD 37.1 million in 2024, due to their recyclability, availability, and the growing demand for plastic-free packaging. Many businesses, especially e-commerce, food delivery, and personal care industries, opt for FSC-certified and recycled paper-based packaging to meet sustainability targets and satisfy consumer demand for eco-friendly packaging options.
Packaging types include bottles and jars, trays and containers, cartons and boxes, bags and pouches, wrappers and films, and others. In 2024, the cartons and boxes segment generated USD 30.7 million. These packaging materials are popular for their strength, branding potential, and recyclability, as well as their ability to sequester carbon. Cartons and boxes are particularly favored in e-commerce, retail, and food service sectors, where sustainability is a key brand differentiator. Their carbon-negative characteristics make them ideal for companies looking to improve their sustainability credentials while offering a high-quality, eco-friendly packaging option.
The U.S. Carbon-Negative Packaging Market was valued at USD 23.7 million in 2024, driven by consumer demand for environmentally conscious packaging and strong corporate commitments to ESG goals. With eco-friendly policies gaining traction, including state-level plastic bans and heightened scrutiny of supply chain emissions, brands are increasingly adopting sustainable packaging. This has spurred innovation in carbon-sequestering materials and bioplastics from established packaging companies and emerging tech startups.
Key players in the Global Carbon-Negative Packaging Industry include Tetra Pak International S.A., Huhtamaki, Elopak, and Footprint. These companies are focused on developing cutting-edge solutions that meet the growing demand for sustainable packaging driven by regulatory pressures and consumer preferences. To solidify their position in the market, companies emphasize innovation and collaboration. Many invest heavily in research and development to create new bio-based materials and explore innovative packaging designs that reduce carbon emissions.
Strategic partnerships with technology startups, as well as ongoing efforts to improve packaging efficiency and sustainability, allow these companies to stay ahead of the competition. Additionally, some are expanding their product portfolios to include customizable solutions tailored to meet specific industry requirements, such as food and beverage, e-commerce, or cosmetics. By aligning their business strategies with global sustainability goals, these companies are enhancing their market visibility and reputation, attracting a broader customer base, and increasing their share of the rapidly growing carbon-negative packaging sector.
Table of Contents
Chapter 1 Methodology & Scope
- 1.1 Market scope & definitions
- 1.2 Base estimates & calculations
- 1.3 Forecast calculations
- 1.4 Data sources
- 1.4.1 Primary
- 1.4.2 Secondary
- 1.4.2.1 Paid sources
- 1.4.2.2 Public sources
Chapter 2 Executive Summary
- 2.1 Industry synopsis, 2021 - 2034
Chapter 3 Industry Insights
- 3.1 Industry ecosystem analysis
- 3.1.1 Factor affecting the value chain
- 3.1.2 Profit margin analysis
- 3.1.3 Disruptions
- 3.1.4 Future outlook
- 3.1.5 Manufacturers
- 3.1.6 Distributors
- 3.2 Trump administration tariffs
- 3.2.1 Impact on trade
- 3.2.1.1 Trade volume disruptions
- 3.2.1.2 Retaliatory measures
- 3.2.2 Impact on the industry
- 3.2.2.1 Supply-side impact (raw materials)
- 3.2.2.1.1 Price volatility in key materials
- 3.2.2.1.2 Supply chain restructuring
- 3.2.2.1.3 Production cost implications
- 3.2.2.2 Demand-side impact (selling price)
- 3.2.2.2.1 Price transmission to end markets
- 3.2.2.2.2 Market share dynamics
- 3.2.2.2.3 Consumer response patterns
- 3.2.2.1 Supply-side impact (raw materials)
- 3.2.3 Key companies impacted
- 3.2.4 Strategic industry responses
- 3.2.4.1 Supply chain reconfiguration
- 3.2.4.2 Pricing and product strategies
- 3.2.4.3 Policy engagement
- 3.2.5 Outlook and future considerations
- 3.2.1 Impact on trade
- 3.3 Supplier landscape
- 3.4 Profit margin analysis
- 3.5 Key news & initiatives
- 3.6 Regulatory landscape
- 3.7 Impact forces
- 3.7.1 Growth drivers
- 3.7.1.1 Regulatory pressure on carbon emissions and plastic waste
- 3.7.1.2 Corporate ESG commitments and net-zero goals
- 3.7.1.3 Innovations in bio-based polymers, carbon capture utilization (CCU), and biodegradable composites
- 3.7.1.4 Circular economy and zero-waste initiatives
- 3.7.1.5 Growing demand for eco-friendly packaging
- 3.7.2 Industry pitfalls & challenges
- 3.7.2.1 High production costs and limited economies of scale
- 3.7.2.2 Performance and functional limitations
- 3.7.1 Growth drivers
- 3.8 Growth potential analysis
- 3.9 Porter's analysis
- 3.10 PESTEL analysis
Chapter 4 Competitive Landscape, 2024
- 4.1 Introduction
- 4.2 Company market share analysis
- 4.3 Competitive positioning matrix
- 4.4 Strategic outlook matrix
Chapter 5 Market Estimates & Forecast, By Material, 2021 - 2034 (USD Million & Kilo Tons)
- 5.1 Key trends
- 5.2 Biodegradable polymers
- 5.3 Paper & cardboard
- 5.4 Bio-based plastics
- 5.5 Organic fibers
- 5.6 Others
Chapter 6 Market Estimates & Forecast, By Packaging Type, 2021 - 2034 (USD Million & Kilo Tons)
- 6.1 Key trends
- 6.2 Bottles & jars
- 6.3 Trays & containers
- 6.4 Cartons & boxes
- 6.5 Bags & pouches
- 6.6 Wrappers & films
- 6.7 Others
Chapter 7 Market Estimates & Forecast, By End Use Industry, 2021 - 2034 (USD Million & Kilo Tons)
- 7.1 Key trends
- 7.2 Food & beverage
- 7.3 Personal care & cosmetics
- 7.4 Healthcare & pharmaceuticals
- 7.5 Electronics
- 7.6 Others
Chapter 8 Market Estimates & Forecast, By Region, 2021 - 2034 (USD Million & Kilo Tons)
- 8.1 Key trends
- 8.2 North America
- 8.2.1 U.S.
- 8.2.2 Canada
- 8.3 Europe
- 8.3.1 UK
- 8.3.2 Germany
- 8.3.3 France
- 8.3.4 Italy
- 8.3.5 Spain
- 8.3.6 Russia
- 8.4 Asia Pacific
- 8.4.1 China
- 8.4.2 India
- 8.4.3 Japan
- 8.4.4 South Korea
- 8.4.5 Australia
- 8.5 Latin America
- 8.5.1 Brazil
- 8.5.2 Mexico
- 8.6 MEA
- 8.6.1 South Africa
- 8.6.2 Saudi Arabia
- 8.6.3 UAE
Chapter 9 Company Profiles
- 9.1 360 Containers
- 9.2 Bunzl UK Ltd
- 9.3 Elopak
- 9.4 Emmerson Packaging
- 9.5 Footprint
- 9.6 Genpak
- 9.7 Georg Utz Holding AG
- 9.8 Get Bamboo
- 9.9 Green Side of Pink
- 9.10 Huhtamaki
- 9.11 Pregis
- 9.12 Tetra Pak International S.A.
 2032 年再生包裝市場預測:按材料、包裝類型、應用和地區進行的全球分析可堆肥包裝市場按材料、產品、應用和地區分類
 2025年全球環保化妝品包裝市場報告
 可堆肥包裝薄膜市場機會、成長動力、產業趨勢分析及 2025 - 2034 年預測碳負塑膠市場規模、佔有率、趨勢分析報告:按產品類型、最終用途、細分市場預測,2025-2030 年2025年全球單一材料包裝市場報告2032 年植物栽培包裝市場預測:按類型、材料、包裝類型、包裝尺寸、消費者人口統計、最終用戶和地區進行的全球分析
 日本綠色包裝市場規模、佔有率、趨勢及預測(按包裝類型、最終用途行業和地區),2025 年至 2033 年可堆肥包裝設備市場機會、成長動力、產業趨勢分析及 2025 - 2034 年預測全球包裝用再生聚丙烯市場:市場規模、佔有率、趨勢分析(按包裝類型、最終用途和地區)、細分市場預測(2025-2030 年)