


 |
市場調查報告書
商品編碼
1721416
再生 PET 瓶市場機會、成長動力、產業趨勢分析及 2025 - 2034 年預測Recycled PET Bottles Market Opportunity, Growth Drivers, Industry Trend Analysis, and Forecast 2025 - 2034 |
||||||
2024 年全球再生 PET 瓶市場價值為 24 億美元,預計到 2034 年將以 9.7% 的複合年成長率成長至 59 億美元。隨著永續性成為各行各業的核心關注點,對環保和可回收包裝材料的需求正在加速成長。再生 PET (rPET) 瓶的勢頭強勁,尤其是當企業轉向閉迴路系統以減少對原生塑膠的依賴時。人們對環境問題的認知不斷提高、對塑膠廢物的擔憂日益加劇以及全球法規的嚴格,正在促使製造商採用更環保的包裝替代品。消費者也積極尋找採用永續包裝的產品,這使得品牌在致力於回收時具有競爭優勢。食品飲料、個人護理和家居用品等行業正在成為這一轉變的主要貢獻者,因為它們響應不斷變化的市場動態和環保意識的消費者行為。回收製程技術的進步進一步提高了 rPET 材料的品質和安全性,為包裝領域的應用和可擴展性開闢了新的途徑。
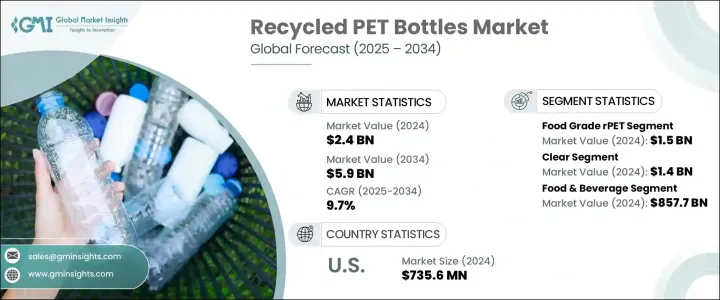
回收的PET瓶分為食品級和非食品級兩類。食品級細分市場在 2024 年以 15 億美元的價值引領市場。隨著食品和飲料公司致力於減少碳足跡,這個細分市場將繼續成長。符合安全標準的高品質食品級 rPET 的出現使得主要參與者更容易將永續包裝納入其產品線。另一方面,非食品級 rPET 也在擴大其應用範圍,尤其是在個人護理行業,品牌正在轉向可回收包裝,同時又不影響視覺吸引力或功能性。
| 市場範圍 | |
|---|---|
| 起始年份 | 2024 |
| 預測年份 | 2025-2034 |
| 起始值 | 24億美元 |
| 預測值 | 59億美元 |
| 複合年成長率 | 9.7% |
以瓶子類型分類,透明再生 PET 瓶佔據最大的市場佔有率,到 2024 年將達到 14 億美元。這些瓶子與原生 PET 非常相似,由於其透明度高且易於回收,非常適合用於水、碳酸飲料和果汁的包裝。製造商更喜歡透明 rPET,因為它適合閉迴路回收系統並且具有消費者友好的美感。乳製品、洗髮精和即食食品消費量的不斷成長也促進了對透明 rPET 瓶的需求不斷成長,透明 rPET 瓶既提高了產品可見性,又具有環境價值。
2024 年,美國再生 PET 瓶市場規模達 7.356 億美元。這一區域成長得益於旨在最大限度減少塑膠垃圾的強力監管措施,以及領先公司日益轉向循環包裝策略。
Alpek SAB de CV、Amcor 和 Resilux NV 等行業領導者正在擴大生產能力、增強回收技術並與環保機構合作以實現永續發展目標,同時加強其全球市場影響力。
目錄
第1章:方法論與範圍
第2章:執行摘要
第3章:行業洞察
- 產業生態系統分析
- 產業衝擊力
- 成長動力
- 監理要求和永續發展目標
- 消費者對環保包裝的偏好日益成長
- 個人護理和化妝品行業的擴張
- 不斷成長的飲料和食品包裝行業
- 回收技術的進步
- 產業陷阱與挑戰
- 回收基礎建設效率低下
- rPET 供應有限且成本高昂
- 成長動力
- 成長潛力分析
- 監管格局
- 技術格局
- 未來市場趨勢
- 差距分析
- 波特的分析
- PESTEL分析
第4章:競爭格局
- 介紹
- 公司市佔率分析
- 主要市場參與者的競爭分析
- 競爭定位矩陣
- 策略儀表板
第5章:市場估計與預測:依等級,2021 - 2034 年
- 主要趨勢
- 食品級 rPET
- 非食品級 rPET
第6章:市場估計與預測:按類型,2021 - 2034 年
- 主要趨勢
- 清除
- 有色
第7章:市場估計與預測:按最終用途產業,2021 - 2034 年
- 主要趨勢
- 食品和飲料
- 製藥
- 個人護理和化妝品
- 其他
第8章:市場估計與預測:按地區,2021 - 2034 年
- 主要趨勢
- 北美洲
- 美國
- 加拿大
- 歐洲
- 德國
- 英國
- 法國
- 西班牙
- 義大利
- 荷蘭
- 亞太地區
- 中國
- 印度
- 日本
- 澳洲
- 韓國
- 拉丁美洲
- 巴西
- 墨西哥
- 阿根廷
- 中東和非洲
- 沙烏地阿拉伯
- 南非
- 阿拉伯聯合大公國
第9章:公司簡介
- Alpek SAB de CV
- ALPLA Werke Alwin Lehner GmbH & Co KG
- Verdeco Recycling, Inc.
- Amcor
- Berry Global Group, Inc
- Sidel Group
- Resilux NV
- Graham Packaging
- Taiwan Hon Chuan
- Phoenix Technologies
The Global Recycled PET Bottles Market was valued at USD 2.4 billion in 2024 and is estimated to grow at a CAGR of 9.7% to reach USD 5.9 billion by 2034. As sustainability becomes a core focus across industries, the demand for eco-friendly and recyclable packaging materials is accelerating. Recycled PET (rPET) bottles are gaining significant momentum, especially as companies shift toward closed-loop systems to reduce dependency on virgin plastic. The increased awareness around environmental issues, rising plastic waste concerns, and stringent global regulations are pushing manufacturers to adopt greener packaging alternatives. Consumers, too, are actively seeking out products housed in sustainable packaging, giving brands a competitive edge when they commit to recycling practices. Industries such as food and beverage, personal care, and household products are emerging as major contributors to this transition as they respond to evolving market dynamics and eco-conscious consumer behavior. Technological advancements in recycling processes have further boosted the quality and safety of rPET materials, opening up new avenues for application and scalability in the packaging sector.
Recycled PET bottles are classified into food-grade and non-food-grade categories. The food-grade segment led the market with a value of USD 1.5 billion in 2024. This segment continues to gain ground as food and beverage companies commit to cutting their carbon footprints. The availability of high-quality food-grade rPET that complies with safety standards has made it easier for major players to incorporate sustainable packaging into their product lines. On the other hand, non-food-grade rPET is also expanding its footprint, particularly in the personal care industry, where brands are shifting to recyclable packaging without compromising visual appeal or functionality.
| Market Scope | |
|---|---|
| Start Year | 2024 |
| Forecast Year | 2025-2034 |
| Start Value | $2.4 Billion |
| Forecast Value | $5.9 Billion |
| CAGR | 9.7% |
By bottle type, clear recycled PET bottles commanded the largest market share, reaching USD 1.4 billion in 2024. These bottles closely resemble virgin PET and are highly favored for water, carbonated beverages, and juice packaging due to their clarity and ease of recycling. Manufacturers prefer clear rPET for its adaptability to closed-loop recycling systems and its consumer-friendly aesthetic. The rising consumption of dairy products, shampoos, and ready-to-eat meals has also contributed to the growing demand for clear rPET bottles, offering both product visibility and environmental value.
The United States Recycled PET Bottles Market accounted for USD 735.6 million in 2024. This regional growth is fueled by strong regulatory measures aimed at minimizing plastic waste and an increasing shift among leading companies toward circular packaging strategies.
Industry leaders like Alpek S.A.B. de C.V., Amcor, and Resilux NV are scaling production capabilities, enhancing recycling technologies, and partnering with environmental bodies to meet sustainability goals while strengthening their global market presence.
Table of Contents
Chapter 1 Methodology and Scope
- 1.1 Market scope and definitions
- 1.2 Research design
- 1.2.1 Research approach
- 1.2.2 Data collection methods
- 1.3 Base estimates and calculations
- 1.3.1 Base year calculation
- 1.3.2 Key trends for market estimation
- 1.4 Forecast model
- 1.5 Primary research and validation
- 1.5.1 Primary sources
- 1.5.2 Data mining sources
Chapter 2 Executive Summary
- 2.1 Industry 3600 synopsis
Chapter 3 Industry Insights
- 3.1 Industry ecosystem analysis
- 3.2 Industry impact forces
- 3.2.1 Growth drivers
- 3.2.1.1 Regulatory mandates and sustainability goals
- 3.2.1.2 Growing consumer preference for eco-friendly packaging
- 3.2.1.3 Expansion of the personal care & cosmetics sector
- 3.2.1.4 Growing beverage & food packaging industry
- 3.2.1.5 Advancements in recycling technologies
- 3.2.2 Industry pitfalls and challenges
- 3.2.2.1 Inefficient recycling infrastructure
- 3.2.2.2 Limited availability & high cost of rPET
- 3.2.1 Growth drivers
- 3.3 Growth potential analysis
- 3.4 Regulatory landscape
- 3.5 Technology landscape
- 3.6 Future market trends
- 3.7 Gap analysis
- 3.8 Porter’s analysis
- 3.9 PESTEL analysis
Chapter 4 Competitive Landscape, 2024
- 4.1 Introduction
- 4.2 Company market share analysis
- 4.3 Competitive analysis of major market players
- 4.4 Competitive positioning matrix
- 4.5 Strategy dashboard
Chapter 5 Market Estimates and Forecast, By Grade, 2021 - 2034 (USD Million & Million Units)
- 5.1 Key trends
- 5.2 Food-Grade rPET
- 5.3 Non-Food-Grade rPET
Chapter 6 Market Estimates and Forecast, By Type, 2021 - 2034 (USD Million & Million Units)
- 6.1 Key trends
- 6.2 Clear
- 6.3 Colored
Chapter 7 Market Estimates and Forecast, By End Use Industry, 2021 - 2034 (USD Million & Million Units)
- 7.1 Key trends
- 7.2 Food & beverage
- 7.3 Pharmaceuticals
- 7.4 Personal care & cosmetics
- 7.5 Others
Chapter 8 Market Estimates and Forecast, By Region, 2021 - 2034 (USD Million & Million Units)
- 8.1 Key trends
- 8.2 North America
- 8.2.1 U.S.
- 8.2.2 Canada
- 8.3 Europe
- 8.3.1 Germany
- 8.3.2 UK
- 8.3.3 France
- 8.3.4 Spain
- 8.3.5 Italy
- 8.3.6 Netherlands
- 8.4 Asia Pacific
- 8.4.1 China
- 8.4.2 India
- 8.4.3 Japan
- 8.4.4 Australia
- 8.4.5 South Korea
- 8.5 Latin America
- 8.5.1 Brazil
- 8.5.2 Mexico
- 8.5.3 Argentina
- 8.6 Middle East and Africa
- 8.6.1 Saudi Arabia
- 8.6.2 South Africa
- 8.6.3 UAE
Chapter 9 Company Profiles
- 9.1 Alpek S.A.B. de C.V.
- 9.2 ALPLA Werke Alwin Lehner GmbH & Co KG
- 9.3 Verdeco Recycling, Inc.
- 9.4 Amcor
- 9.5 Berry Global Group, Inc
- 9.6 Sidel Group
- 9.7 Resilux NV
- 9.8 Graham Packaging
- 9.9 Taiwan Hon Chuan
- 9.10 Phoenix Technologies
 生質塑膠包裝市場:2026-2032年全球市場按產品類型、材料類型、應用和製造流程分類的預測
 竹製包裝市場規模、佔有率、成長及全球產業分析:按類型、應用和區域分類,預測2026-2034年
 生物分解感測器市場分析及預測(至2035年):按類型、產品類型、技術、組件、應用、材料類型、最終用戶、功能和安裝類型分類
 用於生質塑膠的生物塑膠市場:市場規模-按地區、應用和預測至2034年零廢棄生物發酵市場分析及預測(至2035年):依類型、產品、服務、技術、應用、製程、最終用戶、材料類型、設備及解決方案分類可生物分解紙和塑膠包裝市場:規模、佔有率、成長和全球產業分析:按類型、應用和地區分類,並預測至2026-2034年生質塑膠包裝市場規模、佔有率、成長及全球產業分析:按類型和應用分類,區域洞察及2026-2034年預測全球可生物分解紙和塑膠包裝市場規模、佔有率、趨勢和成長分析報告(2026-2034年)軟性包裝中的可生物分解生質塑膠:市場規模、平均價格和預測(2018-2034 年)
 2026年全球可生物分解紙和塑膠包裝市場報告