


 |
市場調查報告書
商品編碼
1698249
夾管閥市場機會、成長動力、產業趨勢分析及 2025 - 2034 年預測Pinch Tube Valve Market Opportunity, Growth Drivers, Industry Trend Analysis, and Forecast 2025 - 2034 |
||||||
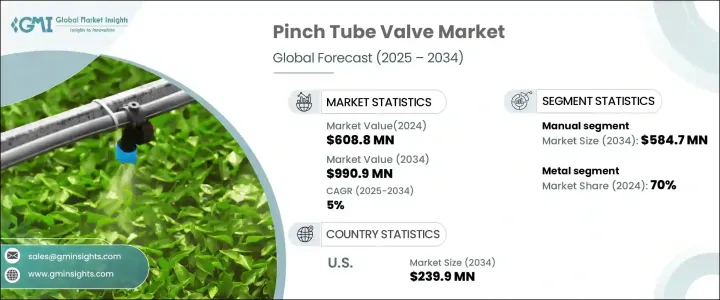
2024 年全球夾管閥市場價值為 6.088 億美元,預計 2025 年至 2034 年期間的複合年成長率為 5%。製藥、食品和飲料、化學品和生物技術等主要產業對精確流體控制和衛生自動化的需求日益成長,推動市場大幅擴張。這些行業嚴重依賴先進的流體管理解決方案來提高效率、維持嚴格的衛生標準並滿足法規要求。
隨著自動化成為工業成長的基石,對夾管閥的需求持續上升,以確保無污染、高效率的流體處理。此外,閥門設計和材料的技術進步正在提高耐用性、性能和適應性,進一步推動各個領域的市場滲透。對永續性和能源效率的日益關注也促使各行各業採用夾管閥,這種閥可實現最低限度的維護、降低營運成本並提供卓越的流體控制。隨著對自動化和流程最佳化的投資不斷增加,未來幾年市場將穩定成長。
| 市場範圍 | |
|---|---|
| 起始年份 | 2024 |
| 預測年份 | 2025-2034 |
| 起始值 | 6.088億美元 |
| 預測值 | 9.909億美元 |
| 複合年成長率 | 5% |
夾管閥市場依操作類型細分,主要分為手動閥和自動閥。 2024年,手動夾管閥佔據最大市場佔有率,達3.64億美元。它們之所以被廣泛採用,是因為其簡單、經濟高效且易於維護。中小型企業以及自動化早期階段的行業更喜歡使用手動夾管閥來實現可靠的流體控制,而無需自動化系統的複雜性或成本。這些閥門廣泛應用於不需要持續大容量自動化,但精確的流體處理仍然至關重要的應用。
根據材料類型,夾管閥市場分為金屬、塑膠和其他材料。 2024年金屬閥門佔據市場主導地位,佔有70%的佔有率。不銹鋼、黃銅和鋁製夾管閥因其出色的耐用性、耐惡劣操作條件和承受高壓的能力而受到青睞。製藥、化學加工、石油和天然氣等行業選擇金屬閥門,因為它們在涉及腐蝕性化學品、高溫和嚴格安全要求的極端環境中具有可靠性。對耐腐蝕和高性能閥門解決方案的需求繼續推動金屬夾管閥在工業應用中的採用。
受自動化和製程控制技術日益普及的推動,美國夾管閥市場規模到 2024 年將達到 1.414 億美元。食品加工、製藥和水處理等行業擴大實施需要精確、無污染的流體流量控制的自動化系統。夾管閥在確保這些產業的運作效率、可靠性和符合衛生標準方面發揮關鍵作用。隨著對精確、易於維護和耐用的閥門解決方案的需求日益增加,美國市場預計將持續成長。
目錄
第1章:方法論與範圍
- 市場範圍和定義
- 基礎估算與計算
- 預測計算
- 資料來源
- 基本的
- 次要
- 付費來源
- 公共資源
第2章:執行摘要
第3章:行業洞察
- 產業生態系統分析
- 影響價值鏈的因素
- 利潤率分析
- 中斷
- 未來展望
- 製造商
- 經銷商
- 技術進步分析
- 監管格局
- 衝擊力
- 成長動力
- 不斷成長的化學品市場
- 對高效能應用程式的需求不斷增加
- 不斷擴大的石油和天然氣市場
- 產業陷阱與挑戰
- 市場飽和
- 永續性問題
- 成長動力
- 消費者購買行為分析
- 人口趨勢
- 影響購買決策的因素
- 消費者產品採用
- 首選配銷通路
- 成長潛力分析
- 波特的分析
- PESTEL 分析
第4章:競爭格局
- 介紹
- 公司市佔率
- 主要市場參與者的競爭分析
- 競爭定位矩陣
- 戰略展望矩陣
第5章:市場估計與預測:按類型,2018 - 2032
- 主要趨勢
- 手動的
- 自動的
第6章:市場估計與預測:按材料,2018 - 2032
- 主要趨勢
- 金屬
- 塑膠
- 其他(陶瓷等)
第7章:市場估計與預測:按功能,2018 - 2032
- 主要趨勢
- 流量控制
- 關斷
- 其他(法規等)
第 8 章:市場估計與預測:按最終用途,2018 - 2032 年
- 主要趨勢
- 化學
- 食品和飲料
- 製藥
- 水處理
- 石油和天然氣
- 其他(採礦等)
第9章:市場估計與預測:按配銷通路,2018 - 2032
- 主要趨勢
- 直接的
- 間接
第10章:市場估計與預測:按地區,2018 - 2032
- 主要趨勢
- 北美洲
- 美國
- 加拿大
- 歐洲
- 英國
- 德國
- 法國
- 義大利
- 西班牙
- 亞太地區
- 中國
- 印度
- 日本
- 韓國
- 澳洲
- 馬來西亞
- 印尼
- 拉丁美洲
- 巴西
- 墨西哥
- 中東及非洲
- 沙烏地阿拉伯
- 阿拉伯聯合大公國
- 南非
第 11 章:公司簡介
- Badger Meter
- Bürkert Fluid Control Systems
- ControlAir
- Crane
- Emerson Electric
- Festo
- Gore
- Graco
- Kitz Corporation
- Nordson Corporation
- Omega Engineering
- Parker Hannifin Corporation
- Pentair
- Schneider Electric
- Swagelok Company
The Global Pinch Tube Valve Market was valued at USD 608.8 million in 2024 and is projected to grow at a CAGR of 5% between 2025 and 2034. The increasing need for precise fluid control and hygienic automation across key industries such as pharmaceuticals, food and beverage, chemicals, and biotechnology is driving significant market expansion. These industries rely heavily on advanced fluid management solutions to enhance efficiency, maintain stringent hygiene standards, and meet regulatory compliance.
As automation becomes a cornerstone of industrial growth, demand for pinch tube valves continues to rise, ensuring contamination-free, efficient fluid handling. Additionally, technological advancements in valve design and materials are improving durability, performance, and adaptability, further fueling market penetration across various sectors. The growing focus on sustainability and energy efficiency is also prompting industries to adopt pinch tube valves, which offer minimal maintenance, reduced operational costs, and superior fluid control. With increasing investments in automation and process optimization, the market is poised for steady growth in the coming years.
| Market Scope | |
|---|---|
| Start Year | 2024 |
| Forecast Year | 2025-2034 |
| Start Value | $608.8 Million |
| Forecast Value | $990.9 Million |
| CAGR | 5% |
The pinch tube valve market is segmented based on operating type, primarily into manual and automatic valves. In 2024, manual pinch tube valves held the largest market share, reaching USD 364 million. Their widespread adoption is attributed to their simplicity, cost-effectiveness, and ease of maintenance. Small and medium-sized enterprises, as well as industries in the early stages of automation, prefer manual pinch valves for reliable fluid control without the complexity or cost of automated systems. These valves are widely used in applications where constant, high-volume automation is not a necessity, but precise fluid handling remains essential.
By material type, the pinch tube valve market is categorized into metal, plastic, and other materials. Metal valves dominated the market in 2024, accounting for a 70% share. Stainless steel, brass, and aluminum pinch valves are preferred for their superior durability, resistance to harsh operating conditions, and ability to withstand high pressure. Industries such as pharmaceuticals, chemical processing, and oil and gas opt for metal valves due to their reliability in extreme environments involving aggressive chemicals, elevated temperatures, and stringent safety requirements. The demand for corrosion-resistant and high-performance valve solutions continues to propel the adoption of metal pinch tube valves across industrial applications.
The U.S. pinch tube valve market was valued at USD 141.4 million in 2024, driven by the growing adoption of automation and process control technologies. Industries such as food processing, pharmaceuticals, and water treatment increasingly implement automated systems that require precise, contamination-free fluid flow control. Pinch tube valves play a critical role in ensuring operational efficiency, reliability, and compliance with hygiene standards in these sectors. As the need for accurate, maintenance-friendly, and durable valve solutions intensifies, the U.S. market is expected to witness consistent growth.
Table of Contents
Chapter 1 Methodology & Scope
- 1.1 Market scope & definition
- 1.2 Base estimates & calculations
- 1.3 Forecast calculations
- 1.4 Data sources
- 1.4.1 Primary
- 1.4.2 Secondary
- 1.4.2.1 Paid sources
- 1.4.2.2 Public sources
Chapter 2 Executive Summary
- 2.1 Industry 3600 synopsis, 2018 - 2032
Chapter 3 Industry Insights
- 3.1 Industry ecosystem analysis
- 3.1.1 Factor affecting the value chain
- 3.1.2 Profit margin analysis
- 3.1.3 Disruptions
- 3.1.4 Future outlook
- 3.1.5 Manufacturers
- 3.1.6 Distributors
- 3.2 Technology advancement analysis
- 3.3 Regulatory landscape
- 3.4 Impact forces
- 3.4.1 Growth drivers
- 3.4.1.1 Growing chemical market
- 3.4.1.2 Increasing demand for high performance applications
- 3.4.1.3 Expanding oil and gas market
- 3.4.2 Industry pitfalls & challenges
- 3.4.2.1 Market saturation
- 3.4.2.2 Sustainability concerns
- 3.4.1 Growth drivers
- 3.5 Consumer buying behavior analysis
- 3.5.1 Demographic trends
- 3.5.2 Factors affecting buying decision
- 3.5.3 Consumer product adoption
- 3.5.4 Preferred distribution channel
- 3.6 Growth potential analysis
- 3.7 Porter’s analysis
- 3.8 PESTEL analysis
Chapter 4 Competitive Landscape, 2023
- 4.1 Introduction
- 4.2 Company market share, 2023
- 4.3 Competitive analysis of major market players, 2023
- 4.4 Competitive positioning matrix, 2023
- 4.5 Strategic outlook matrix, 2023
Chapter 5 Market Estimates & Forecast, By Type, 2018 - 2032, (USD Million; Million Units)
- 5.1 Key trends
- 5.2 Manual
- 5.3 Automatic
Chapter 6 Market Estimates & Forecast, By Material, 2018 - 2032, (USD Million; Million Units)
- 6.1 Key trends
- 6.2 Metal
- 6.3 Plastic
- 6.4 Others (ceramic, etc.)
Chapter 7 Market Estimates & Forecast, By Function, 2018 - 2032, (USD Million; Million Units)
- 7.1 Key trends
- 7.2 Flow control
- 7.3 Shut-off
- 7.4 Other (regulation, etc.)
Chapter 8 Market Estimates & Forecast, By End Use, 2018 - 2032, (USD Million; Million Units)
- 8.1 Key trends
- 8.2 Chemical
- 8.3 Food and beverage
- 8.4 Pharmaceutical
- 8.5 Water treatment
- 8.6 Oil and gas
- 8.7 Others (mining, etc.)
Chapter 9 Market Estimates & Forecast, By Distribution Channel, 2018 - 2032, (USD Million; Million Units)
- 9.1 Key trends
- 9.2 Direct
- 9.3 Indirect
Chapter 10 Market Estimates & Forecast, By Region, 2018 - 2032, (USD Million; Million Units)
- 10.1 Key trends
- 10.2 North America
- 10.2.1 U.S.
- 10.2.2 Canada
- 10.3 Europe
- 10.3.1 UK
- 10.3.2 Germany
- 10.3.3 France
- 10.3.4 Italy
- 10.3.5 Spain
- 10.4 Asia Pacific
- 10.4.1 China
- 10.4.2 India
- 10.4.3 Japan
- 10.4.4 South Korea
- 10.4.5 Australia
- 10.4.6 Malaysia
- 10.4.7 Indonesia
- 10.5 Latin America
- 10.5.1 Brazil
- 10.5.2 Mexico
- 10.6 MEA
- 10.6.1 Saudi Arabia
- 10.6.2 UAE
- 10.6.3 South Africa
Chapter 11 Company Profiles
- 11.1 Badger Meter
- 11.2 Bürkert Fluid Control Systems
- 11.3 ControlAir
- 11.4 Crane
- 11.5 Emerson Electric
- 11.6 Festo
- 11.7 Gore
- 11.8 Graco
- 11.9 Kitz Corporation
- 11.10 Nordson Corporation
- 11.11 Omega Engineering
- 11.12 Parker Hannifin Corporation
- 11.13 Pentair
- 11.14 Schneider Electric
- 11.15 Swagelok Company
 控制閥市場按閥門類型、材料類型、驅動技術、最終用途行業、銷售管道和應用分類 - 全球預測 2025-2032
 2025年全球控制閥市場報告半導體氣動閥市場:按閥門類型、材料類型、操作類型、端口配置、功能、壓力範圍、配銷通路和應用 - 2025-2030 年全球預測
 全球多孔流量控制閥市場
 全球控制閥市場(按組件、材質、類型、尺寸、行業和地區分類)- 預測至 2030 年
 2025-2033 年控制閥市場報告(按類型、技術、組件、材料、最終用途行業和地區)2025年全球進氣壓力控制閥市場報告全球陶瓷控制閥市場全球飛機空氣閥市場日本控制閥市場報告(按類型、尺寸、技術、組件、材料、最終用途行業和地區)2025-2033