


 |
市場調查報告書
商品編碼
1684599
乳化劑、穩定劑和增稠劑 (EST) 市場機會、成長動力、產業趨勢分析和 2025 - 2034 年預測Emulsifiers, Stabilizers and Thickeners (ESTs) Market Opportunity, Growth Drivers, Industry Trend Analysis, and Forecast 2025 - 2034 |
||||||
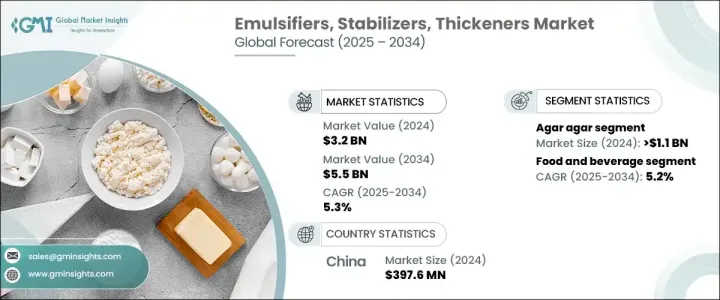
2024 年全球乳化劑、穩定劑和增稠劑市場價值為 32 億美元,預計將經歷強勁成長,2025 年至 2034 年的複合年成長率預計為 5.3%。 EST 市場持續成長可歸因於消費者對高品質產品的需求不斷成長,尤其是人們在日常消費品中尋求更多天然、功能性和清潔標籤的成分。
特別是食品業在推動市場成長方面發揮重要作用。隨著對加工食品、簡便食品和植物食品的需求不斷成長,對乳化劑、穩定劑和增稠劑的需求也在增加,以確保這些產品所需的一致性和品質。向植物性飲食、有機成分和清潔標籤趨勢的轉變也促使更多製造商採用天然和永續的 EST 解決方案。這些成分不僅被視為更環保,而且符合消費者對透明度和更健康選擇日益成長的需求。
| 市場範圍 | |
|---|---|
| 起始年份 | 2024 |
| 預測年份 | 2025-2034 |
| 起始值 | 32億美元 |
| 預測值 | 55億美元 |
| 複合年成長率 | 5.3% |
乳化劑、穩定劑和增稠劑市場的瓊脂部分在 2024 年的價值達到 11 億美元,預計在預測期內的複合年成長率為 5.4%。瓊脂源自紅藻,其天然的植物來源使其在各行業中越來越受歡迎。在食品領域,它被廣泛用作素食配方、乳製品替代品和烘焙食品等產品的凝膠劑。然而,瓊脂的多功能性不僅限於食品,由於其穩定性和質地特性,它在製藥和化妝品領域也越來越受歡迎。
食品和飲料產業仍然是 EST 市場的最大貢獻者,到 2024 年其價值將達到 22 億美元,預計未來十年的成長率為 5.2%。乳化劑在改善乳製品、烘焙食品和飲料的質地和延長保存期限方面發揮關鍵作用。穩定劑和增稠劑對於保持一致性同樣重要,特別是在醬汁、調味醬和冷凍甜點中。隨著消費者偏好不斷向更健康和植物性食品發展,對創新、清潔標籤和天然 EST 解決方案的需求將推動產業進一步進步。
在中國,乳化劑、穩定劑和增稠劑 (EST) 市場在 2024 年創造了 3.976 億美元的產值,預計 2025 年至 2034 年的複合年成長率為 5.8%。隨著消費者對加工食品、簡便食品和植物替代品的興趣日益濃厚,中國市場將受益於國內和國際上青睞清潔標籤和永續成分的趨勢。
目錄
第 1 章:方法論與範圍
- 市場範圍和定義
- 基礎估算與計算
- 預測計算
- 資料來源
- 基本的
- 次要
- 付費來源
- 公共資源
第 2 章:執行摘要
第 3 章:產業洞察
- 產業生態系統分析
- 影響價值鏈的因素
- 利潤率分析
- 中斷
- 未來展望
- 製造商
- 經銷商
- 供應商格局
- 利潤率分析
- 重要新聞及舉措
- 監管格局
- 衝擊力
- 成長動力
- 加工食品需求不斷成長
- 消費者對天然和有機產品的偏好日益增加
- 擴大植物性和純素產品範圍
- 化妝品和個人護理行業的成長
- 產業陷阱與挑戰
- 消費者意識和透明度需求
- 監管障礙
- 成長動力
- 成長潛力分析
- 波特的分析
- PESTEL 分析
第4章:競爭格局
- 介紹
- 公司市佔率分析
- 競爭定位矩陣
- 戰略展望矩陣
第 5 章:市場估計與預測:按產品類型,2021-2034 年
- 主要趨勢
- 瓊脂
- 卡拉膠
- 果膠
- 玉米澱粉
- 黃原膠
- 瓜爾膠
- 葛
- 速效透明凝膠
- 其他
第 6 章:市場估計與預測:按應用,2021 年至 2034 年
- 主要趨勢
- 食品和飲料
- 藥品和營養品
- 化妝品和個人護理
- 其他(例如工業應用)
第 7 章:市場估計與預測:按地區,2021 年至 2034 年
- 主要趨勢
- 北美洲
- 美國
- 加拿大
- 歐洲
- 英國
- 德國
- 法國
- 義大利
- 西班牙
- 俄羅斯
- 亞太地區
- 中國
- 印度
- 日本
- 韓國
- 澳洲
- 拉丁美洲
- 巴西
- 墨西哥
- 中東及非洲
- 南非
- 沙烏地阿拉伯
- 阿拉伯聯合大公國
第8章:公司簡介
- Akzo Nobel NV
- Archer Daniels Midland Company
- BASF SE
- Cargill Incorporated
- Corbion NV
- DuPont Nutrition & Health
- Evonik Industries AG
- Kerry Inc.
- Koninklijke DSM NV
- Stepan Company
The Global Emulsifiers, Stabilizers And Thickeners Market, valued at USD 3.2 billion in 2024, is projected to experience robust growth, with an expected CAGR of 5.3% from 2025 to 2034. These essential additives are crucial in enhancing the texture, performance, and overall quality of products across various industries, including food, cosmetics, and pharmaceuticals. The consistent rise of the ESTs market can be attributed to the increasing consumer demand for higher-quality products, especially as people seek more natural, functional, and clean-label ingredients in their daily consumables.
In particular, the food industry plays a significant role in driving market growth. As demand for processed, convenience, and plant-based foods escalates, so does the need for emulsifiers, stabilizers, and thickeners that ensure the desired consistency and quality of these products. The shift toward plant-based diets, organic ingredients, and clean-label trends is also prompting more manufacturers to adopt natural and sustainable EST solutions. These ingredients are not only seen as more environmentally friendly but also align with the growing consumer desire for transparency and healthier options.
| Market Scope | |
|---|---|
| Start Year | 2024 |
| Forecast Year | 2025-2034 |
| Start Value | $3.2 Billion |
| Forecast Value | $5.5 Billion |
| CAGR | 5.3% |
The agar-agar segment within the emulsifiers, stabilizers, and thickeners market held a notable value of USD 1.1 billion in 2024 and is anticipated to grow at a CAGR of 5.4% during the forecast period. Derived from red algae, agar-agar's natural, plant-based origins have made it increasingly popular in various industries. In the food sector, it is widely used as a gelling agent in products like vegan formulations, dairy alternatives, and baked goods. The versatility of agar-agar extends beyond food, however, as it is also gaining traction in the pharmaceutical and cosmetics sectors due to its stabilizing and texturizing properties.
The food and beverage sector remains the largest contributor to the ESTs market, valued at USD 2.2 billion in 2024, with a projected growth rate of 5.2% over the next decade. Emulsifiers play a key role in improving the texture and prolonging the shelf life of dairy products, baked goods, and beverages. Stabilizers and thickeners are equally crucial in maintaining consistency, particularly in sauces, dressings, and frozen desserts. As consumer preferences continue to evolve toward healthier and plant-based foods, the demand for innovative, clean-label, and natural EST solutions will drive further industry advancements.
In China, the emulsifiers, stabilizers and thickeners (ESTs) market generated USD 397.6 million in 2024 and is projected to grow at a CAGR of 5.8% from 2025 to 2034. The expansion of the food and beverage, cosmetics, and pharmaceutical industries is fueling the demand for high-quality additives. With increasing consumer interest in processed foods, convenience items, and plant-based alternatives, China's market is set to benefit from both domestic and international trends favoring clean-label and sustainable ingredients.
Table of Contents
Chapter 1 Methodology & Scope
- 1.1 Market scope & definitions
- 1.2 Base estimates & calculations
- 1.3 Forecast calculations
- 1.4 Data sources
- 1.4.1 Primary
- 1.4.2 Secondary
- 1.4.2.1 Paid sources
- 1.4.2.2 Public sources
Chapter 2 Executive Summary
- 2.1 Industry synopsis, 2021-2034
Chapter 3 Industry Insights
- 3.1 Industry ecosystem analysis
- 3.1.1 Factor affecting the value chain
- 3.1.2 Profit margin analysis
- 3.1.3 Disruptions
- 3.1.4 Future outlook
- 3.1.5 Manufacturers
- 3.1.6 Distributors
- 3.2 Supplier landscape
- 3.3 Profit margin analysis
- 3.4 Key news & initiatives
- 3.5 Regulatory landscape
- 3.6 Impact forces
- 3.6.1 Growth drivers
- 3.6.1.1 Rising demand for processed foods
- 3.6.1.2 Growing consumer preference for natural and organic products
- 3.6.1.3 Expansion of plant-based and vegan products
- 3.6.1.4 Growth in the cosmetics and personal care industry
- 3.6.2 Industry pitfalls & challenges
- 3.6.2.1 Consumer awareness and demand for transparency
- 3.6.2.2 Regulatory hurdles
- 3.6.1 Growth drivers
- 3.7 Growth potential analysis
- 3.8 Porter's analysis
- 3.9 PESTEL analysis
Chapter 4 Competitive Landscape, 2024
- 4.1 Introduction
- 4.2 Company market share analysis
- 4.3 Competitive positioning matrix
- 4.4 Strategic outlook matrix
Chapter 5 Market Estimates & Forecast, By Product Type, 2021-2034 (USD Billion) (Kilo Tons)
- 5.1 Key trends
- 5.2 Agar Agar
- 5.3 Carrageen
- 5.4 Pectin
- 5.5 Corn starch
- 5.6 Xanthan gum
- 5.7 Guar gum
- 5.8 Arrowroot
- 5.9 Instant clear gel
- 5.10 Others
Chapter 6 Market Estimates & Forecast, By Application, 2021-2034 (USD Billion) (Kilo Tons)
- 6.1 Key trends
- 6.2 Food and beverage
- 6.3 Pharmaceutical and nutraceutical
- 6.4 Cosmetics and personal care
- 6.5 Others (e.g., industrial applications)
Chapter 7 Market Estimates & Forecast, By Region, 2021-2034 (USD Billion) (Kilo Tons)
- 7.1 Key trends
- 7.2 North America
- 7.2.1 U.S.
- 7.2.2 Canada
- 7.3 Europe
- 7.3.1 UK
- 7.3.2 Germany
- 7.3.3 France
- 7.3.4 Italy
- 7.3.5 Spain
- 7.3.6 Russia
- 7.4 Asia Pacific
- 7.4.1 China
- 7.4.2 India
- 7.4.3 Japan
- 7.4.4 South Korea
- 7.4.5 Australia
- 7.5 Latin America
- 7.5.1 Brazil
- 7.5.2 Mexico
- 7.6 MEA
- 7.6.1 South Africa
- 7.6.2 Saudi Arabia
- 7.6.3 UAE
Chapter 8 Company Profiles
- 8.1 Akzo Nobel N.V.
- 8.2 Archer Daniels Midland Company
- 8.3 BASF SE
- 8.4 Cargill Incorporated
- 8.5 Corbion N.V.
- 8.6 DuPont Nutrition & Health
- 8.7 Evonik Industries AG
- 8.8 Kerry Inc.
- 8.9 Koninklijke DSM N.V.
- 8.10 Stepan Company
 2026年全球乳化劑市場報告
 乳化劑市場-全球產業規模、佔有率、趨勢、機會及預測(依原料、應用、區域及競爭格局分類,2021-2031年)
 乳化劑市場規模、佔有率和成長分析(按原料、產品類型、應用和地區分類)-2026-2033年產業預測
 2032年天然乳化劑市場預測:按來源、功能、形式、應用和地區分類的全球分析個人護理乳化劑市場-全球產業規模、佔有率、趨勢、機會和預測(按產品、地區和競爭細分,2020-2030 年)
 個人護理乳化劑市場規模、佔有率和趨勢分析報告:按產品、地區和細分市場預測,2025-2033 年
 全球乳化劑市場:市場規模、市場佔有率、趨勢、行業分析(按原材料、產品類型、應用和地區)、未來預測(2025-2034 年)
 乳化劑市場按來源、應用和地區分類
 2025 年至 2029 年全球化妝品乳化劑市場
 全球乳化劑市場:按原料、產品類型、應用、地區分類 - 到 2029 年的預測