


 |
市場調查報告書
商品編碼
1667158
觸覺技術市場機會、成長動力、產業趨勢分析與 2025 - 2034 年預測Haptic Technology Market Opportunity, Growth Drivers, Industry Trend Analysis, and Forecast 2025 - 2034 |
||||||
2024 年全球觸覺技術市場規模達到 43 億美元,預計 2025 年至 2034 年期間複合年成長率為 3.6%。這一市場成長受到多種因素的推動,包括對虛擬實境(VR)和擴增實境(AR)中更身臨其境的體驗的需求不斷成長,其中先進的觸覺系統正在增強真實感和用戶參與度。隨著這些技術變得越來越主流,使用者正在尋求更深層、更逼真的交互,而觸覺回饋是提供這種體驗的重要元素。
此外,觸覺技術與消費性電子產品的整合大大提升了其市場佔有率。智慧型手機、穿戴式裝置、遊戲裝置和觸控介面都受益於觸覺回饋,為用戶提供增強的互動和參與度。人們對更流暢、更直覺的介面的需求正在不斷擴大,觸覺回饋在連接數位世界和物理世界方面發揮關鍵作用。隨著各行各業越來越認知到觸覺系統的價值,行動應用、遊戲和虛擬實境中的應用正成為創造更具互動性和沈浸感的數位體驗的核心。
| 市場範圍 | |
|---|---|
| 起始年份 | 2024 |
| 預測年份 | 2025-2034 |
| 起始值 | 43億美元 |
| 預測值 | 61億美元 |
| 複合年成長率 | 3.6% |
觸覺技術市場多種多樣,主要應用涵蓋消費性電子、遊戲、汽車、醫療保健、機器人和其他領域。 2024 年,消費性電子產品領域將佔據領先地位,佔據 31% 的市場。觸覺技術現已成為智慧型手機、平板電腦和智慧手錶等設備的基本組成部分。透過為虛擬鍵盤、通知和觸摸手勢提供觸覺響應,它以以前不可能的方式增強了用戶體驗和參與度,為用戶提供與其設備的觸覺連接。
此外,觸覺系統根據使用類型分類,包括可抓握、可觸摸和穿戴式系統。到 2034 年,可抓握設備市場預計將創造 26 億美元的收入。它們在遊戲、機器人和工業模擬等行業尤其有價值,因為創造逼真的使用者體驗至關重要。
美國在全球觸覺技術市場佔據主導地位,2024 年的市佔率高達 87.4%。隨著 VR 和 AR 技術不斷受到歡迎,觸覺回饋系統在一系列應用中的整合預計將擴大,進一步鞏固美國作為這些創新技術領先市場的地位。
目錄
第 1 章:方法論與範圍
- 市場範圍和定義
- 基礎估算與計算
- 預測計算
- 資料來源
- 基本的
- 次要
- 付費來源
- 公共資源
第 2 章:執行摘要
第 3 章:產業洞察
- 產業生態系統分析
- 影響價值鏈的因素
- 利潤率分析
- 中斷
- 未來展望
- 製造商
- 經銷商
- 供應商概況
- 利潤率分析
- 重要新聞及舉措
- 監管格局
- 衝擊力
- 成長動力
- VR 和 AR 技術的進步
- 觸覺技術在消費性電子產品的應用日益廣泛
- 擴大在醫療保健和醫療器材領域的應用
- 穿戴式裝置需求不斷成長
- 產業陷阱與挑戰
- 先進觸覺設備成本高昂
- 技術限制和標準化挑戰
- 成長動力
- 成長潛力分析
- 波特的分析
- PESTEL 分析
第4章:競爭格局
- 介紹
- 公司市佔率分析
- 競爭定位矩陣
- 戰略展望矩陣
第 5 章:市場估計與預測:按組件,2021 年至 2034 年
- 主要趨勢
- 硬體
- 軟體
第 6 章:市場估計與預測:按回饋,2021 年至 2034 年
- 主要趨勢
- 力量
- 觸
- 振動觸覺
- 電觸覺
- 超音波觸覺
- 熱的
第 7 章:市場估計與預測:按使用類型,2021 年至 2034 年
- 主要趨勢
- 可抓握
- 可觸摸
- 穿戴
第 8 章:市場估計與預測:按應用,2021 年至 2034 年
- 主要趨勢
- 消費性電子產品
- 賭博
- 汽車
- 衛生保健
- 機器人
- 其他
第 9 章:市場估計與預測:按地區,2021 年至 2034 年
- 主要趨勢
- 北美洲
- 美國
- 加拿大
- 歐洲
- 英國
- 德國
- 法國
- 義大利
- 西班牙
- 俄羅斯
- 亞太地區
- 中國
- 印度
- 日本
- 韓國
- 澳洲
- 拉丁美洲
- 巴西
- 墨西哥
- 中東及非洲
- 南非
- 沙烏地阿拉伯
- 阿拉伯聯合大公國
第10章:公司簡介
- AAC Technologies
- Aito BV
- Force Dimension
- Geomagic, Inc.
- Immersion Corporation
- Imagis Co., Ltd.
- Johnson Electric Holdings Limited
- Microchip Technology Incorporated
- Nidec Corporation
- Onsemi
- Precision Microdrives Limited
- Senseg Oy
- Synaptics Incorporated
- TDK Corporation
- Texas Instruments Incorporated
- Ultraleap Limited
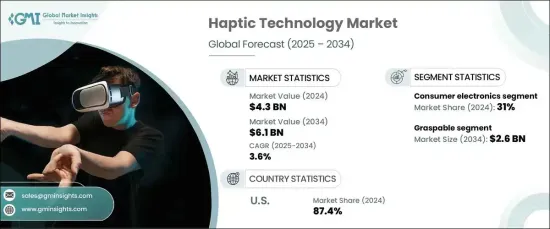
The Global Haptic Technology Market reached USD 4.3 billion in 2024 and is forecasted to expand at a CAGR of 3.6% from 2025 to 2034. Haptic technology, which provides tactile feedback in response to user interactions, has become a game-changer across multiple industries. This market growth is being driven by several factors, including the increasing demand for more immersive experiences in virtual reality (VR) and augmented reality (AR), where advanced haptic systems are enhancing realism and user engagement. As these technologies become more mainstream, users are seeking deeper, more lifelike interactions, making haptic feedback an essential element for delivering that experience.
Moreover, the integration of haptic technology into consumer electronics has significantly boosted its market presence. Smartphones, wearables, gaming devices, and touch interfaces are all benefiting from tactile feedback, offering users enhanced interaction and engagement. The demand for smoother, more intuitive interfaces is expanding, with haptic feedback playing a key role in bridging the digital and physical worlds. As industries increasingly recognize the value of haptic systems, applications in mobile apps, gaming, and VR are becoming central to creating more interactive and immersive digital experiences.
| Market Scope | |
|---|---|
| Start Year | 2024 |
| Forecast Year | 2025-2034 |
| Start Value | $4.3 Billion |
| Forecast Value | $6.1 Billion |
| CAGR | 3.6% |
The haptic technology market is diverse, with key applications spanning consumer electronics, gaming, automotive, healthcare, robotics, and other sectors. In 2024, the consumer electronics segment led the charge, holding a 31% share of the market. Haptic technology is now a fundamental part of devices like smartphones, tablets, and smartwatches. By providing tactile responses to virtual keyboards, notifications, and touch gestures, it enhances user experience and engagement in ways that were previously not possible, offering users a tactile sense of connection with their devices.
Additionally, haptic systems are categorized by usage type, which includes graspable, touchable, and wearable systems. The graspable segment is set to generate USD 2.6 billion in revenue by 2034. These devices, typically used in handheld controllers or objects, deliver tactile sensations that replicate physical feedback, such as texture, resistance, or motion. They are particularly valuable in industries like gaming, robotics, and industrial simulations, where creating a lifelike user experience is paramount.
The U.S. dominates the global haptic technology market, holding an impressive 87.4% market share in 2024. The country's leadership is driven by its strong presence in the consumer electronics and gaming sectors, alongside significant investments in developing cutting-edge haptic solutions. As VR and AR technologies continue to rise in popularity, the integration of haptic feedback systems across a range of applications is expected to expand, further solidifying the U.S.'s position as the leading market for these innovative technologies.
Table of Contents
Chapter 1 Methodology & Scope
- 1.1 Market scope & definitions
- 1.2 Base estimates & calculations
- 1.3 Forecast calculations
- 1.4 Data sources
- 1.4.1 Primary
- 1.4.2 Secondary
- 1.4.2.1 Paid sources
- 1.4.2.2 Public sources
Chapter 2 Executive Summary
- 2.1 Industry synopsis, 2021-2034
Chapter 3 Industry Insights
- 3.1 Industry ecosystem analysis
- 3.1.1 Factor affecting the value chain
- 3.1.2 Profit margin analysis
- 3.1.3 Disruptions
- 3.1.4 Future outlook
- 3.1.5 Manufacturers
- 3.1.6 Distributors
- 3.2 Supplier landscape
- 3.3 Profit margin analysis
- 3.4 Key news & initiatives
- 3.5 Regulatory landscape
- 3.6 Impact forces
- 3.6.1 Growth drivers
- 3.6.1.1 Advancements in VR and AR technologies
- 3.6.1.2 Increasing adoption of haptic technology in consumer electronics
- 3.6.1.3 Expanding use in healthcare and medical devices
- 3.6.1.4 Growing demand for wearable devices
- 3.6.2 Industry pitfalls & challenges
- 3.6.2.1 High cost of advanced haptic devices
- 3.6.2.2 Technical limitations and standardization challenges
- 3.6.1 Growth drivers
- 3.7 Growth potential analysis
- 3.8 Porter’s analysis
- 3.9 PESTEL analysis
Chapter 4 Competitive Landscape, 2024
- 4.1 Introduction
- 4.2 Company market share analysis
- 4.3 Competitive positioning matrix
- 4.4 Strategic outlook matrix
Chapter 5 Market Estimates & Forecast, By Component, 2021-2034 (USD Million)
- 5.1 Key trends
- 5.2 Hardware
- 5.3 Software
Chapter 6 Market Estimates & Forecast, By Feedback, 2021-2034 (USD Million)
- 6.1 Key trends
- 6.2 Force
- 6.3 Tactile
- 6.3.1 Vibrotactile
- 6.3.2 Electro tactile
- 6.3.3 Ultrasonic Tactile
- 6.4 Thermal
Chapter 7 Market Estimates & Forecast, By Usage Type, 2021-2034 (USD Million)
- 7.1 Key trends
- 7.2 Graspable
- 7.3 Touchable
- 7.4 Wearable
Chapter 8 Market Estimates & Forecast, By Application, 2021-2034 (USD Million)
- 8.1 Key trends
- 8.2 Consumer electronics
- 8.3 Gaming
- 8.4 Automotive
- 8.5 Healthcare
- 8.6 Robotics
- 8.7 Others
Chapter 9 Market Estimates & Forecast, By Region, 2021-2034 (USD Million)
- 9.1 Key trends
- 9.2 North America
- 9.2.1 U.S.
- 9.2.2 Canada
- 9.3 Europe
- 9.3.1 UK
- 9.3.2 Germany
- 9.3.3 France
- 9.3.4 Italy
- 9.3.5 Spain
- 9.3.6 Russia
- 9.4 Asia Pacific
- 9.4.1 China
- 9.4.2 India
- 9.4.3 Japan
- 9.4.4 South Korea
- 9.4.5 Australia
- 9.5 Latin America
- 9.5.1 Brazil
- 9.5.2 Mexico
- 9.6 MEA
- 9.6.1 South Africa
- 9.6.2 Saudi Arabia
- 9.6.3 UAE
Chapter 10 Company Profiles
- 10.1 AAC Technologies
- 10.2 Aito BV
- 10.3 Force Dimension
- 10.4 Geomagic, Inc.
- 10.5 Immersion Corporation
- 10.6 Imagis Co., Ltd.
- 10.7 Johnson Electric Holdings Limited
- 10.8 Microchip Technology Incorporated
- 10.9 Nidec Corporation
- 10.10 Onsemi
- 10.11 Precision Microdrives Limited
- 10.12 Senseg Oy
- 10.13 Synaptics Incorporated
- 10.14 TDK Corporation
- 10.15 Texas Instruments Incorporated
- 10.16 Ultraleap Limited
 全球觸覺技術市場:市場規模、佔有率、趨勢分析(按回饋類型、致動器技術、組件、應用和地區分類)、展望和預測(2025-2032 年)
 2025年全球觸覺設備市場報告
 觸覺回饋手術環境市場(按設備類型、應用、回饋方式、組件和最終用戶分類)—2025-2032年全球預測2025年觸覺技術全球市場報告
 全球觸覺技術市場(按回饋類型、組件、產業垂直和地區分類)- 預測至 2030 年2025年表面觸覺技術全球市場報告觸覺技術市場(按組件、技術類型、連接性、應用和最終用戶分類)—2025 年至 2030 年全球預測
 2025 年至 2033 年觸覺技術市場報告(按組件、回饋、技術、應用和地區)
 汽車神經自適應觸覺回饋組件市場 - 全球及區域分析:按車輛類型、按推進類型、按自主程度、按組件、按產品類型、按國家/地區 - 分析與預測(2025 年至 2035 年)
 行動觸覺技術市場按類型、產品和地區分類