


 |
市場調查報告書
商品編碼
1666953
貨車市場機會、成長動力、產業趨勢分析與 2025 - 2034 年預測Cargo Vans Market Opportunity, Growth Drivers, Industry Trend Analysis, and Forecast 2025 - 2034 |
||||||
2024 年全球貨車市場價值為 1,094 億美元,預計 2025 年至 2034 年期間的複合年成長率為 6.7%。消費者對網上購物的偏好日益增加以及快速送貨服務的興起進一步推動了零售、食品配送和醫療保健等行業的成長。城市化和人口密度的提高正在重塑需求,從而推動更小型、更靈活的車輛的發展,以適應擁擠的城市的通行。此外,製造商正在採用電動和混合動力技術來滿足環境法規、提高燃油效率並減少排放,使市場適應現代城市物流。
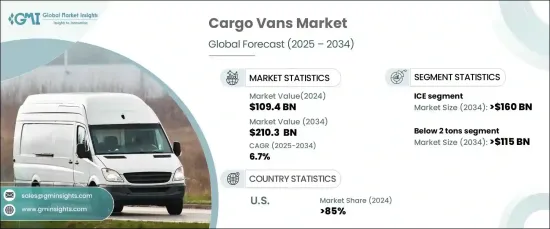
在推進方面,內燃機 (ICE) 汽車佔據主導地位,到 2024 年將佔據 80% 以上的市場佔有率。輕度混合動力和插電式系統等混合動力技術也越來越受到重視。這些系統將內燃機與電動馬達結合在一起,以提高能源效率並減少排放,在動力和永續性之間實現最佳化平衡。
| 市場範圍 | |
|---|---|
| 起始年份 | 2024 |
| 預測年份 | 2025-2034 |
| 起始值 | 1094億美元 |
| 預測值 | 2103億美元 |
| 複合年成長率 | 6.7% |
廂型車依載重量又分為2噸以下、2-3噸、3噸以上。預計到 2034 年,2 噸以下細分市場的規模將超過 1,150 億美元。增強的電池技術可以實現更長的續航里程和更快的充電速度,使這些貨車成為最後一哩配送和市政車隊營運的理想選擇。自適應巡航控制、車道輔助和自動煞車等安全功能擴大整合,以提高營運效率和車隊管理。
在嚴格的環境法規和企業永續發展的推動下,美國將在 2024 年佔據 85% 以上的收入佔有率。由於營運成本較低、排放減少以及政府激勵措施,電動貨車越來越受歡迎。歐洲正專注於模組化和可自訂的設計,以實現冷藏運輸和移動車間等應用。同時,亞太地區正瞄準成本敏感市場,提供多功能且價格實惠的設計,以滿足小型企業和企業家的需求。先進的製造技術有助於在保持品質的同時降低生產成本,確保這些車輛滿足城市和農村環境中的多樣化營運需求。
目錄
第 1 章:方法論與範圍
- 研究設計
- 研究方法
- 資料收集方法
- 基礎估計和計算
- 基準年計算
- 市場估計的主要趨勢
- 預測模型
- 初步研究與驗證
- 主要來源
- 資料探勘來源
- 市場定義
第 2 章:執行摘要
第 3 章:產業洞察
- 產業生態系統分析
- 供應商概況
- 零件製造商
- 汽車OEM
- 一級供應商
- 最終用途
- 利潤率分析
- 技術差異化
- 電動動力系統
- 遠端資訊處理解決方案
- 模組化和可自訂的設計
- 先進的貨物管理系統
- 其他
- 重要新聞及舉措
- 專利分析
- 監管格局
- 衝擊力
- 成長動力
- 電子商務產業的成長
- 最後一哩配送供應鏈的改進
- 增加國際貿易
- 貨車電氣化程度不斷提高
- 產業陷阱與挑戰
- 電動車基礎設施的限制
- 監理複雜性
- 成長動力
- 成長潛力分析
- 波特的分析
- PESTEL 分析
第4章:競爭格局
- 介紹
- 公司市佔率分析
- 競爭定位矩陣
- 戰略展望矩陣
第 5 章:市場估計與預測:按推進方式,2021 - 2034 年
- 主要趨勢
- 冰
- 電的
- 純電動車
- 油電混合車
- 插電式混合動力汽車
第6章:市場估計與預測:以噸位容量,2021 - 2034 年
- 主要趨勢
- 2噸以下
- 2至3噸
- 3噸以上
第 7 章:市場估計與預測:按最終用途,2021 - 2034 年
- 主要趨勢
- 個人的
- 商業的
第 8 章:市場估計與預測:按地區,2021 - 2034 年
- 主要趨勢
- 北美洲
- 美國
- 加拿大
- 歐洲
- 英國
- 德國
- 法國
- 西班牙
- 義大利
- 俄羅斯
- 北歐
- 亞太地區
- 中國
- 印度
- 日本
- 韓國
- 澳新銀行
- 東南亞
- 拉丁美洲
- 巴西
- 墨西哥
- 阿根廷
- 中東及非洲
- 阿拉伯聯合大公國
- 南非
- 沙烏地阿拉伯
第9章:公司簡介
- Citroen
- Dongfeng
- Ford
- General Motors
- Honda
- Hyundai
- Isuzu
- Iveco
- JAC Motors
- Kia
- Mahindra & Mahindra
- MAN
- Mercedes-Benz
- Nissan
- Peugeot
- Renault
- Stellantis
- Tata Motors
- TOYOTA
- Volkswagen
The Global Cargo Vans Market was valued at USD 109.4 billion in 2024 and is expected to grow at a CAGR of 6.7% from 2025 to 2034. The rapid expansion of e-commerce and associated logistics operations is driving demand for these vehicles. Increasing consumer preference for online shopping and the rise of fast delivery services are further fueling growth across industries like retail, food delivery, and healthcare. Urbanization and higher population density are reshaping requirements, leading to the development of smaller, more agile vehicles suited for navigating congested cities. Additionally, manufacturers are incorporating electric and hybrid technologies to meet environmental regulations, enhance fuel efficiency, and reduce emissions, enabling the market to adapt to modern urban logistics.
In terms of propulsion, internal combustion engine (ICE) vehicles dominate, accounting for over 80% of the market share in 2024. This segment is projected to surpass USD 160 billion by 2034. Advancements in compact and efficient diesel and gasoline engines, along with innovations like turbocharging and precision fuel injection systems, are enhancing performance. Hybrid technologies, such as mild-hybrid and plug-in systems, are also gaining traction. These systems combine ICEs with electric motors to improve energy efficiency and reduce emissions, offering an optimized balance between power and sustainability.
| Market Scope | |
|---|---|
| Start Year | 2024 |
| Forecast Year | 2025-2034 |
| Start Value | $109.4 Billion |
| Forecast Value | $210.3 Billion |
| CAGR | 6.7% |
Cargo vans are further categorized based on tonnage capacity into below 2 tons, 2-3 tons, and above 3 tons. The below 2 tons segment is expected to exceed USD 115 billion by 2034. Electrification is a major factor driving growth in this category, with manufacturers developing lightweight batteries, efficient motors, and advanced energy management systems to cater to urban delivery and short-range applications. Enhanced battery technology is enabling longer ranges and faster charging, making these vans ideal for last-mile delivery and municipal fleet operations. Safety features like adaptive cruise control, lane assistance, and automated braking are increasingly integrated to improve operational efficiency and fleet management.
The US accounted for over 85% of the revenue share in 2024, driven by stringent environmental regulations and the push for corporate sustainability. Electric vans are gaining traction due to lower operational costs, reduced emissions, and government incentives. Europe is focusing on modular and customizable designs, enabling applications like refrigerated transport and mobile workshops. Meanwhile, the Asia Pacific region is targeting cost-sensitive markets with versatile and affordable designs that cater to small businesses and entrepreneurs. Advanced manufacturing techniques are helping reduce production costs while maintaining quality, ensuring these vehicles meet diverse operational needs in both urban and rural settings.
Table of Contents
Chapter 1 Methodology & Scope
- 1.1 Research design
- 1.1.1 Research approach
- 1.1.2 Data collection methods
- 1.2 Base estimates and calculations
- 1.2.1 Base year calculation
- 1.2.2 Key trends for market estimates
- 1.3 Forecast model
- 1.4 Primary research & validation
- 1.4.1 Primary sources
- 1.4.2 Data mining sources
- 1.5 Market definitions
Chapter 2 Executive Summary
- 2.1 Industry 3600 synopsis, 2021 - 2032
Chapter 3 Industry Insights
- 3.1 Industry ecosystem analysis
- 3.2 Supplier landscape
- 3.2.1 Component manufacturers
- 3.2.2 Automotive OEM
- 3.2.3 Tier-1 suppliers
- 3.2.4 End use
- 3.3 Profit margin analysis
- 3.4 Technology differentiators
- 3.4.1 Electric powertrains
- 3.4.2 Telematics solutions
- 3.4.3 Modular and customizable designs
- 3.4.4 Advanced cargo management systems
- 3.4.5 Others
- 3.5 Key news & initiatives
- 3.6 Patent analysis
- 3.7 Regulatory landscape
- 3.8 Impact forces
- 3.8.1 Growth drivers
- 3.8.1.1 Growth of e-commerce sector
- 3.8.1.2 Improvements in last mile delivery supply chains
- 3.8.1.3 Increasing international trade
- 3.8.1.4 Growing electrification of cargo vans
- 3.8.2 Industry pitfalls & challenges
- 3.8.2.1 Electric vehicle infrastructure limitations
- 3.8.2.2 Regulatory complexity
- 3.8.1 Growth drivers
- 3.9 Growth potential analysis
- 3.10 Porter’s analysis
- 3.11 PESTEL analysis
Chapter 4 Competitive Landscape, 2024
- 4.1 Introduction
- 4.2 Company market share analysis
- 4.3 Competitive positioning matrix
- 4.4 Strategic outlook matrix
Chapter 5 Market Estimates & Forecast, By Propulsion, 2021 - 2034 ($Bn, Units)
- 5.1 Key trends
- 5.2 ICE
- 5.3 Electric
- 5.3.1 Battery electric vehicle
- 5.3.2 Hybrid Electric vehicle
- 5.3.3 Plug-in hybrid electric vehicle
Chapter 6 Market Estimates & Forecast, By Tonnage Capacity, 2021 - 2034 ($Bn, Units)
- 6.1 Key trends
- 6.2 Below 2 tons
- 6.3 2 to 3 tons
- 6.4 Above 3 tons
Chapter 7 Market Estimates & Forecast, By End Use, 2021 - 2034 ($Bn, Units)
- 7.1 Key trends
- 7.2 Personal
- 7.3 Commercial
Chapter 8 Market Estimates & Forecast, By Region, 2021 - 2034 ($Bn, Units)
- 8.1 Key trends
- 8.2 North America
- 8.2.1 U.S.
- 8.2.2 Canada
- 8.3 Europe
- 8.3.1 UK
- 8.3.2 Germany
- 8.3.3 France
- 8.3.4 Spain
- 8.3.5 Italy
- 8.3.6 Russia
- 8.3.7 Nordics
- 8.4 Asia Pacific
- 8.4.1 China
- 8.4.2 India
- 8.4.3 Japan
- 8.4.4 South Korea
- 8.4.5 ANZ
- 8.4.6 Southeast Asia
- 8.5 Latin America
- 8.5.1 Brazil
- 8.5.2 Mexico
- 8.5.3 Argentina
- 8.6 MEA
- 8.6.1 UAE
- 8.6.2 South Africa
- 8.6.3 Saudi Arabia
Chapter 9 Company Profiles
- 9.1 Citroen
- 9.2 Dongfeng
- 9.3 Ford
- 9.4 General Motors
- 9.5 Honda
- 9.6 Hyundai
- 9.7 Isuzu
- 9.8 Iveco
- 9.9 JAC Motors
- 9.10 Kia
- 9.11 Mahindra & Mahindra
- 9.12 MAN
- 9.13 Mercedes-Benz
- 9.14 Nissan
- 9.15 Peugeot
- 9.16 Renault
- 9.17 Stellantis
- 9.18 Tata Motors
- 9.19 TOYOTA
- 9.20 Volkswagen
 全球貨車市場
 2025年全球超大貨物運輸市場報告全球貨箱市場
 貨輪的全球市場的評估:船舶類別,各燃料類型,各最終用途,各地區,機會,預測(2018年~2032年)
 貨物運輸市場按貨物類型、最終用戶產業、船舶類型和地區分類(2026 年至 2032 年)
 2025-2029年全球貨運代理市場2025年全球電動垃圾車市場報告
 超大外套市場報告:2031 年趨勢、預測與競爭分析
 滾裝船市場規模、佔有率、成長分析(按類型、按容量、按燃料類型、按應用、按地區)- 產業預測,2025 年至 2032 年
 貨運運輸市場 - 全球產業規模、佔有率、趨勢、機會和預測,按貨物類型、行業、地區和競爭細分,2020-2030 年