


 |
市場調查報告書
商品編碼
1664873
貨櫃裝卸設備市場機會、成長動力、產業趨勢分析及 2025 - 2034 年預測Container Handling Equipment Market Opportunity, Growth Drivers, Industry Trend Analysis, and Forecast 2025 - 2034 |
||||||
2024 年全球貨櫃裝卸設備市場價值為 86 億美元,預計 2025 年至 2034 年期間將以 5.4% 的強勁複合年成長率成長。 這一成長是由對高效集裝箱裝卸解決方案的需求不斷成長所推動的,而推動貨物的偏好和對日益成長。隨著全球供應鏈變得越來越複雜,起重機、堆疊機和自動化技術等先進系統的採用正在迅速增加。港口擴建和基礎設施升級的投資進一步加速了對最先進設備的需求,以滿足現代物流不斷變化的需求。
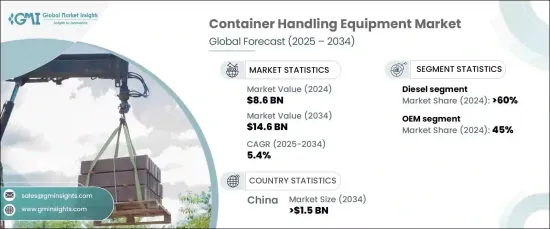
市場依推進方式分為柴油、電力和混合動力系統。 2024 年,柴油動力設備佔據了 60% 的主導佔有率,預計到 2034 年將達到 60 億美元。它可提供高功率輸出,非常適合重型作業,特別是在電力基礎設施有限的環境中。柴油動力系統的多功能性和可靠性確保它們將保持領先地位,特別是在大型港口和物流樞紐。
| 市場範圍 | |
|---|---|
| 起始年份 | 2024 |
| 預測年份 | 2025-2034 |
| 起始值 | 86億美元 |
| 預測值 | 146億美元 |
| 複合年成長率 | 5.4% |
依容量,市場分為10噸以下、10-50噸、50噸以上。容量高達 10 噸的市場由於其經濟實惠、靈活性以及在各個行業的廣泛使用而引領市場。這些系統通常用於處理中型貨物的倉庫、製造工廠和港口。與大容量設備相比,它們的成本較低,因此可以被更廣泛的營運商使用,這進一步加強了它們在市場上的主導地位。
2024 年,中國貨櫃裝卸設備市場佔全球佔有率的 30%,預計到 2034 年將創下 15 億美元的市場價值。作為全球貿易強國,中國在市場上發揮著至關重要的作用,利用其大規模的生產能力和有競爭力的價格來滿足日益成長的貨櫃裝卸設備需求。
目錄
第 1 章:方法論與範圍
- 研究設計
- 研究方法
- 資料收集方法
- 基礎估計和計算
- 基準年計算
- 市場估計的主要趨勢
- 預測模型
- 初步研究與驗證
- 主要來源
- 資料探勘來源
- 市場定義
第 2 章:執行摘要
第 3 章:產業洞察
- 產業生態系統分析
- 供應商概況
- 製造商
- 技術提供者
- 經銷商
- 最終用戶
- 利潤率分析
- 設備成本明細
- 技術與創新格局
- 專利格局
- 使用案例
- 重要新聞及舉措
- 監管格局
- 衝擊力
- 成長動力
- 全球貿易和貨櫃貨運量成長
- 採用自動化和數位技術
- 港口擴建和基礎設施發展
- 設備技術進步
- 產業陷阱與挑戰
- 初期資本投入高
- 營運和維護成本
- 成長動力
- 成長潛力分析
- 波特的分析
- PESTEL 分析
第4章:競爭格局
- 介紹
- 公司市佔率分析
- 競爭定位矩陣
- 戰略展望矩陣
第 5 章:市場估計與預測:按設備,2021 - 2034 年
- 主要趨勢
- 自動堆疊起重機 (ASC)
- 空箱搬運堆高機 (FLT)
- 載貨堆高機 (FLT)
- 移動式港口起重機 (MHC)
- 軌道式龍門起重機 (RMG)
- 正面吊
- 輪胎式龍門起重機 (RTG)
- 船到岸 (STS) 起重機
- 其他
第 6 章:市場估計與預測:按應用,2021 - 2034 年
- 主要趨勢
- 港口碼頭
- 鐵路樞紐
- 內陸貨櫃堆場 (ICD)
- 物流中心
第 7 章:市場估計與預測:按推進方式,2021 - 2034 年
- 主要趨勢
- 柴油引擎
- 電的
- 混合
第 8 章:市場估計與預測:按產能,2021 - 2034 年
- 主要趨勢
- 最多 10 噸
- 10-50噸
- 50噸及以上
第 9 章:市場估計與預測:按地區,2021 - 2034 年
- 主要趨勢
- 北美洲
- 美國
- 加拿大
- 歐洲
- 英國
- 德國
- 法國
- 西班牙
- 義大利
- 俄羅斯
- 北歐
- 亞太地區
- 中國
- 印度
- 日本
- 韓國
- 澳新銀行
- 東南亞
- 拉丁美洲
- 巴西
- 墨西哥
- 阿根廷
- 中東及非洲
- 阿拉伯聯合大公國
- 南非
- 沙烏地阿拉伯
第10章:公司簡介
- Konecranes
- Cargotec
- Liebherr Group
- ZPMC (Shanghai Zhenhua Heavy Industries Company)
- Terex
- Doosan Heavy Industries & Construction
- Hyster-Yale Materials Handling
- Toyota Industries
- Mitsubishi Heavy Industries
- SANY Group
- Caterpillar Inc.
- Hyundai Heavy Industries
- Kalmar
- Manitowoc Crane Group
- STILL GmbH
- Jungheinrich AG
- Palfinger AG
- TMEIC Corporation
- Furukawa Electric Co., Ltd.
- ABUS Kransysteme GmbH
The Global Container Handling Equipment Market was valued at USD 8.6 billion in 2024 and is expected to grow at a robust CAGR of 5.4% from 2025 to 2034. This growth is driven by the increasing demand for efficient container handling solutions, fueled by rising international trade and the growing preference for containerized cargo. As global supply chains become more complex, the adoption of advanced systems such as cranes, stackers, and automated technologies is rapidly increasing. Investments in port expansions and infrastructure upgrades are further accelerating the need for state-of-the-art equipment to meet the evolving demands of modern logistics.
The market is segmented by propulsion into diesel, electric, and hybrid systems. Diesel-powered equipment held a dominant 60% share in 2024 and is projected to reach USD 6 billion by 2034. Diesel continues to be a popular choice due to its reliability, well-established infrastructure, and cost-effectiveness. It delivers high power output, making it ideal for heavy-duty operations, especially in environments with limited electric infrastructure. The versatility and dependability of diesel-powered systems ensure they will maintain their lead, particularly in large-scale ports and logistics hubs.
| Market Scope | |
|---|---|
| Start Year | 2024 |
| Forecast Year | 2025-2034 |
| Start Value | $8.6 Billion |
| Forecast Value | $14.6 Billion |
| CAGR | 5.4% |
By capacity, the market is divided into up to 10 tons, 10-50 tons, and 50 tons and above. The up to 10 tons capacity segment is leading the market thanks to its affordability, flexibility, and widespread use across industries. These systems are commonly found in warehouses, manufacturing facilities, and ports handling medium-sized cargo. Their lower cost compared to higher-capacity equipment makes them accessible to a wider range of operators, further strengthening their dominance in the market.
The container handling equipment market in China accounted for 30% of the global share in 2024 and is set to generate USD 1.5 billion by 2034. The country's leadership is attributed to its strong manufacturing capabilities, cost-effective production, and strategic investments in port infrastructure. As a global trade powerhouse, China plays a crucial role in the market, leveraging its large-scale production capacity and competitive pricing to meet the growing demand for container handling equipment.
Table of Contents
Chapter 1 Methodology & Scope
- 1.1 Research design
- 1.1.1 Research approach
- 1.1.2 Data collection methods
- 1.2 Base estimates and calculations
- 1.2.1 Base year calculation
- 1.2.2 Key trends for market estimates
- 1.3 Forecast model
- 1.4 Primary research & validation
- 1.4.1 Primary sources
- 1.4.2 Data mining sources
- 1.5 Market definitions
Chapter 2 Executive Summary
- 2.1 Industry 3600 synopsis, 2021 - 2034
Chapter 3 Industry Insights
- 3.1 Industry ecosystem analysis
- 3.2 Supplier landscape
- 3.2.1 Manufacturers
- 3.2.2 Technology providers
- 3.2.3 Distributors
- 3.2.4 End users
- 3.3 Profit margin analysis
- 3.4 Cost Breakdown of equipment
- 3.5 Technology & innovation landscape
- 3.6 Patent landscape
- 3.7 Use cases
- 3.8 Key news & initiatives
- 3.9 Regulatory landscape
- 3.10 Impact forces
- 3.10.1 Growth drivers
- 3.10.1.1 Growth in global trade and containerized cargo
- 3.10.1.2 Adoption of automation and digital technologies
- 3.10.1.3 Port expansion and infrastructure development
- 3.10.1.4 Technological advancements in equipment
- 3.10.2 Industry pitfalls & challenges
- 3.10.2.1 High initial capital investment
- 3.10.2.2 Operational and maintenance costs
- 3.10.1 Growth drivers
- 3.11 Growth potential analysis
- 3.12 Porter’s analysis
- 3.13 PESTEL analysis
Chapter 4 Competitive Landscape, 2024
- 4.1 Introduction
- 4.2 Company market share analysis
- 4.3 Competitive positioning matrix
- 4.4 Strategic outlook matrix
Chapter 5 Market Estimates & Forecast, By Equipment, 2021 - 2034 ($Bn, Units)
- 5.1 Key trends
- 5.2 Automated Stacking Crane (ASC)
- 5.3 Empty Container Handling Forklift Truck (FLT)
- 5.4 Laden Forklift Truck (FLT)
- 5.5 Mobile Harbor Crane (MHC)
- 5.6 Rail Mounted Gantry (RMG) Crane
- 5.7 Reach Stacker
- 5.8 Rubber Tired Gantry (RTG) Crane
- 5.9 Ship to Shore (STS) Crane
- 5.10 Others
Chapter 6 Market Estimates & Forecast, By Application, 2021 - 2034 ($Bn, Units)
- 6.1 Key trends
- 6.2 Port terminals
- 6.3 Railway terminals
- 6.4 Inland Container Depots (ICDs)
- 6.5 Logistics Hubs
Chapter 7 Market Estimates & Forecast, By Propulsion, 2021 - 2034 ($Bn, Units)
- 7.1 Key trends
- 7.2 Diesel
- 7.3 Electric
- 7.4 Hybrid
Chapter 8 Market Estimates & Forecast, By Capacity, 2021 - 2034 ($Bn, Units)
- 8.1 Key trends
- 8.2 Up to 10 tons
- 8.3 10-50 tons
- 8.4 50 tons and above
Chapter 9 Market Estimates & Forecast, By Region, 2021 - 2034 ($Bn, Units)
- 9.1 Key trends
- 9.2 North America
- 9.2.1 U.S.
- 9.2.2 Canada
- 9.3 Europe
- 9.3.1 UK
- 9.3.2 Germany
- 9.3.3 France
- 9.3.4 Spain
- 9.3.5 Italy
- 9.3.6 Russia
- 9.3.7 Nordics
- 9.4 Asia Pacific
- 9.4.1 China
- 9.4.2 India
- 9.4.3 Japan
- 9.4.4 South Korea
- 9.4.5 ANZ
- 9.4.6 Southeast Asia
- 9.5 Latin America
- 9.5.1 Brazil
- 9.5.2 Mexico
- 9.5.3 Argentina
- 9.6 MEA
- 9.6.1 UAE
- 9.6.2 South Africa
- 9.6.3 Saudi Arabia
Chapter 10 Company Profiles
- 10.1 Konecranes
- 10.2 Cargotec
- 10.3 Liebherr Group
- 10.4 ZPMC (Shanghai Zhenhua Heavy Industries Company)
- 10.5 Terex
- 10.6 Doosan Heavy Industries & Construction
- 10.7 Hyster-Yale Materials Handling
- 10.8 Toyota Industries
- 10.9 Mitsubishi Heavy Industries
- 10.10 SANY Group
- 10.11 Caterpillar Inc.
- 10.12 Hyundai Heavy Industries
- 10.13 Kalmar
- 10.14 Manitowoc Crane Group
- 10.15 STILL GmbH
- 10.16 Jungheinrich AG
- 10.17 Palfinger AG
- 10.18 TMEIC Corporation
- 10.19 Furukawa Electric Co., Ltd.
- 10.20 ABUS Kransysteme GmbH
 單深度伸縮叉市場按負載能力、操作類型、材料類型、最終用途產業、分銷管道和客戶規模分類-全球預測,2026-2032年堆垛機伸縮叉市場:按產品類型、操作類型、承載能力、門架類型、驅動類型、叉長和最終用戶產業分類,全球預測,2026-2032年三段式伸縮叉市場(依最終用戶、應用、材料、通路和叉型分類)-全球預測,2026-2032年紙箱裝卸伸縮叉市場:依終端使用者產業、驅動類型、提升能力、作業半徑與銷售管道分類,全球預測(2026-2032年)
 實心輪胎堆高機市場-2026-2031年預測STS(Ship-to-Shore)貨櫃起重機市場規模、佔有率、成長及全球產業分析:依類型、應用和地區劃分的洞察與未來預測(2026-2034)卡車升降坡道市場按類型、銷售、通路、應用和最終用途分類-2026年至2032年全球預測堆高機貨櫃坡道市場:按產品類型、承載能力、操作類型、最終用戶和分銷管道分類 - 全球預測 2026-2032
 貨櫃裝卸設備市場規模、佔有率、趨勢分析報告:按設備類型、推進類型、起重能力、裝卸模式、最終用途、地區、細分市場預測,2025-2030 年
 貨櫃裝卸設備市場,規模,佔有率,趨勢,產業分析報告:類別,推動類別,釣上來按能力,處理模式別,各最終用途,各地區,2025年~2034年的市場預測