


 |
市場調查報告書
商品編碼
1822639
地工泡沫市場機會、成長動力、產業趨勢分析及 2025 - 2034 年預測Geofoam Market Opportunity, Growth Drivers, Industry Trend Analysis, and Forecast 2025 - 2034 |
||||||
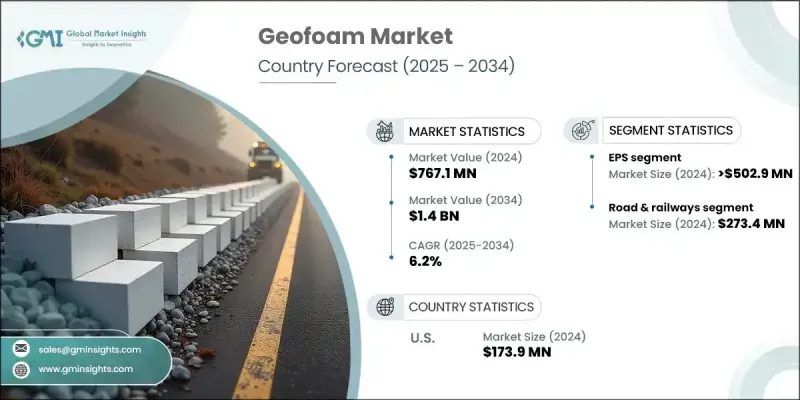
2024年,全球地工泡沫市場規模達7.671億美元,預計2034年將以6.2%的複合年成長率成長,達到14億美元。這一成長主要源於基礎建設對輕質耐用建築材料日益成長的需求。隨著全球都市化進程持續推進,尤其是在發展中經濟體,對地工泡沫等高承載力材料的需求日益成長。地工泡棉的輕質結構不僅簡化了運輸,還降低了結構荷載,使其成為路堤、跑道和邊坡加固等需要土壤穩定處理的項目的首選材料。
地工泡沫能夠顯著降低結構靜載荷,使其成為增強基礎設施耐久性和穩定性的寶貴資產。產業報告顯示,地工泡沫在建築業的使用量穩步上升,尤其是在北美,其使用率在過去五年中持續成長。這一趨勢凸顯了人們日益認知到地工泡沫在為複雜建築需求提供經濟高效的解決方案方面所發揮的作用。
| 市場範圍 | |
|---|---|
| 起始年份 | 2024 |
| 預測年份 | 2025-2034 |
| 起始值 | 7.671億美元 |
| 預測值 | 14億美元 |
| 複合年成長率 | 6.2% |
在各類地工泡棉中,發泡聚苯乙烯 (EPS) 在 2023 年的市佔率為 4.854 億美元,預計到 2032 年將以 6.4% 的複合年成長率成長。 EPS 憑藉其輕質特性、成本效益以及在各種應用中的適應性,將繼續佔據主導地位。其隔熱性能和易塑性使其成為建築專案的多功能選擇,尤其是在擋土牆和道路專案中。與其他替代品相比,EPS 在價格方面具有競爭優勢,這進一步推動了其廣泛應用,尤其是在大型基礎設施項目中。
在分銷方面,2023年直銷通路佔據了泡沫地工布市場的65.6%,預計到2032年將以6.4%的複合年成長率成長。對於需要客製化解決方案的大型項目,直銷通常是首選,這使得製造商能夠與客戶緊密合作,提供量身定做的泡沫地工布產品和服務。這種方法可以確保精準有效率地滿足專案的特定需求,從而提高客戶滿意度和專案成果。
光是美國地工泡沫市場在 2023 年的規模就超過了 1.679 億美元,預計到 2032 年仍將以同樣的速度成長。這種材料的輕質結構和出色的承重能力使其成為關鍵基礎設施項目的理想選擇,從而鞏固了其在整個地區建築行業中的重要性。
目錄
第1章:方法論與範圍
第 2 章:執行摘要
第3章:行業洞察
- 產業生態系統分析
- 供應商格局
- 利潤率
- 每個階段的增值
- 影響價值鏈的因素
- 產業衝擊力
- 成長動力
- 基礎建設不斷推進
- 環境效益和永續性
- 成本和時間效率
- 產業陷阱與挑戰
- 認知和知識有限
- 環境問題和法規
- 機會
- 永續建築的擴張
- 先進地工泡沫材料的開發
- 成長動力
- 成長潛力分析
- 未來市場趨勢
- 技術和創新格局
- 當前的技術趨勢
- 新興技術
- 價格趨勢
- 按地區
- 按類型
- 監管格局
- 標準和合規性要求
- 區域監理框架
- 認證標準
- 波特的分析
- PESTEL分析
第4章:競爭格局
- 介紹
- 公司市佔率分析
- 按地區
- 公司矩陣分析
- 主要市場參與者的競爭分析
- 競爭定位矩陣
- 關鍵進展
- 併購
- 夥伴關係與合作
- 新產品發布
- 擴張計劃
第5章:市場估計與預測:按類型,2021 - 2034
- 主要趨勢
- 每股盈餘
- XPS
第6章:市場估計與預測:按密度,2021 - 2034
- 主要趨勢
- 低的
- 中等的
- 高的
第7章:市場估計與預測:按應用,2021 - 2034
- 主要趨勢
- 空隙填充
- 邊坡穩定
- 堤岸
- 擋土結構
- 絕緣
- 其他
第8章:市場估計與預測:依最終用途,2021 - 2034 年
- 主要趨勢
- 公路和鐵路
- 建築和基礎設施
- 機場基礎設施
- 景觀美化
- 其他
第9章:市場估計與預測:按配銷通路,2021 - 2034 年
- 主要趨勢
- 直接的
- 間接
第 10 章:市場估計與預測:按地區,2021 年至 2034 年
- 主要趨勢
- 北美洲
- 美國
- 加拿大
- 歐洲
- 德國
- 英國
- 法國
- 義大利
- 西班牙
- 亞太地區
- 中國
- 日本
- 印度
- 澳洲
- 韓國
- 拉丁美洲
- 巴西
- 墨西哥
- 阿根廷
- 中東和非洲
- 南非
- 沙烏地阿拉伯
- 阿拉伯聯合大公國
第 11 章:公司簡介
- Alleguard
- Atlas Molded Products
- Beaver Plastics
- Benchmark Foam
- Carlisle Companies
- Cellofoam北美公司
- EXPOL
- Galaxy Polystyrene LLC
- Geofoam America
- Geofoam International LLC
- Legerlite
- Pacific Allied Products Ltd
- Technopol SA
- ThermaFoam, LLC
- Universal Construction Foam
The global geofoam market was valued at USD 767.1 million in 2024 and is estimated to grow at a CAGR of 6.2% to reach USD 1.4 billion by 2034. This growth is largely driven by the rising demand for lightweight and durable construction materials in infrastructure development. As urbanization continues to surge globally, particularly in developing economies, the need for high-load-bearing materials like geofoam is becoming increasingly critical. Its lightweight composition not only simplifies transportation but also reduces structural loads, making it a preferred material for projects requiring soil stabilization, such as embankments, runways, and slope reinforcement.
Geofoam's ability to significantly lower dead loads on structures makes it a valuable asset in enhancing the durability and stability of infrastructure. Industry reports indicate a steady rise in geofoam usage in construction, particularly in North America, where adoption rates have consistently grown over the past five years. This trend highlights the growing recognition of geofoam's role in delivering cost-effective and efficient solutions for complex construction needs.
| Market Scope | |
|---|---|
| Start Year | 2024 |
| Forecast Year | 2025-2034 |
| Start Value | $767.1 million |
| Forecast Value | $1.4 billion |
| CAGR | 6.2% |
Among the various types of geofoam, Expanded Polystyrene (EPS) held a market share valued at USD 485.4 million in 2023 and is expected to expand at a 6.4% CAGR through 2032. EPS continues to dominate due to its lightweight properties, cost efficiency, and adaptability across a range of applications. Its thermal insulation capabilities and ease of shaping make it a versatile choice for construction projects, particularly those involving retaining walls and roadways. Compared to other alternatives, EPS offers a competitive advantage in pricing, which further fuels its widespread use, especially in large-scale infrastructure initiatives.
In terms of distribution, the direct sales channel accounted for 65.6% of the geofoam market in 2023 and is anticipated to grow at a 6.4% CAGR through 2032. Direct distribution is often preferred for large projects that require customized solutions, allowing manufacturers to closely collaborate with clients and provide tailored geofoam products and services. This approach ensures that project-specific requirements are met with precision and efficiency, enhancing customer satisfaction and project outcomes.
The U.S. geofoam market alone surpassed USD 167.9 million in 2023 and is expected to grow at a similar pace through 2032. The material's lightweight structure and impressive load-bearing capabilities make it an ideal choice for critical infrastructure projects, reinforcing its importance in the construction industry across the region.
Table of Contents
Chapter 1 Methodology and Scope
- 1.1 Market scope and definition
- 1.2 Research design
- 1.2.1 Research approach
- 1.2.2 Data collection methods
- 1.3 Data mining sources
- 1.3.1 Global
- 1.3.2 Regional/Country
- 1.4 Base estimates and calculations
- 1.4.1 Base year calculation
- 1.4.2 Key trends for market estimation
- 1.5 Primary research and validation
- 1.5.1 Primary sources
- 1.6 Forecast model
- 1.7 Research assumptions and limitations
Chapter 2 Executive Summary
- 2.1 Industry 3600 synopsis
- 2.2 Key market trends
- 2.2.1 Regional
- 2.2.2 Type
- 2.2.3 Density
- 2.2.4 Application
- 2.2.5 End use
- 2.2.6 Distribution channel
- 2.3 CXO perspectives: Strategic imperatives
- 2.3.1 Key decision points for industry executives
- 2.3.2 Critical success factors for market players
- 2.4 Future outlook and strategic recommendations
Chapter 3 Industry Insights
- 3.1 Industry ecosystem analysis
- 3.1.1 Supplier landscape
- 3.1.2 Profit margin
- 3.1.3 Value addition at each stage
- 3.1.4 Factor affecting the value chain
- 3.2 Industry impact forces
- 3.2.1 Growth drivers
- 3.2.1.1 Growing infrastructure development
- 3.2.1.2 Environmental benefits and sustainability
- 3.2.1.3 Cost and time efficiency
- 3.2.2 Industry pitfalls & challenges
- 3.2.2.1 Limited awareness and knowledge
- 3.2.2.2 Environmental concerns and regulations
- 3.2.3 Opportunities
- 3.2.3.1 Expansion in sustainable construction
- 3.2.3.2 Development of advanced geofoam materials
- 3.2.1 Growth drivers
- 3.3 Growth potential analysis
- 3.4 Future market trends
- 3.5 Technology and innovation landscape
- 3.5.1 Current technological trends
- 3.5.2 Emerging technologies
- 3.6 Price trends
- 3.6.1 By region
- 3.6.2 By type
- 3.7 Regulatory landscape
- 3.7.1 Standards and compliance requirements
- 3.7.2 Regional regulatory frameworks
- 3.7.3 Certification standards
- 3.8 Porter's analysis
- 3.9 PESTEL analysis
Chapter 4 Competitive Landscape, 2024
- 4.1 Introduction
- 4.2 Company market share analysis
- 4.2.1 By region
- 4.2.1.1 North America
- 4.2.1.2 Europe
- 4.2.1.3 Asia Pacific
- 4.2.1.4 Latin America
- 4.2.1.5 Middle East and Africa
- 4.2.1 By region
- 4.3 Company matrix analysis
- 4.4 Competitive analysis of major market players
- 4.5 Competitive positioning matrix
- 4.6 Key developments
- 4.6.1 Mergers & acquisitions
- 4.6.2 Partnerships & collaborations
- 4.6.3 New product launches
- 4.6.4 Expansion plans
Chapter 5 Market Estimates and Forecast, By Type, 2021 - 2034 (USD Million) (Thousand Square Meters)
- 5.1 Key trends
- 5.2 EPS
- 5.3 XPS
Chapter 6 Market Estimates and Forecast, By Density, 2021 - 2034 (USD Million) (Thousand Square Meters)
- 6.1 Key trends
- 6.2 Low
- 6.3 Medium
- 6.4 High
Chapter 7 Market Estimates and Forecast, By Application, 2021 - 2034 (USD Million) (Thousand Square Meters)
- 7.1 Key trends
- 7.2 Void fill
- 7.3 Slope stabilization
- 7.4 Embankments
- 7.5 Retaining structures
- 7.6 Insulation
- 7.7 Others
Chapter 8 Market Estimates and Forecast, By End Use, 2021 - 2034 (USD Million) (Thousand Square Meters)
- 8.1 Key trends
- 8.2 Road & railways
- 8.3 Building & infrastructure
- 8.4 Airport infrastructure
- 8.5 Landscaping
- 8.6 Others
Chapter 9 Market Estimates and Forecast, By Distribution Channel, 2021 - 2034 (USD Million) (Thousand Square Meters)
- 9.1 Key trends
- 9.2 Direct
- 9.3 Indirect
Chapter 10 Market Estimates and Forecast, By Region, 2021 - 2034 (USD Million) (Thousand Square Meters)
- 10.1 Key trends
- 10.2 North America
- 10.2.1 U.S.
- 10.2.2 Canada
- 10.3 Europe
- 10.3.1 Germany
- 10.3.2 UK
- 10.3.3 France
- 10.3.4 Italy
- 10.3.5 Spain
- 10.4 Asia Pacific
- 10.4.1 China
- 10.4.2 Japan
- 10.4.3 India
- 10.4.4 Australia
- 10.4.5 South Korea
- 10.5 Latin America
- 10.5.1 Brazil
- 10.5.2 Mexico
- 10.5.3 Argentina
- 10.6 Middle East and Africa
- 10.6.1 South Africa
- 10.6.2 Saudi Arabia
- 10.6.3 UAE
Chapter 11 Company Profiles
- 11.1 Alleguard
- 11.2 Atlas Molded Products
- 11.3 Beaver Plastics
- 11.4 Benchmark Foam
- 11.5 Carlisle Companies
- 11.6 Cellofoam North America Inc
- 11.7 EXPOL
- 11.8 Galaxy Polystyrene LLC
- 11.9 Geofoam America
- 11.10 Geofoam International LLC
- 11.11 Legerlite
- 11.12 Pacific Allied Products Ltd
- 11.13 Technopol SA
- 11.14 ThermaFoam, LLC
- 11.15 Universal Construction Foam
 地工磚市場按產品類型、最終用戶、分銷管道和應用分類-全球預測,2025-2032年
 全球地工泡沫市場研究報告 - 產業分析、規模、佔有率、成長、趨勢及 2025 年至 2033 年預測
 地工磚:市場佔有率分析、行業趨勢、統計數據和成長預測(2025-2030 年)
 地工磚市場規模、佔有率和成長分析(按類型、最終用途、應用和地區)- 產業預測 2025-2032
 全球地工磚市場,2024-2028
 到 2030 年地工磚市場預測:按類型、應用、最終用戶和地區分類的全球分析
 地工泡沫市場,依地工泡沫類型、密度、應用、國家和地區分類 - 2024-2032 年行業分析、市場規模、市場佔有率和預測