


 |
市場調查報告書
商品編碼
1666555
蒸汽甲烷重整氫氣市場機會、成長動力、產業趨勢分析及 2025 - 2034 年預測Steam Methane Reforming Hydrogen Generation Market Opportunity, Growth Drivers, Industry Trend Analysis, and Forecast 2025 - 2034 |
||||||
2024 年全球蒸汽甲烷重整氫氣市場規模將達到 1,464 億美元,預計 2025 年至 2034 年期間的複合年成長率為 6.2%。 SMR 技術涉及用蒸汽和催化劑加熱天然氣中的甲烷,以產生一氧化碳和氫氣的混合物,廣泛用於有機合成和能源應用。
發展中經濟體原油消費量的增加以及煉油基礎設施的投資為氫氣生產商創造了巨大的機會。促進採用清潔燃料的政策和對煉油的大量投資正在改變產業格局。旨在降低汽油和柴油等燃料中硫含量的監管框架和激勵計劃正在推動對 SMR 氫氣生成技術的需求。
| 市場範圍 | |
|---|---|
| 起始年份 | 2024 |
| 預測年份 | 2025-2034 |
| 起始值 | 1464億美元 |
| 預測值 | 2840億美元 |
| 複合年成長率 | 6.2% |
依應用,市場分為發電、石油精煉、化學運輸、工業能源等。預計到 2034 年,交通運輸業將創收 115 億美元。主要產業參與者正致力於擴大氫基礎設施並推動其在汽車中的應用。獲得廉價電力、再生能源整合和水力資源等因素預計將加強氫氣在能源貿易中的作用,並在歐洲和亞洲市場帶來巨大的成長機會。
預計到 2034 年,美國蒸汽甲烷重整氫氣市場規模將達到 245 億美元。氫氣擴大被用於能源存儲,利用豐富的可再生資源和自然資源進行具有成本效益的生產。此外,專注於綠色氫能研究和開發的國際合作預計將進一步促進市場擴張。
旨在提高氫氣生產過程的效率和永續性的技術進步進一步支持了市場的成長。隨著世界各國政府和產業優先考慮碳中和能源解決方案,蒸汽甲烷重整在滿足全球氫氣需求方面繼續發揮關鍵作用。它的可擴展性、成本效益以及與當前基礎設施的兼容性使其成為不斷發展的氫經濟的基石。
目錄
第 1 章:方法論與範圍
- 研究設計
- 基礎估算與計算
- 預測模型
- 初步研究與驗證
- 主要來源
- 資料探勘來源
- 市場定義
第 2 章:執行摘要
第 3 章:產業洞察
- 產業生態系統
- 監管格局
- 產業衝擊力
- 成長動力
- 產業陷阱與挑戰
- 成長潛力分析
- 波特的分析
- 供應商的議價能力
- 買家的議價能力
- 新進入者的威脅
- 替代品的威脅
- PESTEL 分析
第4章:競爭格局
- 介紹
- 戰略儀表板
- 創新與技術格局
第 5 章:市場規模與預測:按應用,2021 – 2034 年
- 主要趨勢
- 石油精煉
- 化學
- 運輸
- 發電
- 工業能源
- 其他
第6章:市場規模及預測:按地區,2021 – 2034 年
- 主要趨勢
- 北美洲
- 美國
- 加拿大
- 墨西哥
- 歐洲
- 德國
- 英國
- 法國
- 義大利
- 荷蘭
- 俄羅斯
- 亞太地區
- 中國
- 日本
- 印度
- 中東和非洲
- 沙烏地阿拉伯
- 伊朗
- 阿拉伯聯合大公國
- 南非
- 拉丁美洲
- 巴西
- 阿根廷
- 智利
第7章:公司簡介
- ALLY HI-TECH CO., LTD.
- Air Liquide
- Air Products & Chemicals, Inc.
- CALORIC
- HyGear
- HyGear
- Linde plc
- Mahler AGS GmbH
- Messer
- NUVERA FUEL CELLS, LLC
- Plug Power Inc.
- TAIYYON NIPPON SANSO CORPORATION
- Topsoe
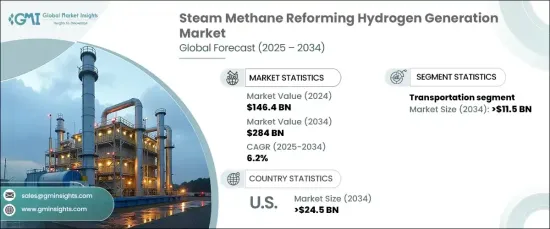
The Global Steam Methane Reforming Hydrogen Generation Market reached USD 146.4 billion in 2024 and is projected to grow at a CAGR of 6.2% between 2025 -2034. SMR technology involves heating methane from natural gas with steam and a catalyst to produce a mixture of carbon monoxide and hydrogen widely used in organic synthesis and energy applications.
Rising crude oil consumption in developing economies and investments in refining infrastructure are creating substantial opportunities for hydrogen producers. Policies promoting cleaner fuel adoption and significant investments in refining are transforming the industry landscape. Regulatory frameworks and incentive programs aimed at reducing sulfur content in fuels, such as gasoline and diesel, are driving the demand for SMR hydrogen generation technologies.
| Market Scope | |
|---|---|
| Start Year | 2024 |
| Forecast Year | 2025-2034 |
| Start Value | $146.4 Billion |
| Forecast Value | $284 Billion |
| CAGR | 6.2% |
The market is segmented by application into power generation, petroleum refining, chemical transportation, industrial energy, and others. The transportation sector is expected to generate USD 11.5 billion through 2034. Growing efforts to decarbonize transportation have led to the development of hydrogen-powered technologies. Major industry players are focusing on expanding hydrogen infrastructure and promoting its adoption in vehicles. Factors such as access to affordable electricity, renewable energy integration, and hydro resources are expected to strengthen hydrogen's role in energy trade, with significant growth opportunities in European and Asian markets.
United States steam methane reforming hydrogen generation market is projected to reach USD 24.5 billion by 2034. The robust outlook for the refining industry, coupled with government initiatives to establish new industrial facilities in sectors like chemicals, automotive, and power, is anticipated to drive product demand. Hydrogen is increasingly being utilized for energy storage, leveraging cost-effective production from abundant renewable and natural resources. Additionally, international collaborations focusing on green hydrogen research and development are expected to further bolster market expansion.
The market growth is further supported by technological advancement aimed at improving the efficiency and sustainability of hydrogen production processes. As governments and industries worldwide prioritize carbon-neutral energy solutions, steam methane reforming continues to play a pivotal role in meeting global hydrogen demand. Its scalability, cost-efficiency, and compatibility with current infrastructure make it a cornerstone of the evolving hydrogen economy.
Table of Contents
Chapter 1 Methodology & Scope
- 1.1 Research Design
- 1.2 Base estimates & calculations
- 1.3 Forecast model
- 1.4 Primary research & validation
- 1.4.1 Primary sources
- 1.4.2 Data mining sources
- 1.5 Market Definitions
Chapter 2 Executive Summary
- 2.1 Industry synopsis, 2021 – 2034
Chapter 3 Industry Insights
- 3.1 Industry ecosystem
- 3.2 Regulatory landscape
- 3.3 Industry impact forces
- 3.3.1 Growth drivers
- 3.3.2 Industry pitfalls & challenges
- 3.4 Growth potential analysis
- 3.5 Porter's analysis
- 3.5.1 Bargaining power of suppliers
- 3.5.2 Bargaining power of buyers
- 3.5.3 Threat of new entrants
- 3.5.4 Threat of substitutes
- 3.6 PESTEL analysis
Chapter 4 Competitive landscape, 2024
- 4.1 Introduction
- 4.2 Strategic dashboard
- 4.3 Innovation & technology landscape
Chapter 5 Market Size and Forecast, By Application, 2021 – 2034 (USD Billion)
- 5.1 Key trends
- 5.2 Petroleum refining
- 5.3 Chemical
- 5.4 Transportation
- 5.5 Power generation
- 5.6 Industry energy
- 5.7 Others
Chapter 6 Market Size and Forecast, By Region, 2021 – 2034 (USD Billion)
- 6.1 Key trends
- 6.2 North America
- 6.2.1 U.S.
- 6.2.2 Canada
- 6.2.3 Mexico
- 6.3 Europe
- 6.3.1 Germany
- 6.3.2 UK
- 6.3.3 France
- 6.3.4 Italy
- 6.3.5 Netherlands
- 6.3.6 Russia
- 6.4 Asia Pacific
- 6.4.1 China
- 6.4.2 Japan
- 6.4.3 India
- 6.5 Middle East & Africa
- 6.5.1 Saudi Arabia
- 6.5.2 Iran
- 6.5.3 UAE
- 6.5.4 South Africa
- 6.6 Latin America
- 6.6.1 Brazil
- 6.6.2 Argentina
- 6.6.3 Chile
Chapter 7 Company Profiles
- 7.1 ALLY HI-TECH CO., LTD.
- 7.2 Air Liquide
- 7.3 Air Products & Chemicals, Inc.
- 7.4 CALORIC
- 7.5 HyGear
- 7.6 HyGear
- 7.7 Linde plc
- 7.8 Mahler AGS GmbH
- 7.9 Messer
- 7.10 NUVERA FUEL CELLS, LLC
- 7.11 Plug Power Inc.
- 7.12 TAIYYON NIPPON SANSO CORPORATION
- 7.13 Topsoe
 全球氫氣生產市場-產業規模、佔有率、趨勢、機會及預測(依來源、技術(蒸汽甲烷重整、煤氣化及其他)、應用、區域及競爭格局分類,2020-2030年預測)
 蒸汽甲烷重整市場規模、佔有率和成長分析(按原料、轉化技術、終端用戶產業、營運規模和地區分類)-產業預測,2025-2032年
 PSA氫氣精煉:全球市佔率及排名、總收入及需求預測(2025-2031年)
 2025 年至 2033 年氫氣生產市場規模、佔有率、趨勢及預測(按技術、應用、系統類型和地區)
 2025-2030 年全球氫氣生產市場預測(按類型、生產方法、來源、產品、應用和最終用戶產業分類)光催化氫氣發生器市場(按產品類型、組件、光源和應用)—2025-2030 年全球預測
 全球專屬式化學氫氣市場全球煉油廠氫氣生產市場全球電解專屬式市場全球電解商用氫氣產生器市場