


 |
市場調查報告書
商品編碼
1666562
單軸太陽能追蹤器市場機會、成長動力、產業趨勢分析及 2025 - 2034 年預測Single Axis Solar Tracker Market Opportunity, Growth Drivers, Industry Trend Analysis, and Forecast 2025 - 2034 |
||||||
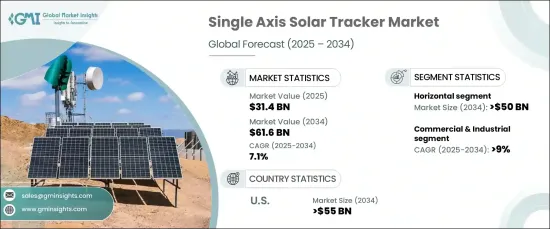
2024 年全球單軸太陽能追蹤器市場價值為 314 億美元,預計 2025 年至 2034 年期間的複合年成長率為 7.1%。單軸太陽追蹤器是一種機械系統,用於調整太陽能電池板的方向,確保它們全天跟隨太陽的路徑。這種動態調整透過最佳化面板定位和提高能量輸出來提高太陽能裝置的效率,使太陽能發電更加可靠。
隨著全球能源需求的成長,對太陽能解決方案的需求也正在加速成長。亞太、中東和非洲等地區由於對再生能源的需求不斷增加而經歷快速成長。政府的激勵措施和適合大規模太陽能發電場使用的充足土地進一步推動了太陽能發電計畫的擴張。此外,將單軸追蹤器與儲能系統結合正變得越來越流行。這種組合使太陽能發電廠能夠儲存白天產生的剩餘能源,並在能源需求高時供應,從而解決太陽能發電的間歇性問題。這些創新可能會塑造太陽能追蹤器市場的未來。
| 市場範圍 | |
|---|---|
| 起始年份 | 2024 |
| 預測年份 | 2025-2034 |
| 起始值 | 314億美元 |
| 預測值 | 616億美元 |
| 複合年成長率 | 7.1% |
在政府支持、法規和研究經費的推動下,清潔能源投資不斷成長,市場也受益良多。這些努力旨在促進先進太陽能技術的發展,包括太陽能追蹤器。隨著越來越多的研究集中在提高這些設備的功能和效率上,市場預計將繼續呈上升趨勢。
單軸太陽能追蹤器主要有兩種類型:水平和垂直。由於水平追蹤器廣泛應用於大規模能源生產,預計到 2034 年其市場規模將超過 500 億美元。隨著環保意識的增強,減少碳排放的壓力也越來越大。太陽能在這一轉變中發揮關鍵作用,為清潔發電提供了永續的解決方案。先進軟體和人工智慧的融合進一步增強了水平追蹤器的性能,最佳化了其方向並提高了能量產生。
在應用方面,商業和工業領域預計將出現最顯著的成長,到 2034 年複合年成長率將超過 9%。尤其是商業領域對更具成本效益和可靠性的太陽能發電系統的需求,進一步加速了單軸追蹤器的採用。
在美國,單軸太陽能追蹤器市場規模預計到 2034 年將超過 550 億美元。這些追蹤器不僅可以提高能源產量,還可以獲得額外的激勵,從而對消費者和企業都更具吸引力。隨著政府政策和補貼繼續支持再生能源的應用,美國單軸太陽能追蹤器市場將迎來強勁成長。
目錄
第 1 章:方法論與範圍
- 市場定義
- 基礎估算與計算
- 預測計算
- 初步研究與驗證
- 主要來源
- 資料探勘來源
- 市場定義
第 2 章:執行摘要
第 3 章:產業洞察
- 產業生態系統
- 監管格局
- 產業衝擊力
- 成長動力
- 產業陷阱與挑戰
- 成長潛力分析
- 波特的分析
- 供應商的議價能力
- 買家的議價能力
- 新進入者的威脅
- 替代品的威脅
- PESTEL 分析
第4章:競爭格局
- 介紹
- 戰略儀表板
- 創新與永續發展格局
第 5 章:市場規模及預測:依產品,2021 – 2034 年
- 主要趨勢
- 水平的
- 垂直的
第 6 章:市場規模與預測:按應用,2021 – 2034 年
- 主要趨勢
- 住宅
- 商業和工業
- 公用事業
第 7 章:市場規模及預測:按地區,2021 – 2034 年
- 主要趨勢
- 北美洲
- 美國
- 加拿大
- 墨西哥
- 歐洲
- 英國
- 法國
- 荷蘭
- 德國
- 瑞典
- 西班牙
- 奧地利
- 亞太地區
- 中國
- 澳洲
- 印度
- 日本
- 韓國
- 中東
- 沙烏地阿拉伯
- 阿拉伯聯合大公國
- 約旦
- 以色列
- 非洲
- 南非
- 埃及
- 阿爾及利亞
- 奈及利亞
- 摩洛哥
- 拉丁美洲
- 巴西
- 智利
第8章:公司簡介
- Abengoa
- ArcelorMittal
- Arctech
- Array Technologies, Inc.
- DEGERENERGIE GMBH & CO. KG
- GameChange Solar
- Gonvarri Solar Steel
- Haosolar Co. Ltd
- IDEEMATEC
- MECASOLAR
- NCLAVE
- Nextracker Inc.
- Powerway Renewable Energy Co., Ltd
- PVHardware
- Scorpius Trackers
- SmartTrak Solar Systems (Pvt) Ltd.
- SOLTEC
- STI Norland
- SunPower Corporation
- Trina Solar
- Valmont Industries, Inc.
The Global Single Axis Solar Tracker Market, valued at USD 31.4 Billion in 2024, is projected to expand at a CAGR of 7.1% from 2025 to 2034. The market is driven by the rising demand for solar energy and the adoption of advanced technologies. Single-axis solar trackers are mechanical systems designed to adjust the orientation of solar panels, ensuring they follow the sun's path throughout the day. This dynamic adjustment increases the efficiency of solar installations by optimizing panel positioning and enhancing energy output, making solar power generation more reliable.
As energy needs grow globally, the demand for solar solutions is also accelerating. Regions such as Asia-Pacific, the Middle East, and Africa are experiencing rapid growth due to the increasing need for renewable energy sources. Government incentives and abundant land for large-scale solar farms are further fueling the expansion of solar power projects. Moreover, integrating single-axis trackers with energy storage systems is becoming increasingly popular. This combination allows solar plants to store surplus energy produced during the day and supply it when energy demand is high, addressing the intermittent nature of solar power. Such innovations are likely to shape the future of the solar tracker market.
| Market Scope | |
|---|---|
| Start Year | 2024 |
| Forecast Year | 2025-2034 |
| Start Value | $31.4 Billion |
| Forecast Value | $61.6 Billion |
| CAGR | 7.1% |
The market is also benefiting from the growing investments in clean energy, which are spurred by governmental support, regulations, and research funding. These efforts are designed to encourage the development of advanced solar technologies, including solar trackers. As more research is focused on improving the functionality and efficiency of these devices, the market is expected to continue its upward trajectory.
Single-axis solar trackers are available in two main types: horizontal and vertical. Horizontal trackers are anticipated to surpass USD 50 Billion by 2034, owing to their widespread adoption for large-scale energy production. As environmental awareness rises, there is increasing pressure to reduce carbon emissions. Solar energy plays a pivotal role in this transition, offering a sustainable solution for clean power generation. The integration of advanced software and artificial intelligence further enhances the performance of horizontal trackers, optimizing their orientation and increasing energy generation.
In terms of application, the commercial and industrial sector is expected to see the most significant growth, with a CAGR exceeding 9% by 2034. The advancements in solar tracker technology, along with improvements in cost efficiency, make these solutions more accessible to a broader range of businesses. The commercial sector, in particular, is driving demand for more cost-effective and reliable solar power systems, further accelerating the adoption of single-axis trackers.
In the U.S., the single-axis solar tracker market is projected to exceed USD 55 Billion by 2034. The region's challenging weather conditions and the growing demand for renewable energy are pushing the need for more advanced solar trackers. These trackers not only enhance energy production but also qualify for additional incentives, making them more attractive to consumers and businesses alike. As government policies and subsidies continue to favor renewable energy adoption, the market for single-axis solar trackers in the U.S. is poised for robust growth.
Table of Contents
Chapter 1 Methodology & Scope
- 1.1 Market definitions
- 1.2 Base estimates & calculations
- 1.3 Forecast calculation
- 1.4 Primary research & validation
- 1.4.1 Primary sources
- 1.4.2 Data mining sources
- 1.5 Market Definitions
Chapter 2 Executive Summary
- 2.1 Industry synopsis, 2021 – 2034
Chapter 3 Industry Insights
- 3.1 Industry ecosystem
- 3.2 Regulatory landscape
- 3.3 Industry impact forces
- 3.3.1 Growth drivers
- 3.3.2 Industry pitfalls & challenges
- 3.4 Growth potential analysis
- 3.5 Porter's analysis
- 3.5.1 Bargaining power of suppliers
- 3.5.2 Bargaining power of buyers
- 3.5.3 Threat of new entrants
- 3.5.4 Threat of substitutes
- 3.6 PESTEL analysis
Chapter 4 Competitive landscape, 2024
- 4.1 Introduction
- 4.2 Strategic dashboard
- 4.3 Innovation & sustainability landscape
Chapter 5 Market Size and Forecast, By Product, 2021 – 2034 (USD Million & MW)
- 5.1 Key trends
- 5.2 Horizontal
- 5.3 Vertical
Chapter 6 Market Size and Forecast, By Application, 2021 – 2034 (USD Million & MW)
- 6.1 Key trends
- 6.2 Residential
- 6.3 Commercial & Industrial
- 6.4 Utility
Chapter 7 Market Size and Forecast, By Region, 2021 – 2034 (USD Million & MW)
- 7.1 Key trends
- 7.2 North America
- 7.2.1 U.S.
- 7.2.2 Canada
- 7.2.3 Mexico
- 7.3 Europe
- 7.3.1 UK
- 7.3.2 France
- 7.3.3 Netherlands
- 7.3.4 Germany
- 7.3.5 Sweden
- 7.3.6 Spain
- 7.3.7 Austria
- 7.4 Asia Pacific
- 7.4.1 China
- 7.4.2 Australia
- 7.4.3 India
- 7.4.4 Japan
- 7.4.5 South Korea
- 7.5 Middle East
- 7.5.1 Saudi Arabia
- 7.5.2 UAE
- 7.5.3 Jordan
- 7.5.4 Israel
- 7.6 Africa
- 7.6.1 South Africa
- 7.6.2 Egypt
- 7.6.3 Algeria
- 7.6.4 Nigeria
- 7.6.5 Morocco
- 7.7 Latin America
- 7.7.1 Brazil
- 7.7.2 Chile
Chapter 8 Company Profiles
- 8.1 Abengoa
- 8.2 ArcelorMittal
- 8.3 Arctech
- 8.4 Array Technologies, Inc.
- 8.5 DEGERENERGIE GMBH & CO. KG
- 8.6 GameChange Solar
- 8.7 Gonvarri Solar Steel
- 8.8 Haosolar Co. Ltd
- 8.9 IDEEMATEC
- 8.10 MECASOLAR
- 8.11 NCLAVE
- 8.12 Nextracker Inc.
- 8.13 Powerway Renewable Energy Co., Ltd
- 8.14 PVHardware
- 8.15 Scorpius Trackers
- 8.16 SmartTrak Solar Systems (Pvt) Ltd.
- 8.17 SOLTEC
- 8.18 STI Norland
- 8.19 SunPower Corporation
- 8.20 Trina Solar
- 8.21 Valmont Industries, Inc.
 太陽能追蹤器-市場佔有率分析、產業趨勢與統計、成長預測(2025-2030)太陽能追蹤器的全球市場的評估:各類型,各技術,各用途,各地區,機會,預測(2018年~2032年)太陽能追蹤器的印度市場評估:各類型,各技術,各用途,各地區,機會,預測(2018年度~2032年度)
 公用事業太陽能追蹤器市場機會、成長動力、產業趨勢分析及 2025 - 2034 年預測
 2025年雙軸太陽能追蹤器全球市場報告
 全球太陽能追蹤器市場研究報告 - 產業分析、規模、佔有率、成長、趨勢和預測 2025 年至 2033 年太陽能追蹤器市場機會、成長動力、產業趨勢分析及 2025-2034 年預測2025 年太陽能追蹤器全球市場報告2025 年發電用太陽能追蹤器全球市場報告
 太陽能追蹤器市場、規模、佔有率、趨勢、行業分析報告(依類型、應用和地區)- 市場預測,2025-2034年