


 |
市場調查報告書
商品編碼
1666895
冷卻儀表市場機會、成長動力、產業趨勢分析與 2025 - 2034 年預測Cooling Meters Market Opportunity, Growth Drivers, Industry Trend Analysis, and Forecast 2025 - 2034 |
||||||
2024 年全球冷卻儀表市場價值為 13 億美元,預計 2025 年至 2034 年期間將以 6% 的複合年成長率穩步成長。
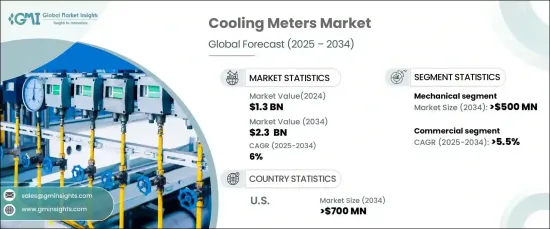
這些設備有助於最佳化冷卻效率和能源管理,使得它們在注重節能的產業和建築中變得越來越不可或缺。隨著能源成本上升和環境問題加劇,對節能系統的需求不斷成長,冷卻計正成為永續發展的重要組成部分。此外,科技的不斷創新不斷增強這些設備的功能和吸引力,進一步推動其在各個領域的應用。人們對氣候變遷的認知不斷提高,以及旨在減少能源消耗的更嚴格的法規也促進了市場的擴張。
| 市場範圍 | |
|---|---|
| 起始年份 | 2024 |
| 預測年份 | 2025-2034 |
| 起始值 | 13億美元 |
| 預測值 | 23億美元 |
| 複合年成長率 | 6% |
根據技術,市場分為機械冷卻計和靜態冷卻計。預計到 2034 年,機械部分將創收 5 億美元。這些儀表在不需要先進智慧技術的環境中特別受歡迎。它們被廣泛應用於那些尋求LEED等綠色認證的住宅和商業建築中,這進一步增強了它們的市場需求。
當考慮應用時,冷卻表市場分為住宅、商業和工業領域。預計到 2034 年,商業部門的複合年成長率將達到 5.5%。冷卻計在這些空間中的應用越來越多,以幫助最佳化能源使用,特別是當公司尋求永續的解決方案來減輕能源密集型冷卻系統對環境的影響時。
在美國,冷卻表市場預計到 2034 年將創收 7 億美元。企業和消費者對能源最佳化和成本節約潛力的認知不斷增強,這也推動了市場擴張。隨著這些市場趨勢和發展,冷卻儀表將在未來幾年繼續在最佳化冷卻能耗方面發揮關鍵作用。
目錄
第 1 章:方法論與範圍
- 研究設計
- 基礎估算與計算
- 預測模型
- 初步研究與驗證
- 主要來源
- 資料探勘來源
- 市場定義
第 2 章:執行摘要
第 3 章:產業洞察
- 產業生態系統
- 監管格局
- 產業衝擊力
- 成長動力
- 產業陷阱與挑戰
- 成長潛力分析
- 波特的分析
- 供應商的議價能力
- 買家的議價能力
- 新進入者的威脅
- 替代品的威脅
- PESTEL 分析
第4章:競爭格局
- 介紹
- 戰略儀表板
- 創新與技術格局
第 5 章:市場規模及預測:依產品,2021 – 2034 年
- 主要趨勢
- 超音波
- 渦流
- 其他
第6章:市場規模及預測:依技術,2021 – 2034 年
- 主要趨勢
- 機械的
- 靜止的
第 7 章:市場規模與預測:按應用,2021 – 2034 年
- 主要趨勢
- 住宅
- 商業的
- 學院/大學
- 辦公大樓
- 政府大樓
- 其他
- 工業的
第 8 章:市場規模與預測:按地區,2021 – 2034 年
- 主要趨勢
- 北美洲
- 美國
- 加拿大
- 歐洲
- 德國
- 波蘭
- 瑞典
- 義大利
- 法國
- 亞太地區
- 中國
- 日本
- 韓國
- 新加坡
- 印度
- 中東
- 沙烏地阿拉伯
- 阿拉伯聯合大公國
- 卡達
- 阿曼
- 科威特
第9章:公司簡介
- Axioma Metering
- Danfoss
- Diehl Stiftung & Co. KG
- Honeywell International Inc.
- Integra
- Itron Inc.
- ista Energy Solutions Limited
- Kamstrup
- Landis+Gyr
- RB Flowmeter
- Schneider Electric
- Secure Meters Ltd.
- Siemens
- Smartdhome Srl
- Sontex SA
- Xylem
- ZENNER International GmbH & Co. KG
The Global Cooling Meters Market was valued at USD 1.3 billion in 2024 and is projected to grow at a steady CAGR of 6% from 2025 to 2034. Cooling meters, crucial devices used to measure cooling energy consumption or cooling rates in systems like air conditioning, refrigeration, and district cooling networks, play a vital role in monitoring parameters such as temperature, flow rate, and energy usage.
These devices help optimize cooling efficiency and energy management, making them increasingly indispensable in energy-conscious industries and buildings. As the demand for energy-efficient systems grows, driven by rising energy costs and environmental concerns, cooling meters are becoming an essential part of sustainability efforts. Additionally, ongoing innovations in technology continue to enhance the functionality and appeal of these devices, further driving their adoption across various sectors. Increasing awareness about climate change, along with more stringent regulations aimed at reducing energy consumption, also contributes to the market's expansion.
| Market Scope | |
|---|---|
| Start Year | 2024 |
| Forecast Year | 2025-2034 |
| Start Value | $1.3 Billion |
| Forecast Value | $2.3 Billion |
| CAGR | 6% |
The market is divided into mechanical and static cooling meters based on technology. The mechanical segment is expected to generate USD 500 million by 2034. This growth can be attributed to the efficient, cost-effective, and reliable design of mechanical cooling meters, which directly measure the flow of chilled water and temperature differences. These meters are particularly popular in settings where advanced smart technologies are not necessary. They are widely adopted in residential and commercial buildings that aim for green certifications, such as LEED, which further strengthens their market demand.
When considering applications, the cooling meters market is segmented into residential, commercial, and industrial sectors. The commercial sector is projected to grow at a CAGR of 5.5% through 2034. As businesses and commercial spaces look for ways to improve energy efficiency and reduce operational costs, the demand for cooling meters in offices, malls, and hotels continues to rise. Cooling meters are increasingly used in these spaces to help optimize energy usage, especially as companies look for sustainable solutions to mitigate the environmental impact of energy-intensive cooling systems.
In the U.S., the cooling meters market is expected to generate USD 700 million by 2034. This growth is supported by government incentives and initiatives promoting sustainable building practices, such as the adoption of advanced building codes aimed at addressing climate change. The increasing awareness among businesses and consumers about energy optimization and the potential for cost savings is also driving market expansion. With these market trends and developments, cooling meters are poised to continue playing a crucial role in optimizing cooling energy consumption in the years ahead.
Table of Contents
Chapter 1 Methodology & Scope
- 1.1 Research design
- 1.2 Base estimates & calculations
- 1.3 Forecast model
- 1.4 Primary research & validation
- 1.4.1 Primary sources
- 1.4.2 Data mining sources
- 1.5 Market definitions
Chapter 2 Executive Summary
- 2.1 Industry synopsis, 2021 – 2034
Chapter 3 Industry Insights
- 3.1 Industry ecosystem
- 3.2 Regulatory landscape
- 3.3 Industry impact forces
- 3.3.1 Growth drivers
- 3.3.2 Industry pitfalls & challenges
- 3.4 Growth potential analysis
- 3.5 Porter's analysis
- 3.5.1 Bargaining power of suppliers
- 3.5.2 Bargaining power of buyers
- 3.5.3 Threat of new entrants
- 3.5.4 Threat of substitutes
- 3.6 PESTEL analysis
Chapter 4 Competitive landscape, 2024
- 4.1 Introduction
- 4.2 Strategic dashboard
- 4.3 Innovation & technology landscape
Chapter 5 Market Size and Forecast, By Product, 2021 – 2034 (USD Million & ‘000 Units)
- 5.1 Key trends
- 5.2 Ultrasonic
- 5.3 Vortex
- 5.4 Others
Chapter 6 Market Size and Forecast, By Technology, 2021 – 2034 (USD Million & ‘000 Units)
- 6.1 Key trends
- 6.2 Mechanical
- 6.3 Static
Chapter 7 Market Size and Forecast, By Application, 2021 – 2034 (USD Million & ‘000 Units)
- 7.1 Key trends
- 7.2 Residential
- 7.3 Commercial
- 7.3.1 College/University
- 7.3.2 Office building
- 7.3.3 Government building
- 7.3.4 Others
- 7.4 Industrial
Chapter 8 Market Size and Forecast, By Region, 2021 – 2034 (USD Million & ‘000 Units)
- 8.1 Key trends
- 8.2 North America
- 8.2.1 U.S.
- 8.2.2 Canada
- 8.3 Europe
- 8.3.1 Germany
- 8.3.2 Poland
- 8.3.3 Sweden
- 8.3.4 Italy
- 8.3.5 France
- 8.4 Asia Pacific
- 8.4.1 China
- 8.4.2 Japan
- 8.4.3 South Korea
- 8.4.4 Singapore
- 8.4.5 India
- 8.5 Middle East
- 8.5.1 Saudi Arabia
- 8.5.2 UAE
- 8.5.3 Qatar
- 8.5.4 Oman
- 8.5.5 Kuwait
Chapter 9 Company Profiles
- 9.1 Axioma Metering
- 9.2 Danfoss
- 9.3 Diehl Stiftung & Co. KG
- 9.4 Honeywell International Inc.
- 9.5 Integra
- 9.6 Itron Inc.
- 9.7 ista Energy Solutions Limited
- 9.8 Kamstrup
- 9.9 Landis+Gyr
- 9.10 RB Flowmeter
- 9.11 Schneider Electric
- 9.12 Secure Meters Ltd.
- 9.13 Siemens
- 9.14 Smartdhome Srl
- 9.15 Sontex SA
- 9.16 Xylem
- 9.17 ZENNER International GmbH & Co. KG
 冷凝火管化學鍋爐市場機會、成長動力、產業趨勢分析及 2025 - 2034 年預測
 2025年清潔能源技術全球市場報告清潔能源市場:2033 年市場分析與預測 - 按類型、按產品、按服務、按技術、按組件、按應用、按部署、按最終用戶、按安裝類型、按解決方案火管冷凝低溫工業鍋爐市場機會、成長動力、產業趨勢分析及 2025 - 2034 年預測2025年至2034年冷凝式火管低溫工業鍋爐市場機會、成長動力、產業趨勢分析與預測
 全球清潔能源基礎設施市場(按基礎設施類型和最終用途)- 機會分析和產業預測,2024 年至 2033 年商用冷卻表市場機會、成長促進因素、產業趨勢分析與預測 2024 - 2032 年冷凝式火管化學鍋爐市場機會、成長動力、產業趨勢分析及2024年至2032年預測超音波冷卻表市場、機會、成長動力、產業趨勢分析與預測,2024-2032
 全球清潔能源技術市場,2024-2028