


 |
市場調查報告書
商品編碼
1097873
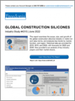
建設用全球矽膠市場Global Construction Silicones |
||||||
價格
建設用矽膠的全球的需求,預計到2025年以金額為準年度成長7.0%。由於全球建設活動的加速,成熟市場的北美和西歐需求也增加,以及基礎設施的建設,維修,改裝的投資成長,也預期帶給該市場需求恩惠。再加上受到黏劑、密封膠、煉製焦化劑、矽膠為基礎產品的性能所牽引,有望繼續成為最大的功能性產品。
本報告提供全球建設用矽膠市場調查,各市場、各功能、各地區的分析,過去資料與預測,主要企業等資訊。
目錄
第1章 摘要整理
第2章 本報告
- 本報告詳細內容
- 調查範圍與產品的說明
- COVID-19大流行的影響
第3章 概要
- 過去的市場趨勢
- 需求:各地區
- 主要國家的市場
- 成長快速國家的市場
- 矽膠產品
- 需求:各類型
- 矽橡膠
- 矽膠樹脂
- 矽膠油
- 市場佔有率與主要生產者
第4章 矽膠的建設用途
- 需求:各建設產品
- 黏劑、密封膠、煉製焦化劑
- 油漆和塗料
- 其他
第5章 北美
- 北美 - 建設用矽膠市場規模和過去趨勢
- 北美 - 需求:各類型、各建設用途
- 美國
- 加拿大
- 墨西哥
第6章 中南美
- 中南美 - 建設用矽膠市場規模和過去趨勢
- 中南美 - 需求:各類型、各建設用途
- 巴西
- 其他
第7章 西歐
- 西歐 - 建設用矽膠市場規模和過去趨勢
- 西歐 - 需求:各類型、各建設用途
- 德國
- 法國
- 英國
- 西班牙
- 義大利
- 其他
第8章 東歐
- 東歐 - 建設用矽膠市場規模和過去趨勢
- 東歐 - 需求:各類型、各建設用途
- 俄羅斯
- 其他
第9章 亞洲/太平洋
- 亞洲/太平洋 - 建設用矽膠市場規模和過去趨勢
- 亞洲/太平洋 - 需求:各類型、各建設用途
- 中國
- 日本
- 印度
- 韓國
- 台灣
- 其他
第10章 非洲/中東
- 非洲/中東 - 建設用矽膠市場規模和過去趨勢
- 非洲/中東 - 需求:各類型、各建設用途
第11章 附錄
- 範圍
- 定義
- 調查手法
- 特定研究的調查手法
- 資訊來源
- 協會和機關
- 相關研究和報告
- 國家清單:各地區
- 宏觀經濟的前提條件
- 世界經濟預測
- 世界人口
- 全球建設預測
Product Code: 4315
This report examines the scope, size, and growth of the global construction silicones industry in metric ton and value terms, and analyzes key trends by market, function, and region. Historical data are provided for 2010, 2015, and 2020, with forecasts for 2025 and 2030. Also provided is an analysis of key industry players and their market shares.
Study Highlights include:
- Global demand for construction silicones is expected to grow 7.0% per year in value terms through 2025.
- An acceleration in construction activity worldwide will boost demand, even in the mature markets of North America and Western Europe
- Growth in investment in infrastructure construction, repair, and improvement will also benefit demand for construction silicones.
- Adhesives, sealants, and caulks will remain the largest functional class, with demand driven by the performance of silicone-based products.
Table of Contents
1. Executive Summary
2. About This Report
- Report Details
- Study Scope & Product Description
- Impact of COVID-19 Pandemic
3. Overview
- Historical Market Trends
- Demand by Region
- Leading Country Markets
- Fastest Growing Country Markets
- Silicones Products
- Demand by Type
- Silicone Elastomers
- Silicone Resins
- Silicone Fluids
- Market Share & Leading Producers
4. Construction Uses for Silicones
- Demand by Construction Product
- Adhesives, Sealants, & Caulks
- Paints & Coatings
- Other Construction Products
5. North America
- North America: Construction Silicone Market Size & Historical Trends
- North America: Demand by Type & Construction Use
- United States
- United States: Construction Silicone Market Size & Historical Trends
- United States: Demand by Type
- Canada
- Canada: Construction Silicone Market Size & Historical Trends
- Canada: Demand by Type
- Mexico
- Mexico: Construction Silicone Market Size & Historical Trends
- Mexico: Demand by Type
6. Central & South America
- Central & South America: Construction Silicone Market Size & Historical Trends
- Central & South America: Demand by Type & Construction Use
- Brazil
- Brazil: Construction Silicone Market Size & Historical Trends
- Brazil: Demand by Type
- Other Central & South America
- Other Central & South America: Construction Silicone Market Size & Historical Trends
- Other Central & South America: Demand by Type
7. Western Europe
- Western Europe: Construction Silicone Market Size & Historical Trends
- Western Europe: Demand by Type & Construction Use
- Germany
- Germany: Construction Silicone Market Size & Historical Trends
- Germany: Demand by Type
- France
- France: Construction Silicone Market Size & Historical Trends
- France: Demand by Type
- United Kingdom
- United Kingdom: Construction Silicone Market Size & Historical Trends
- United Kingdom: Demand by Type
- Spain
- Spain: Construction Silicone Market Size & Historical Trends
- Spain: Demand by Type
- Italy
- Italy: Construction Silicone Market Size & Historical Trends
- Italy: Demand by Type
- Other Western Europe
- Other Western Europe: Construction Silicone Market Size & Historical Trends
- Other Western Europe: Demand by Type
8. Eastern Europe
- Eastern Europe: Construction Silicone Market Size & Historical Trends
- Eastern Europe: Demand by Type & Construction Use
- Russia
- Russia: Construction Silicone Market Size & Historical Trends
- Russia: Demand by Type
- Other Eastern Europe
- Other Eastern Europe: Construction Silicone Market Size & Historical Trends
- Other Eastern Europe: Demand by Type
9. Asia/Pacific
- Asia/Pacific: Construction Silicone Market Size & Historical Trends
- Asia/Pacific: Demand by Type & Construction Use
- China
- China: Construction Silicone Market Size & Historical Trends
- China: Demand by Type
- Japan
- Japan: Construction Silicone Market Size & Historical Trends
- Japan: Demand by Type
- India
- India: Construction Silicone Market Size & Historical Trends
- India: Demand by Type
- South Korea
- South Korea: Construction Silicone Market Size & Historical Trends
- South Korea: Demand by Type
- Taiwan
- Taiwan: Construction Silicone Market Size & Historical Trends
- Taiwan: Demand by Type
- Other Asia/Pacific
- Other Asia/Pacific: Construction Silicone Market Size & Historical Trends
- Other Asia/Pacific: Demand by Type
10. Africa/Mideast
- Africa/Mideast: Construction Silicone Market Size & Historical Trends
- Africa/Mideast: Demand by Type & Construction Use
11. Appendix
- Scope
- Definitions
- Freedonia Methodology
- Study-Specific Methodology
- Sources
- Associations & Agencies
- Related Studies & Reports
- Country Lists by Region
- Macroeconomic Assumptions
- Global Economic Outlook
- Global Population
- Global Construction Outlook
List of Tables
2. About This Report
- Table 2-1 Global Construction Silicones Demand by Region, 2019 - 2022 (million dollars)
3. Overview
- Table 3-1 Global Construction Silicones Demand, 2010 - 2021 (thousand metric tons & million dollars)
- Table 3-2 Global Construction Silicones Demand by Region, 2010 - 2030 (million dollars & thousand metric tons)
- Table 3-3 Global Construction Silicones Demand by Type, 2010 - 2030 (million dollars & thousand metric tons)
- Table 3-4 Global Construction Silicone Elastomers Demand by Region, 2010 - 2030 (million dollars & thousand metric tons)
- Table 3-5 Global Construction Silicone Elastomers Demand by Region, 2010 - 2030 (thousand metric tons)
- Table 3-6 Global Construction Silicone Resins Demand by Region, 2010 - 2030 (million dollars & thousand metric tons)
- Table 3-7 Global Construction Silicone Resins Demand by Region, 2010 - 2030 (thousand metric tons)
- Table 3-8 Global Construction Silicone Fluids Demand by Region, 2010 - 2030 (million dollars & thousand metric tons)
- Table 3-9 Global Construction Silicones Fluids Demand by Region, 2010 - 2030 (thousand metric tons)
4. Construction Uses for Silicones
- Table 4-1 Global Construction Silicones Demand by Construction Product, 2010 - 2030 (million dollars)
- Table 4-2 Global Silicone Demand in Construction Adhesives, Sealants, & Caulks by Region, 2010 - 2030 (million dollars)
- Table 4-3 Global Silicones Demand in Construction Paints & Coatings by Region, 2010 - 2030 (million dollars)
- Table 4-4 Global Silicones Demand in Other Construction Products by Region, 2010 - 2030 (million dollars)
5. North America
- Table 5-1 North America: Construction Silicones Demand by Type & Construction Use, 2010 - 2030 (million dollars)
- Table 5-2 North America: Construction Silicones Demand by Type, 2010 - 2030 (thousand metric tons)
- Table 5-3 United States: Construction Silicones Demand by Type, 2010 - 2030 (million dollars & thousand metric tons)
- Table 5-4 United States: Construction Silicones Demand by Type, 2010 - 2030 (thousand metric tons)
- Table 5-5 Canada: Construction Silicones Demand by Type, 2010 - 2030 (million US dollars & thousand metric tons)
- Table 5-6 Canada: Construction Silicones Demand by Type, 2010 - 2030 (thousand metric tons)
- Table 5-7 Mexico: Construction Silicones Demand by Type, 2010 - 2030 (million dollars & thousand metric tons)
- Table 5-8 Mexico: Construction Silicones Demand by Type, 2010 - 2030 (thousand metric tons)
6. Central & South America
- Table 6-1 Central & South America: Construction Silicones Demand by Type & Construction Use, 2010 - 2030 (million dollars)
- Table 6-2 Central & South America: Construction Silicones Demand by Type, 2010 - 2030 (thousand metric tons)
- Table 6-3 Brazil: Construction Silicones Demand by Type, 2010 - 2030 (million dollars & thousand metric tons)
- Table 6-4 Brazil: Construction Silicones Demand by Type, 2010 - 2030 (thousand metric tons)
- Table 6-5 Other Central & South America: Construction Silicones Demand by Type, 2010 - 2030 (million dollars & thousand metric tons)
- Table 6-6 Other Central & South America: Construction Silicones Demand by Type, 2010 - 2030 (thousand metric tons)
7. Western Europe
- Table 7-1 Western Europe: Construction Silicones Demand by Type & Construction Use, 2010 - 2030 (million dollars)
- Table 7-2 Western Europe: Construction Silicones Demand by Type, 2010 - 2030 (thousand metric tons)
- Table 7-3 Germany: Construction Silicones Demand by Type, 2010 - 2030 (million dollars & thousand metric tons)
- Table 7-4 Germany: Construction Silicones Demand by Type, 2010 - 2030 (thousand metric tons)
- Table 7-5 France: Construction Silicones Demand by Type, 2010 - 2030 (million dollars & thousand metric tons)
- Table 7-6 France: Construction Silicones Demand by Type, 2010 - 2030 (thousand metric tons)
- Table 7-7 United Kingdom: Construction Silicones Demand by Type, 2010 - 2030 (million dollars & thousand metric tons)
- Table 7-8 United Kingdom: Construction Silicones Demand by Type, 2010 - 2030 (thousand metric tons)
- Table 7-9 Spain: Construction Silicones Demand by Type, 2010 - 2030 (million dollars & thousand metric tons)
- Table 7-10 Spain: Construction Silicones Demand by Type, 2010 - 2030 (thousand metric tons)
- Table 7-11 Italy: Construction Silicones Demand by Type, 2010 - 2030 (million dollars & thousand metric tons)
- Table 7-12 Italy: Construction Silicones Demand by Type, 2010 - 2030 (thousand metric tons)
- Table 7-13 Other Western Europe: Construction Silicones Demand by Type, 2010 - 2030 (million dollars & thousand metric tons)
- Table 7-14 Other Western Europe: Construction Silicones Demand by Type, 2010 - 2030 (thousand metric tons)
8. Eastern Europe
- Table 8-1 Eastern Europe: Construction Silicones Demand by Type & Construction Use, 2010 - 2030 (million dollars)
- Table 8-2 Eastern Europe: Construction Silicones Demand by Type, 2010 - 2030 (thousand metric tons)
- Table 8-3 Russia: Construction Silicones Demand by Type, 2010 - 2030 (million dollars & thousand metric tons)
- Table 8-4 Russia: Construction Silicones Demand by Type, 2010 - 2030 (thousand metric tons)
- Table 8-5 Other Eastern Europe: Construction Silicones Demand by Type, 2010 - 2030 (million dollars & thousand metric tons)
- Table 8-6 Other Eastern Europe: Construction Silicones Demand by Type, 2010 - 2030 (thousand metric tons)
9. Asia/Pacific
- Table 9-1 Asia/Pacific: Construction Silicones Demand by Type & Construction Use, 2010 - 2030 (million dollars)
- Table 9-2 Asia/Pacific: Construction Silicones Demand by Type, 2010 - 2030 (thousand metric tons)
- Table 9-3 China: Construction Silicones Demand by Type, 2010 - 2030 (million dollars & thousand metric tons)
- Table 9-4 China: Construction Silicones Demand by Type, 2010 - 2030 (thousand metric tons)
- Table 9-5 Japan: Construction Silicones Demand by Type, 2010 - 2030 (million dollars & thousand metric tons)
- Table 9-6 Japan: Construction Silicones Demand by Type, 2010 - 2030 (thousand metric tons)
- Table 9-7 India: Construction Silicones Demand by Type, 2010 - 2030 (million dollars & thousand metric tons)
- Table 9-8 India: Construction Silicones Demand by Type, 2010 - 2030 (thousand metric tons)
- Table 9-9 South Korea: Construction Silicones Demand by Type, 2010 - 2030 (million dollars & thousand metric tons)
- Table 9-10 South Korea: Construction Silicones Demand by Type, 2010 - 2030 (thousand metric tons)
- Table 9-11 Taiwan: Construction Silicones Demand by Type, 2010 - 2030 (million US dollars & thousand metric tons)
- Table 9-12 Taiwan: Construction Silicones Demand by Type, 2010 - 2030 (thousand metric tons)
- Table 9-13 Other Asia/Pacific: Construction Silicones Demand by Type, 2010 - 2030 (million dollars & thousand metric tons)
- Table 9-14 Other Asia/Pacific: Construction Silicones Demand by Type, 2010 - 2030 (thousand metric tons)
10. Africa/Mideast
- Table 10-1 Africa/Mideast: Construction Silicones Demand by Type & Construction Use, 2010 - 2030 (million dollars & thousand metric tons)
- Table 10-2 Africa/Mideast: Construction Silicones Demand by Type, 2010 - 2030 (thousand metric tons)
11. Appendix
- Table 11-1 Relevant HS Codes
- Table 11-2 Relevant NACE Codes
- Table 11-3 Relevant NAICS & SIC Codes
- Table 11-4 Countries in North America
- Table 11-5 Countries in Central & South America
- Table 11-6 Countries in Western Europe
- Table 11-7 Countries in Eastern Europe
- Table 11-8 Countries in the Asia/Pacific Region
- Table 11-9 Countries in the Africa/Mideast Region
- Table 11-10 Global Gross Domestic Product by Region & Country, 2010 - 2030 (billion 2019 dollars)
- Table 11-11 Global Population by Region & Country, 2010 - 2030 (million persons)
- Table 11-12 Global Construction Expenditures by Region & Country, 2010 - 2030 (billion 2019 dollars)
List of Figures
1. Executive Summary
- Figure 1-1 Construction Silicones Global Market Outlook
2. About This Report
- Figure 2-1 Global Construction Silicones Demand, 2018 - 2023 (million dollars)
3. Overview
- Figure 3-1 Global Construction Silicones Demand, 2004 - 2021 (thousand metric tons)
- Figure 3-2 Global Construction Silicones Value Demand by Region, 2015 - 2025 (% CAGR)
- Figure 3-3 Construction Silicones: Leading Country Markets, 2020 (million dollars)
- Figure 3-4 Construction Silicones: Fastest Growing Country Markets, 2020 - 2025 (% CAGR)
- Figure 3-5 Global Construction Silicones Demand by Type, 2010 - 2030 (thousand metric tons)
4. Construction Uses for Silicones
- Figure 4-1 Global Construction Silicones Demand by Construction Product, 2010 - 2030 (million dollars)
5. North America
- Figure 5-1 North America: Construction Silicones Market Key Indicators, 2020
- Figure 5-2 North America: Construction Silicones Demand, 2005 - 2020 (thousand metric tons)
- Figure 5-3 North America: Construction Silicones Demand Share by Type, 2010 - 2030 (million dollars)
- Figure 5-4 United States: Construction Silicones Market Key Indicators, 2020
- Figure 5-5 United States: Construction Silicones Demand, 2005 - 2020 (thousand metric tons)
- Figure 5-6 Canada: Construction Silicones Market Key Indicators, 2020
- Figure 5-7 Canada: Construction Silicones Demand, 2005 - 2020 (thousand metric tons)
- Figure 5-8 Mexico: Construction Silicones Market Key Indicators, 2020
- Figure 5-9 Mexico: Construction Silicones Demand, 2005 - 2020 (thousand metric tons)
6. Central & South America
- Figure 6-1 Central & South America: Construction Silicones Market Key Indicators, 2020
- Figure 6-2 Central & South America: Construction Silicones Demand, 2005 - 2020 (thousand metric tons)
- Figure 6-3 Central & South America: Construction Silicones Demand Share by Type, 2010 - 2030 (million dollars)
- Figure 6-4 Brazil: Construction Silicones Market Key Indicators, 2020
- Figure 6-5 Brazil: Construction Silicones Demand, 2005 - 2020 (thousand metric tons)
- Figure 6-6 Other Central & South America: Construction Silicones Market Key Indicators, 2020
- Figure 6-7 Other Central & South America: Construction Silicones Demand, 2005 - 2020 (thousand metric tons)
7. Western Europe
- Figure 7-1 Western Europe: Construction Silicones Market Key Indicators, 2020
- Figure 7-2 Western Europe: Construction Silicones Demand, 2005 - 2020 (thousand metric tons)
- Figure 7-3 Western Europe: Construction Silicones Demand Share by Type, 2010 - 2030 (million dollars)
- Figure 7-4 Germany: Construction Silicones Market Key Indicators, 2020
- Figure 7-5 Germany: Construction Silicones Demand, 2005 - 2020 (thousand metric tons)
- Figure 7-6 France: Construction Silicones Market Key Indicators, 2020
- Figure 7-7 France: Construction Silicones Demand, 2005 - 2020 (thousand metric tons)
- Figure 7-8 United Kingdom: Construction Silicones Market Key Indicators, 2020
- Figure 7-9 United Kingdom: Construction Silicones Demand, 2005 - 2020 (thousand metric tons)
- Figure 7-10 Spain: Construction Silicones Market Key Indicators, 2020
- Figure 7-11 Spain: Construction Silicones Demand, 2005 - 2020 (thousand metric tons)
- Figure 7-12 Italy: Construction Silicones Market Key Indicators, 2020
- Figure 7-13 Italy: Construction Silicones Demand, 2005 - 2020 (thousand metric tons)
- Figure 7-14 Other Western Europe: Construction Silicones Market Key Indicators, 2020
- Figure 7-15 Other Western Europe: Construction Silicones Demand, 2005 - 2020 (thousand metric tons)
8. Eastern Europe
- Figure 8-1 Eastern Europe: Construction Silicones Market Key Indicators, 2020
- Figure 8-2 Eastern Europe: Construction Silicones Demand, 2005 - 2020 (thousand metric tons)
- Figure 8-3 Eastern Europe: Construction Silicones Demand Share by Type, 2010 - 2030 (million dollars)
- Figure 8-4 Russia: Construction Silicones Market Key Indicators, 2020
- Figure 8-5 Russia: Construction Silicones Demand, 2005 - 2020 (thousand metric tons)
- Figure 8-6 Other Eastern Europe: Construction Silicones Market Key Indicators, 2020
- Figure 8-7 Other Eastern Europe: Construction Silicones Demand, 2005 - 2020 (thousand metric tons)
9. Asia/Pacific
- Figure 9-1 Asia/Pacific: Construction Silicones Market Key Indicators, 2020
- Figure 9-2 Asia/Pacific: Construction Silicones Demand, 2005 - 2020 (thousand metric tons)
- Figure 9-3 Asia/Pacific: Construction Silicones Demand Share by Type, 2010 - 2030 (million dollars)
- Figure 9-4 China: Construction Silicones Market Key Indicators, 2020
- Figure 9-5 China: Construction Silicones Demand, 2005 - 2020 (thousand metric tons)
- Figure 9-6 Japan: Construction Silicones Market Key Indicators, 2020
- Figure 9-7 Japan: Construction Silicones Demand, 2005 - 2020 (thousand metric tons)
- Figure 9-8 India: Construction Silicones Market Key Indicators, 2020
- Figure 9-9 India: Construction Silicones Demand, 2005 - 2020 (thousand metric tons)
- Figure 9-10 South Korea: Construction Silicones Market Key Indicators, 2020
- Figure 9-11 South Korea: Construction Silicones Demand, 2005 - 2020 (thousand metric tons)
- Figure 9-12 Taiwan: Construction Silicones Market Key Indicators, 2020
- Figure 9-13 Taiwan: Construction Silicones Demand, 2005 - 2020 (thousand metric tons)
- Figure 9-14 Other Asia/Pacific: Construction Silicones Market Key Indicators, 2020
- Figure 9-15 Other Asia/Pacific: Construction Silicones Demand, 2005 - 2020 (thousand metric tons)
10. Africa/Mideast
- Figure 10-1 Africa/Mideast: Construction Silicones Market Key Indicators, 2020
- Figure 10-2 Africa/Mideast: Construction Silicones Demand, 2005 - 2020 (thousand metric tons)
- Figure 10-3 Africa/Mideast: Construction Silicones Demand Share by Type, 2010 - 2030 (million dollars)
02-2729-4219
+886-2-2729-4219
 填縫劑、水泥漿和接縫化合物市場:材料類型、乾燥能力、類型、應用和最終用戶 - 2024-2030 年全球預測
 建築矽膠密封膠市場:按類型、固化類型、應用、最終用途 - 2024-2030 年全球預測
 2024-2028年外裝矽膠填縫劑全球市場
 全球有機矽密封劑市場規模研究與預測,按技術(室溫硫化、熱固性或熱固化、輻射固化、壓力敏感)、應用和區域分析,2023-2030年
 矽酮密封膠市場規模、份額、趨勢分析報告:按技術、應用(建築、中空玻璃、汽車、其他)、地區、細分市場趨勢,2023-2030 年
 全球有機矽密封膠市場——行業規模、份額、趨勢、機會、預測、技術分析、應用、地區和競爭 (2018-2028F)
 矽膠密封膠的全球市場:2016-2032年
 全球有機矽密封膠市場——市場規模、份額、COVID-19 影響和到 2028 年的預測
 矽膠黏劑的全球市場
 矽膠系黏劑的全球市場(2016年~2032年)
▼