


 |
市場調查報告書
商品編碼
1729692
無線供電市場:按技術、應用和地區分類Wireless Power Transfer Market, By Technology, By Application, By Geography |
||||||
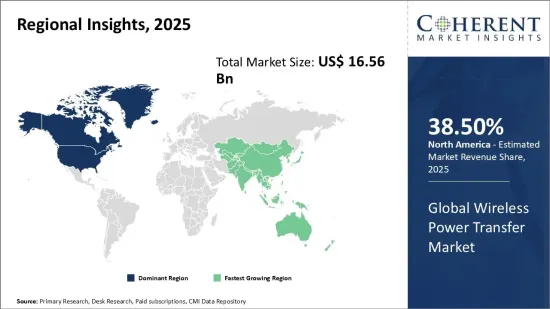
預計到 2025 年全球無線電力傳輸市場規模將達到 165.6 億美元,到 2032 年預計將達到 422.1 億美元,2025 年至 2032 年的年複合成長率(CAGR)為 14.3%。
| 報告範圍 | 報告詳細資訊 | ||
|---|---|---|---|
| 基準年 | 2024 | 2025年的市場規模 | 165.6億美元 |
| 效能數據 | 從2020年到2024年 | 預測期 | 2025年至2032年 |
| 預測期:2025-2032年複合年成長率: | 14.30% | 2032年價值預測 | 422.1億美元 |
由於各行各業對非接觸式充電解決方案的需求不斷增加,全球無線電力市場正在快速成長。 WPT 允許您在無需物理插入的情況下為設備充電,從而提供了無與倫比的便利性。感應和共振磁場技術的進步意味著無線電力現在可以在短距離到中距離內有效傳輸。
這項技術的需求主要體現在消費性電子產品和汽車產品。無論是智慧型手機、穿戴式裝置還是電動車,製造商都在推出內建無線充電功能的選項,以滿足這一需求並讓消費者滿意。同時,醫療保健、工業IoT和智慧家庭技術等產業也開始採用WPT,為市場參與者帶來新的商機。
市場動態:
這一市場成長的核心是一個明顯的消費者趨勢:對無線便利的需求。消費者逐漸放棄傳統的有線充電,這促使公司將無線充電功能整合到從智慧型手機和筆記型電腦到電動車和智慧型手錶等各種設備中。與智慧型手機和穿戴式裝置不同,電動車是一個新興市場而非飽和市場,具有巨大的成長潛力。
然而,與任何高科技行業一樣,高昂的安裝成本是一個挑戰,尤其是對於較小的公司而言。然而,現有的科技公司正在投入大量資源進行研發,以突破可能的界限。透過專注於磁共振等解決方案,遠距無線充電可能會變得實用化。
本研究的主要特點
本報告對全球無線供電市場進行了詳細分析,並以 2024 年為基準年,給出了預測期(2025-2032 年)的市場規模和年複合成長率(CAGR%)。
它還強調了各個領域的潛在商機,並說明了該市場的有吸引力的投資提案矩陣。
它還提供了有關市場促進因素、限制因素、機會、新產品發布和核准、市場趨勢、區域前景和主要企業採用的競爭策略的重要見解。
全球無線供電市場的主要企業是根據公司亮點、產品系列、關鍵亮點、財務績效和策略等參數進行的分析。
主要企業包括 WiTricity、高通、德州儀器、三星電子、LG 電子、索尼公司、華為科技公司、小米公司、蘋果、松下公司、東芝公司、Powermat Technologies、勁量控股、貝爾金國際、Monolithic Power Systems 等。
本報告的見解將使負責人和企業經營團隊能夠就未來的產品發布、新興趨勢、市場擴張和行銷策略做出明智的決策。
本研究報告針對該產業的各個相關人員,包括投資者、供應商、產品製造商、經銷商、新進業者和財務分析師。
可以透過用於分析全球無線電力傳輸市場的各種策略矩陣來促進相關人員的決策。
目錄
第1章 調查目的與前提條件
- 研究目標
- 先決條件
- 簡稱
第2章 市場展望
- 報告描述
- 市場定義和範圍
- 執行摘要
第3章市場動態、法規與趨勢分析
- 市場動態
- 影響分析
- 主要亮點
- 監管情景
- 產品發布/核准
- PEST分析
- 波特分析
- 市場機會
- 監管情景
- 主要進展
- 產業趨勢
第4章。 2020 年至 2032 年全球無線充電市場(依技術分類)
- 近場供電
- 長距離供電
第5章。 2020 年至 2032 年全球無線充電市場(按應用)
- 家電
- 電動車(EV)
- 衛生保健
- 產業
第6章 2020 年至 2032 年全球無線充電市場規模(按地區)
- 北美洲
- 美國
- 加拿大
- 拉丁美洲
- 巴西
- 阿根廷
- 墨西哥
- 其他拉丁美洲
- 歐洲
- 德國
- 英國
- 西班牙
- 法國
- 義大利
- 俄羅斯
- 其他歐洲國家
- 亞太地區
- 中國
- 印度
- 日本
- 澳洲
- 韓國
- ASEAN
- 其他亞太地區
- 中東
- 海灣合作理事會國家
- 以色列
- 其他中東地區
- 非洲
- 南非
- 北非
- 中部非洲
第7章 競爭態勢
- WiTricity
- Qualcomm
- Texas Instruments
- Samsung Electronics
- LG Electronics
- Sony Corporation
- Huawei Technologies
- Xiaomi Corporation
- Apple Inc.
- Panasonic Corporation
- Toshiba Corporation
- Powermat Technologies
- Energizer Holdings
- Belkin International
- Monolithic Power Systems
第 8 章分析師建議
- 命運之輪
- 分析師觀點
- 一致的機會圖
第9章參考文獻與調查方法
- 參考
- 調查方法
- 關於出版商
Global Wireless Power Transfer Market is estimated to be valued at USD 16.56 Bn in 2025 and is expected to reach USD 42.21 Bn by 2032, growing at a compound annual growth rate (CAGR) of 14.3% from 2025 to 2032.
| Report Coverage | Report Details | ||
|---|---|---|---|
| Base Year: | 2024 | Market Size in 2025: | USD 16.56 Bn |
| Historical Data for: | 2020 To 2024 | Forecast Period: | 2025 To 2032 |
| Forecast Period 2025 to 2032 CAGR: | 14.30% | 2032 Value Projection: | USD 42.21 Bn |
The global wireless power transfer market is growing rapidly, driven by rising demand for contactless charging solutions across a variety of industries. By enabling devices to charge without being physically plugged in, WPT offers a level of convenience that's hard to match. Owing to advancements in inductive and resonant magnetic field technologies, wireless power can now be transmitted effectively over short to mid-range distances.
This demand for this technology can be majorly seen in the consumer electronics and automotive products. Be it smartphones, wearables, and electric vehicles, manufacturers are introducing options with built-in wireless charging capabilities to meet this demand and appease the consumers. At the same time, industries like healthcare, industrial IoT, and smart home tech are beginning to adopt WPT as well, opening up new revenue opportunities for market players.
Market Dynamics:
At the heart of the market's growth is a clear trend: consumers want wire-free convenience. Consumers are moving away from traditional cable charging, pushing players to integrate wireless charging across a broad range of devices-from smartphones and laptops to EVs and smartwatches. The increasing demand for electric vehicles is particularly benefitting the market as, unlike smartphones and wearables, EVs are an emerging market, not a saturated one, and has a lot of potential for growth.
However, as with most tech industries, high installation costs pose challenges, especially for small players. Despite this, established tech companies are pouring resources into R&D to push the boundaries of what's possible-focusing on solutions like magnetic resonance that could make longer-range wireless charging a practical reality.
Key Features of the Study:
This report provides in-depth analysis of the global wireless power transfer market, and provides market size (US$ Billion) and compound annual growth rate (CAGR%) for the forecast period (2025-2032), considering 2024 as the base year
It elucidates potential revenue opportunities across different segments and explains attractive investment proposition matrices for this market
This study also provides key insights about market drivers, restraints, opportunities, new product launches or approval, market trends, regional outlook, and competitive strategies adopted by key players
It profiles key players in the global wireless power transfer market based on the following parameters - company highlights, products portfolio, key highlights, financial performance, and strategies
Key companies covered as a part of this study include WiTricity, Qualcomm, Texas Instruments, Samsung Electronics, LG Electronics, Sony Corporation, Huawei Technologies, Xiaomi Corporation, Apple Inc., Panasonic Corporation, Toshiba Corporation, Powermat Technologies, Energizer Holdings, Belkin International, and Monolithic Power Systems
Insights from this report would allow marketers and the management authorities of the companies to make informed decisions regarding their future product launches, type up-gradation, market expansion, and marketing tactics
The global wireless power transfer market report caters to various stakeholders in this industry including investors, suppliers, product manufacturers, distributors, new entrants, and financial analysts
Stakeholders would have ease in decision-making through various strategy matrices used in analyzing the global wireless power transfer market
Market Segmentation
- Technology Insights (Revenue, US$ Bn, 2020 - 2032)
- Near-field Power Transfer
- Far-field Power Transfer
- Application Insights (Revenue, US$ Bn, 2020 - 2032)
- Consumer Electronics
- Electric Vehicles (EVs)
- Healthcare
- Industrial
- Regional Insights (Revenue, US$ Bn, 2020 - 2032)
- North America
- U.S.
- Canada
- Latin America
- Brazil
- Argentina
- Mexico
- Rest of Latin America
- Europe
- Germany
- U.K.
- Spain
- France
- Italy
- Russia
- Rest of Europe
- Asia Pacific
- China
- India
- Japan
- Australia
- South Korea
- ASEAN
- Rest of Asia Pacific
- Middle East
- GCC Countries
- Israel
- Rest of Middle East
- Africa
- South Africa
- North Africa
- Central Africa
- Company Profiles:
- WiTricity
- Qualcomm
- Texas Instruments
- Samsung Electronics
- LG Electronics
- Sony Corporation
- Huawei Technologies
- Xiaomi Corporation
- Apple Inc.
- Panasonic Corporation
- Toshiba Corporation
- Powermat Technologies
- Energizer Holdings
- Belkin International
- Monolithic Power Systems
Table of Contents
1. Research Objectives and Assumptions
- Research Objectives
- Assumptions
- Abbreviations
2. Market Purview
- Report Description
- Market Definition and Scope
- Executive Summary
- Global Wireless Power Transfer Market, By Technology
- Global Wireless Power Transfer Market, By Application
- Global Wireless Power Transfer Market, By Region
3. Market Dynamics, Regulations, and Trends Analysis
- Market Dynamics
- Impact Analysis
- Key Highlights
- Regulatory Scenario
- Product Launches/Approvals
- PEST Analysis
- PORTER's Analysis
- Market Opportunities
- Regulatory Scenario
- Key Developments
- Industry Trends
4. Global Wireless Power Transfer Market, By Technology, 2020-2032, (US$ Bn)
- Introduction
- Market Share Analysis, 2025 and 2032 (%)
- Y-o-Y Growth Analysis, 2021 - 2032
- Segment Trends
- Near-field Power Transfer
- Introduction
- Market Size and Forecast, and Y-o-Y Growth, 2020-2032, (US$ Bn)
- Far-field Power Transfer
- Introduction
- Market Size and Forecast, and Y-o-Y Growth, 2020-2032, (US$ Bn)
5. Global Wireless Power Transfer Market, By Application, 2020-2032, (US$ Bn)
- Introduction
- Market Share Analysis, 2025 and 2032 (%)
- Y-o-Y Growth Analysis, 2021 - 2032
- Segment Trends
- Consumer Electronics
- Introduction
- Market Size and Forecast, and Y-o-Y Growth, 2020-2032, (US$ Bn)
- Electric Vehicles (EVs)
- Introduction
- Market Size and Forecast, and Y-o-Y Growth, 2020-2032, (US$ Bn)
- Healthcare
- Introduction
- Market Size and Forecast, and Y-o-Y Growth, 2020-2032, (US$ Bn)
- Industrial
- Introduction
- Market Size and Forecast, and Y-o-Y Growth, 2020-2032, (US$ Bn)
6. Global Wireless Power Transfer Market, By Region, 2020 - 2032, Value (US$ Bn)
- Introduction
- Market Share (%) Analysis, 2025, 2028 & 2032, Value (US$ Bn)
- Market Y-o-Y Growth Analysis (%), 2021 - 2032, Value (US$ Bn)
- Regional Trends
- North America
- Introduction
- Market Size and Forecast, By Technology, 2020 - 2032, Value (US$ Bn)
- Market Size and Forecast, By Application, 2020 - 2032, Value (US$ Bn)
- Market Size and Forecast, By Country, 2020 - 2032, Value (US$ Bn)
- U.S.
- Canada
- Latin America
- Introduction
- Market Size and Forecast, By Technology, 2020 - 2032, Value (US$ Bn)
- Market Size and Forecast, By Application, 2020 - 2032, Value (US$ Bn)
- Market Size and Forecast, By Country, 2020 - 2032, Value (US$ Bn)
- Brazil
- Argentina
- Mexico
- Rest of Latin America
- Europe
- Introduction
- Market Size and Forecast, By Technology, 2020 - 2032, Value (US$ Bn)
- Market Size and Forecast, By Application, 2020 - 2032, Value (US$ Bn)
- Market Size and Forecast, By Country, 2020 - 2032, Value (US$ Bn)
- Germany
- U.K.
- Spain
- France
- Italy
- Russia
- Rest of Europe
- Asia Pacific
- Introduction
- Market Size and Forecast, By Technology, 2020 - 2032, Value (US$ Bn)
- Market Size and Forecast, By Application, 2020 - 2032, Value (US$ Bn)
- Market Size and Forecast, By Country, 2020 - 2032, Value (US$ Bn)
- China
- India
- Japan
- Australia
- South Korea
- ASEAN
- Rest of Asia Pacific
- Middle East
- Introduction
- Market Size and Forecast, By Technology, 2020 - 2032, Value (US$ Bn)
- Market Size and Forecast, By Application, 2020 - 2032, Value (US$ Bn)
- Market Size and Forecast, By Country, 2020 - 2032, Value (US$ Bn)
- GCC Countries
- Israel
- Rest of Middle East
- Africa
- Introduction
- Market Size and Forecast, By Technology, 2020 - 2032, Value (US$ Bn)
- Market Size and Forecast, By Application, 2020 - 2032, Value (US$ Bn)
- Market Size and Forecast, By Country/Region, 2020 - 2032, Value (US$ Bn)
- South Africa
- North Africa
- Central Africa
7. Competitive Landscape
- WiTricity
- Company Highlights
- Product Portfolio
- Key Developments
- Financial Performance
- Strategies
- Qualcomm
- Company Highlights
- Product Portfolio
- Key Developments
- Financial Performance
- Strategies
- Texas Instruments
- Company Highlights
- Product Portfolio
- Key Developments
- Financial Performance
- Strategies
- Samsung Electronics
- Company Highlights
- Product Portfolio
- Key Developments
- Financial Performance
- Strategies
- LG Electronics
- Company Highlights
- Product Portfolio
- Key Developments
- Financial Performance
- Strategies
- Sony Corporation
- Company Highlights
- Product Portfolio
- Key Developments
- Financial Performance
- Strategies
- Huawei Technologies
- Company Highlights
- Product Portfolio
- Key Developments
- Financial Performance
- Strategies
- Xiaomi Corporation
- Company Highlights
- Product Portfolio
- Key Developments
- Financial Performance
- Strategies
- Apple Inc.
- Company Highlights
- Product Portfolio
- Key Developments
- Financial Performance
- Strategies
- Panasonic Corporation
- Company Highlights
- Product Portfolio
- Key Developments
- Financial Performance
- Strategies
- Toshiba Corporation
- Company Highlights
- Product Portfolio
- Key Developments
- Financial Performance
- Strategies
- Powermat Technologies
- Company Highlights
- Product Portfolio
- Key Developments
- Financial Performance
- Strategies
- Energizer Holdings
- Company Highlights
- Product Portfolio
- Key Developments
- Financial Performance
- Strategies
- Belkin International
- Company Highlights
- Product Portfolio
- Key Developments
- Financial Performance
- Strategies
- Monolithic Power Systems
- Company Highlights
- Product Portfolio
- Key Developments
- Financial Performance
- Strategies
8. Analyst Recommendations
- Wheel of Fortune
- Analyst View
- Coherent Opportunity Map
9. References and Research Methodology
- References
- Research Methodology
- About us
 無線電力傳輸:市場佔有率分析、產業趨勢與統計、成長預測(2026-2031)
 無線電力傳輸市場:依技術、組件、頻率和應用分類-2026-2032年全球市場預測
 無線電力傳輸市場報告:按類型、技術、部署模式、接收器應用、終端用戶產業和地區分類(2026-2034 年)
 無線電力傳輸市場規模、佔有率、成長及全球產業分析:按類型、應用和地區分類的洞察,2026-2034 年預測
 無線電力傳輸市場分析及預測(至2035年):依類型、產品類型、技術、組件、應用、最終用戶、設備、安裝類型及解決方案分類
 無線電力傳輸市場-全球產業規模、佔有率、趨勢、機會、預測:按技術、應用、類型、地區和競爭格局分類,2021-2031年日本無線電力傳輸市場規模、佔有率、趨勢及預測(按類型、技術、部署方式、接收器應用、最終用戶產業及地區分類),2026-2034年
 無線電力傳輸市場規模、佔有率和成長分析(按技術、最終用戶、部署類型和地區分類)—產業預測(2026-2033 年)
 無線電力傳輸系統市場(按技術、應用和地區)
 全球無線傳輸市場