


 |
市場調查報告書
商品編碼
1472298
全球電子醫療市場:按產品、設備類型、應用和最終用戶 - 機會分析和產業預測,2023-2032Electroceuticals Market By Product, By Device Type, By Application, By End User : Global Opportunity Analysis and Industry Forecast, 2023-2032 |
||||||
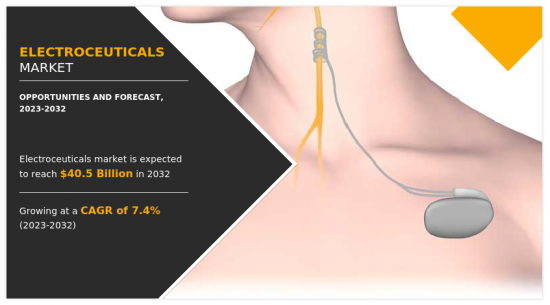
預計2022年全球電子醫療市場規模將達198億美元,2023年至2032年複合年成長率為7.4%,2032年將達405億美元。
電醫學是一種利用電脈衝調節人體神經迴路、組織和器官以達到治療目的的治療裝置。它提供了非藥理學的處置方法來治療多種疾病,包括慢性疼痛、神經病變和心血管疾病。透過利用人體自身的電訊號途徑,電醫學旨在恢復正常的生理功能並緩解症狀。這些設備的範圍從植入式神經刺激設備和神經調節器到外部設備,例如經皮神經電刺激 (TENS) 裝置和穿戴式電療貼片。電子醫學是一個創新且快速發展的領域,為改善患者的治療結果和生活品質提供了有前景的解決方案。
電子醫療市場的成長主要得益於老年人口的增加。這是因為老年人更容易受到與老齡化相關的健康問題的影響,例如神經病變、慢性疼痛和心血管問題,這些問題通常使用電療設備進行治療。根據美國人口普查局(2022 年)的數據,美國居住超過 5,600 萬 65 歲及以上的成年人,占美國人口的近 16.9%。此外,老齡化人口尋求替代治療,以盡量減少藥物依賴並提高生活品質,從而提高電子醫療的接受度。此外,醫療保健技術的進步和對人體電氣系統的深入了解為針對老年人需求量身定做的創新電子醫療解決方案鋪平了道路。因此,老年人口的擴大為電子醫療製造商和開發商帶來了巨大的市場機遇,推動了該領域的投資、研發。
此外,電療設備的技術也取得了顯著的進步,產品變得更小、更彈性、更有效率。進步包括與 MRI 掃描相容,消除了在影像處理過程中移除設備的不便。此外,可充電電池和無線功能的引入提高了患者的舒適度和便利性。這些創新解決了患者移動性和易用性等關鍵問題,並推動了患者和醫生的需求。因此,電子醫療市場預計將顯著成長。這些進步將使這些設備更加易於使用和對使用者友好,從而能夠為各種醫療狀況提供有效的治療,最終改善患者的治療效果和生活品質。
全球電子醫療市場分為產品、設備類型、應用、最終用戶和地區。依產品分類,產品分為心臟心律調節器/植入式心臟整流去顫器、人工電子耳、脊髓刺激設備、深層腦部刺激器、迷走神經刺激設備、薦骨神經刺激器等。設備類型分為植入式設備和非侵入式設備。依應用分類,可分為心律不整、感音性聽障、癲癇、巴金森氏症等。依最終用戶分類,可分為醫院、門診手術中心等。按地區分類:北美(美國、加拿大、墨西哥)、歐洲(德國、法國、英國、義大利、西班牙、歐洲其他地區)、亞太地區(中國、日本、印度、澳洲、韓國、亞太地區其他地區) )、拉丁美洲(巴西、哥倫比亞、阿根廷、拉丁美洲其他地區)、中東和非洲(海灣合作理事會、哥倫比亞、阿根廷、中東和非洲其他地區)。
相關人員的主要利益
- 本報告定量分析了2022年至2032年電子醫療市場分析的細分市場、當前趨勢、估計趨勢和動態,並確定了一般電子醫療市場機會。
- 我們提供市場研究以及與市場促進因素、市場限制和市場機會相關的資訊。
- 波特的五力分析揭示了買家和供應商的潛力,幫助相關人員做出利潤驅動的業務決策並加強供應商和買家網路。
- 對電子醫療市場細分的詳細分析有助於識別市場機會。
- 每個地區的主要國家都根據其對全球市場的收益貢獻繪製了地圖。
- 市場參與者定位有助於基準化分析,並提供對市場參與者當前地位的清晰了解。
- 該報告包括對區域和全球電子醫療市場趨勢、主要企業、細分市場、應用領域和市場成長策略的分析。
該報告可以客製化。
- 監管指引
- 根據客戶興趣加入公司簡介
- 公司簡介的擴充列表
- 歷史市場資料
- 贖回場景
目錄
第1章簡介
第 2 章執行摘要
第3章市場概況
- 市場定義和範圍
- 主要發現
- 影響因素
- 主要投資機會
- 波特五力分析
- 市場動態
- 促進因素
- 抑制因素
- 機會
第4章電子醫療市場:依產品
- 概述
- 心臟心律調節器/植入式心臟整流去顫器
- 人工電子耳
- 脊髓刺激設備
- 深層腦部刺激器
- 迷走神經刺激設備
- 薦骨神經刺激器
- 其他
第5章電子醫療市場:依設備類型
- 概述
- 植入式裝置
- 非侵入性設備
第6章 電子醫療市場:依應用分類
- 概述
- 心律不整
- 感音性聽障
- 癲癇
- 帕金森氏症
- 其他
第7章電子醫療市場:依最終使用者分類
- 概述
- 醫院
- 門診手術中心
- 其他
第8章電子醫療市場:按地區
- 概述
- 北美洲
- 美國
- 加拿大
- 墨西哥
- 歐洲
- 德國
- 法國
- 英國
- 義大利
- 西班牙
- 歐洲其他地區
- 亞太地區
- 日本
- 中國
- 印度
- 澳洲
- 韓國
- 其他亞太地區
- 拉丁美洲
- 巴西
- 哥倫比亞
- 阿根廷
- 其他拉丁美洲
- 中東/非洲
- GCC
- 南非
- 北非
- 其他中東/非洲
第9章 競爭格局
- 介紹
- 關鍵成功策略
- 10家主要企業產品圖譜
- 競爭對手儀表板
- 競爭熱圖
- 2022年主要企業定位
第10章 公司簡介
- Medtronic
- Abbott Laboratories
- Boston Scientific Corporation
- Cochlear Limited
- LivaNova PLC
- Biotronik SE & Co. KG
- electroCore, Inc.
- Sonova Holding AG
- Nevro Corporation
- Oticon Medical AB
The global electroceuticals market was valued at $ 19.8 billion in 2022 and is estimated to reach $40.5 billion by 2032, exhibiting a CAGR of 7.4% from 2023 to 2032. Electroceuticals are medical devices that utilize electrical impulses to modulate the body's neural circuits, tissues, or organs for therapeutic purposes. They offer a non-pharmacological approach for treating various conditions such as chronic pain, neurological disorders, and cardiovascular diseases. By leveraging the body's own electrical signaling pathways, electroceuticals aim to restore normal physiological function and alleviate symptoms. These devices can range from implanted neurostimulators and neuromodulators to external devices such as transcutaneous electrical nerve stimulation (TENS) units and wearable electroceutical patches. Electroceuticals represent an innovative and rapidly advancing field, offering promising solutions for improving patient outcomes and quality of life.
The growth of the electroceuticals market is majorly driven by increase in geriatric population. This is attributed to the fact that elderly individuals are susceptible to age-related health conditions such as neurological disorders, chronic pain, and cardiovascular issues, which are often treated using electroceutical devices. As per the U.S. Census Bureau 2022, more than 56 million adults aged 65 and above live in the U.S., accounting for almost 16.9% of the nation's population; thus, rise in geriatric population is anticipated to fuel the growth of the market. In addition, the aging demographic seeks alternative treatments to minimize medication dependency and improve quality of life, leading to greater acceptance of electroceuticals. Moreover, advancements in healthcare technology and the growing understanding of the body's electrical systems have paved the way for innovative electroceutical solutions tailored to the needs of older adults. As a result, the expanding elderly population presents a significant market opportunity for electroceutical manufacturers and developers, driving investment, research, and development in this sector.
Furthermore, electroceutical devices have seen notable technological advancements, resulting in smaller, more flexible, and efficient products. Advancements include compatibility with MRI scans, eliminating the inconvenience of device removal during imaging procedures. Moreover, the introduction of rechargeable batteries and wireless capabilities enhances patient comfort and convenience. These innovations address key concerns such as patient mobility and ease of use, driving the demand among both patients and physicians. As a result, the electroceuticals market is expected to experience significant growth as these advancements make these devices more accessible, user-friendly, and capable of delivering effective treatments for various medical conditions, ultimately improving patient outcomes and quality of life.
The global electroceuticals market is segmented into product, device type, application, end user, and region. On the basis of product, the market is categorized into cardiac pacemakers & implantable cardioverter defibrillators, cochlear implants, spinal cord stimulators, deep brain stimulators, vagus nerve stimulators, sacral nerve stimulators, and others. Depending on device type, it is bifurcated into implantable devices and non-invasive devices. On the basis of application, it is classified into arrhythmia, sensorineural hearing loss, epilepsy, parkinson's disease, and others. By end user, it is segregated into hospitals, ambulatory surgical centers, and others. Region wise, it is analyzed across North America (U.S., Canada, and Mexico), Europe (Germany, France, UK, Italy, Spain, and rest of Europe), Asia-Pacific (China, Japan, India, Australia, South Korea, and rest of Asia-Pacific), and Latin America (Brazil, Colombia, Argentina, and rest of Latin America), and Middle East & Africa (GCC, South Africa, North Africa, and rest of Middle East & Africa).
The key players that operate in the electroceuticals market are Medtronic, Abbott Laboratorie, Boston Scientific Corporation; Cochlear Ltd., LivaNova PLC, Biotronik SE & Co. KG, ElectroCore, Inc., Sonova, Nevro Corp., and Stimwave LLC. The key players have adopted product launch, product development, and product approval as the key strategies to strengthen their foothold in the competitive market
Key Benefits for Stakeholders
- This report provides a quantitative analysis of the market segments, current trends, estimations, and dynamics of the electroceuticals market analysis from 2022 to 2032 to identify the prevailing electroceuticals market opportunities.
- The market research is offered along with information related to key drivers, restraints, and opportunities.
- Porter's five forces analysis highlights the potency of buyers and suppliers to enable stakeholders make profit-oriented business decisions and strengthen their supplier-buyer network.
- In-depth analysis of the electroceuticals market segmentation assists to determine the prevailing market opportunities.
- Major countries in each region are mapped according to their revenue contribution to the global market.
- Market player positioning facilitates benchmarking and provides a clear understanding of the present position of the market players.
- The report includes the analysis of the regional as well as global electroceuticals market trends, key players, market segments, application areas, and market growth strategies.
Additional benefits you will get with this purchase are:
- Quarterly Update and* (only available with a corporate license, on listed price)
- 5 additional Company Profile of client Choice pre- or Post-purchase, as a free update.
- Free Upcoming Version on the Purchase of Five and Enterprise User License.
- 16 analyst hours of support* (post-purchase, if you find additional data requirements upon review of the report, you may receive support amounting to 16 analyst hours to solve questions, and post-sale queries)
- 15% Free Customization* (in case the scope or segment of the report does not match your requirements, 15% is equivalent to 3 working days of free work, applicable once)
- Free data Pack on the Five and Enterprise User License. (Excel version of the report)
- Free Updated report if the report is 6-12 months old or older.
- 24-hour priority response*
- Free Industry updates and white papers.
Possible Customization with this report (with additional cost and timeline, please talk to the sales executive to know more)
- Regulatory Guidelines
- Additional company profiles with specific to client's interest
- Expanded list for Company Profiles
- Historic market data
- Reimbursement Scenario
Key Market Segments
By Product
- Cardiac Pacemakers and Implantable Cardioverter Defibrillators
- Cochlear Implants
- Spinal Cord Stimulators
- Deep Brain Stimulators
- Vagus Nerve Stimulators
- Sacral Nerve Stimulators
- Others
By Device Type
- Implantable Devices
- Non-invasive Devices
By Application
- Arrhythmia
- Sensorineural Hearing Loss
- Epilepsy
- Parkinson's Disease
- Others
By End User
- Hospitals
- Ambulatory Surgical Centers
- Others
By Region
- North America
- U.S.
- Canada
- Mexico
- Europe
- Germany
- France
- UK
- Italy
- Spain
- Rest of Europe
- Asia-Pacific
- Japan
- China
- India
- Australia
- South Korea
- Rest of Asia-Pacific
- Latin America
- Brazil
- Colombia
- Argentina
- Rest Of La
- Middle East and Africa
- Gcc
- South Africa
- North Africa
- Rest Of Mea
Key Market Players:
- Medtronic
- Abbott Laboratories
- Boston Scientific Corporation
- Cochlear Limited
- LivaNova PLC
- Biotronik SE & Co. KG
- electroCore, Inc.
- Sonova Holding AG
- Nevro Corporation
- Oticon Medical AB
TABLE OF CONTENTS
CHAPTER 1: INTRODUCTION
- 1.1. Report description
- 1.2. Key market segments
- 1.3. Key benefits to the stakeholders
- 1.4. Research methodology
- 1.4.1. Primary research
- 1.4.2. Secondary research
- 1.4.3. Analyst tools and models
CHAPTER 2: EXECUTIVE SUMMARY
- 2.1. CXO perspective
CHAPTER 3: MARKET OVERVIEW
- 3.1. Market definition and scope
- 3.2. Key findings
- 3.2.1. Top impacting factors
- 3.2.2. Top investment pockets
- 3.3. Porter's five forces analysis
- 3.4. Market dynamics
- 3.4.1. Drivers
- 3.4.2. Restraints
- 3.4.3. Opportunities
CHAPTER 4: ELECTROCEUTICALS MARKET, BY PRODUCT
- 4.1. Overview
- 4.1.1. Market size and forecast
- 4.2. Cardiac Pacemakers and Implantable Cardioverter Defibrillators
- 4.2.1. Key market trends, growth factors and opportunities
- 4.2.2. Market size and forecast, by region
- 4.2.3. Market share analysis by country
- 4.3. Cochlear Implants
- 4.3.1. Key market trends, growth factors and opportunities
- 4.3.2. Market size and forecast, by region
- 4.3.3. Market share analysis by country
- 4.4. Spinal Cord Stimulators
- 4.4.1. Key market trends, growth factors and opportunities
- 4.4.2. Market size and forecast, by region
- 4.4.3. Market share analysis by country
- 4.5. Deep Brain Stimulators
- 4.5.1. Key market trends, growth factors and opportunities
- 4.5.2. Market size and forecast, by region
- 4.5.3. Market share analysis by country
- 4.6. Vagus Nerve Stimulators
- 4.6.1. Key market trends, growth factors and opportunities
- 4.6.2. Market size and forecast, by region
- 4.6.3. Market share analysis by country
- 4.7. Sacral Nerve Stimulators
- 4.7.1. Key market trends, growth factors and opportunities
- 4.7.2. Market size and forecast, by region
- 4.7.3. Market share analysis by country
- 4.8. Others
- 4.8.1. Key market trends, growth factors and opportunities
- 4.8.2. Market size and forecast, by region
- 4.8.3. Market share analysis by country
CHAPTER 5: ELECTROCEUTICALS MARKET, BY DEVICE TYPE
- 5.1. Overview
- 5.1.1. Market size and forecast
- 5.2. Implantable Devices
- 5.2.1. Key market trends, growth factors and opportunities
- 5.2.2. Market size and forecast, by region
- 5.2.3. Market share analysis by country
- 5.3. Non-invasive Devices
- 5.3.1. Key market trends, growth factors and opportunities
- 5.3.2. Market size and forecast, by region
- 5.3.3. Market share analysis by country
CHAPTER 6: ELECTROCEUTICALS MARKET, BY APPLICATION
- 6.1. Overview
- 6.1.1. Market size and forecast
- 6.2. Arrhythmia
- 6.2.1. Key market trends, growth factors and opportunities
- 6.2.2. Market size and forecast, by region
- 6.2.3. Market share analysis by country
- 6.3. Sensorineural Hearing Loss
- 6.3.1. Key market trends, growth factors and opportunities
- 6.3.2. Market size and forecast, by region
- 6.3.3. Market share analysis by country
- 6.4. Epilepsy
- 6.4.1. Key market trends, growth factors and opportunities
- 6.4.2. Market size and forecast, by region
- 6.4.3. Market share analysis by country
- 6.5. Parkinson's Disease
- 6.5.1. Key market trends, growth factors and opportunities
- 6.5.2. Market size and forecast, by region
- 6.5.3. Market share analysis by country
- 6.6. Others
- 6.6.1. Key market trends, growth factors and opportunities
- 6.6.2. Market size and forecast, by region
- 6.6.3. Market share analysis by country
CHAPTER 7: ELECTROCEUTICALS MARKET, BY END USER
- 7.1. Overview
- 7.1.1. Market size and forecast
- 7.2. Hospitals
- 7.2.1. Key market trends, growth factors and opportunities
- 7.2.2. Market size and forecast, by region
- 7.2.3. Market share analysis by country
- 7.3. Ambulatory Surgical Centers
- 7.3.1. Key market trends, growth factors and opportunities
- 7.3.2. Market size and forecast, by region
- 7.3.3. Market share analysis by country
- 7.4. Others
- 7.4.1. Key market trends, growth factors and opportunities
- 7.4.2. Market size and forecast, by region
- 7.4.3. Market share analysis by country
CHAPTER 8: ELECTROCEUTICALS MARKET, BY REGION
- 8.1. Overview
- 8.1.1. Market size and forecast By Region
- 8.2. North America
- 8.2.1. Key market trends, growth factors and opportunities
- 8.2.2. Market size and forecast, by Product
- 8.2.3. Market size and forecast, by Device Type
- 8.2.4. Market size and forecast, by Application
- 8.2.5. Market size and forecast, by End User
- 8.2.6. Market size and forecast, by country
- 8.2.6.1. U.S.
- 8.2.6.1.1. Market size and forecast, by Product
- 8.2.6.1.2. Market size and forecast, by Device Type
- 8.2.6.1.3. Market size and forecast, by Application
- 8.2.6.1.4. Market size and forecast, by End User
- 8.2.6.2. Canada
- 8.2.6.2.1. Market size and forecast, by Product
- 8.2.6.2.2. Market size and forecast, by Device Type
- 8.2.6.2.3. Market size and forecast, by Application
- 8.2.6.2.4. Market size and forecast, by End User
- 8.2.6.3. Mexico
- 8.2.6.3.1. Market size and forecast, by Product
- 8.2.6.3.2. Market size and forecast, by Device Type
- 8.2.6.3.3. Market size and forecast, by Application
- 8.2.6.3.4. Market size and forecast, by End User
- 8.3. Europe
- 8.3.1. Key market trends, growth factors and opportunities
- 8.3.2. Market size and forecast, by Product
- 8.3.3. Market size and forecast, by Device Type
- 8.3.4. Market size and forecast, by Application
- 8.3.5. Market size and forecast, by End User
- 8.3.6. Market size and forecast, by country
- 8.3.6.1. Germany
- 8.3.6.1.1. Market size and forecast, by Product
- 8.3.6.1.2. Market size and forecast, by Device Type
- 8.3.6.1.3. Market size and forecast, by Application
- 8.3.6.1.4. Market size and forecast, by End User
- 8.3.6.2. France
- 8.3.6.2.1. Market size and forecast, by Product
- 8.3.6.2.2. Market size and forecast, by Device Type
- 8.3.6.2.3. Market size and forecast, by Application
- 8.3.6.2.4. Market size and forecast, by End User
- 8.3.6.3. UK
- 8.3.6.3.1. Market size and forecast, by Product
- 8.3.6.3.2. Market size and forecast, by Device Type
- 8.3.6.3.3. Market size and forecast, by Application
- 8.3.6.3.4. Market size and forecast, by End User
- 8.3.6.4. Italy
- 8.3.6.4.1. Market size and forecast, by Product
- 8.3.6.4.2. Market size and forecast, by Device Type
- 8.3.6.4.3. Market size and forecast, by Application
- 8.3.6.4.4. Market size and forecast, by End User
- 8.3.6.5. Spain
- 8.3.6.5.1. Market size and forecast, by Product
- 8.3.6.5.2. Market size and forecast, by Device Type
- 8.3.6.5.3. Market size and forecast, by Application
- 8.3.6.5.4. Market size and forecast, by End User
- 8.3.6.6. Rest of Europe
- 8.3.6.6.1. Market size and forecast, by Product
- 8.3.6.6.2. Market size and forecast, by Device Type
- 8.3.6.6.3. Market size and forecast, by Application
- 8.3.6.6.4. Market size and forecast, by End User
- 8.4. Asia-Pacific
- 8.4.1. Key market trends, growth factors and opportunities
- 8.4.2. Market size and forecast, by Product
- 8.4.3. Market size and forecast, by Device Type
- 8.4.4. Market size and forecast, by Application
- 8.4.5. Market size and forecast, by End User
- 8.4.6. Market size and forecast, by country
- 8.4.6.1. Japan
- 8.4.6.1.1. Market size and forecast, by Product
- 8.4.6.1.2. Market size and forecast, by Device Type
- 8.4.6.1.3. Market size and forecast, by Application
- 8.4.6.1.4. Market size and forecast, by End User
- 8.4.6.2. China
- 8.4.6.2.1. Market size and forecast, by Product
- 8.4.6.2.2. Market size and forecast, by Device Type
- 8.4.6.2.3. Market size and forecast, by Application
- 8.4.6.2.4. Market size and forecast, by End User
- 8.4.6.3. India
- 8.4.6.3.1. Market size and forecast, by Product
- 8.4.6.3.2. Market size and forecast, by Device Type
- 8.4.6.3.3. Market size and forecast, by Application
- 8.4.6.3.4. Market size and forecast, by End User
- 8.4.6.4. Australia
- 8.4.6.4.1. Market size and forecast, by Product
- 8.4.6.4.2. Market size and forecast, by Device Type
- 8.4.6.4.3. Market size and forecast, by Application
- 8.4.6.4.4. Market size and forecast, by End User
- 8.4.6.5. South Korea
- 8.4.6.5.1. Market size and forecast, by Product
- 8.4.6.5.2. Market size and forecast, by Device Type
- 8.4.6.5.3. Market size and forecast, by Application
- 8.4.6.5.4. Market size and forecast, by End User
- 8.4.6.6. Rest of Asia-Pacific
- 8.4.6.6.1. Market size and forecast, by Product
- 8.4.6.6.2. Market size and forecast, by Device Type
- 8.4.6.6.3. Market size and forecast, by Application
- 8.4.6.6.4. Market size and forecast, by End User
- 8.5. Latin America
- 8.5.1. Key market trends, growth factors and opportunities
- 8.5.2. Market size and forecast, by Product
- 8.5.3. Market size and forecast, by Device Type
- 8.5.4. Market size and forecast, by Application
- 8.5.5. Market size and forecast, by End User
- 8.5.6. Market size and forecast, by country
- 8.5.6.1. Brazil
- 8.5.6.1.1. Market size and forecast, by Product
- 8.5.6.1.2. Market size and forecast, by Device Type
- 8.5.6.1.3. Market size and forecast, by Application
- 8.5.6.1.4. Market size and forecast, by End User
- 8.5.6.2. Colombia
- 8.5.6.2.1. Market size and forecast, by Product
- 8.5.6.2.2. Market size and forecast, by Device Type
- 8.5.6.2.3. Market size and forecast, by Application
- 8.5.6.2.4. Market size and forecast, by End User
- 8.5.6.3. Argentina
- 8.5.6.3.1. Market size and forecast, by Product
- 8.5.6.3.2. Market size and forecast, by Device Type
- 8.5.6.3.3. Market size and forecast, by Application
- 8.5.6.3.4. Market size and forecast, by End User
- 8.5.6.4. Rest Of La
- 8.5.6.4.1. Market size and forecast, by Product
- 8.5.6.4.2. Market size and forecast, by Device Type
- 8.5.6.4.3. Market size and forecast, by Application
- 8.5.6.4.4. Market size and forecast, by End User
- 8.6. Middle East and Africa
- 8.6.1. Key market trends, growth factors and opportunities
- 8.6.2. Market size and forecast, by Product
- 8.6.3. Market size and forecast, by Device Type
- 8.6.4. Market size and forecast, by Application
- 8.6.5. Market size and forecast, by End User
- 8.6.6. Market size and forecast, by country
- 8.6.6.1. Gcc
- 8.6.6.1.1. Market size and forecast, by Product
- 8.6.6.1.2. Market size and forecast, by Device Type
- 8.6.6.1.3. Market size and forecast, by Application
- 8.6.6.1.4. Market size and forecast, by End User
- 8.6.6.2. South Africa
- 8.6.6.2.1. Market size and forecast, by Product
- 8.6.6.2.2. Market size and forecast, by Device Type
- 8.6.6.2.3. Market size and forecast, by Application
- 8.6.6.2.4. Market size and forecast, by End User
- 8.6.6.3. North Africa
- 8.6.6.3.1. Market size and forecast, by Product
- 8.6.6.3.2. Market size and forecast, by Device Type
- 8.6.6.3.3. Market size and forecast, by Application
- 8.6.6.3.4. Market size and forecast, by End User
- 8.6.6.4. Rest Of Mea
- 8.6.6.4.1. Market size and forecast, by Product
- 8.6.6.4.2. Market size and forecast, by Device Type
- 8.6.6.4.3. Market size and forecast, by Application
- 8.6.6.4.4. Market size and forecast, by End User
CHAPTER 9: COMPETITIVE LANDSCAPE
- 9.1. Introduction
- 9.2. Top winning strategies
- 9.3. Product mapping of top 10 player
- 9.4. Competitive dashboard
- 9.5. Competitive heatmap
- 9.6. Top player positioning, 2022
CHAPTER 10: COMPANY PROFILES
- 10.1. Medtronic
- 10.1.1. Company overview
- 10.1.2. Key executives
- 10.1.3. Company snapshot
- 10.1.4. Operating business segments
- 10.1.5. Product portfolio
- 10.1.6. Business performance
- 10.1.7. Key strategic moves and developments
- 10.2. Abbott Laboratories
- 10.2.1. Company overview
- 10.2.2. Key executives
- 10.2.3. Company snapshot
- 10.2.4. Operating business segments
- 10.2.5. Product portfolio
- 10.2.6. Business performance
- 10.2.7. Key strategic moves and developments
- 10.3. Boston Scientific Corporation
- 10.3.1. Company overview
- 10.3.2. Key executives
- 10.3.3. Company snapshot
- 10.3.4. Operating business segments
- 10.3.5. Product portfolio
- 10.3.6. Business performance
- 10.3.7. Key strategic moves and developments
- 10.4. Cochlear Limited
- 10.4.1. Company overview
- 10.4.2. Key executives
- 10.4.3. Company snapshot
- 10.4.4. Operating business segments
- 10.4.5. Product portfolio
- 10.4.6. Business performance
- 10.4.7. Key strategic moves and developments
- 10.5. LivaNova PLC
- 10.5.1. Company overview
- 10.5.2. Key executives
- 10.5.3. Company snapshot
- 10.5.4. Operating business segments
- 10.5.5. Product portfolio
- 10.5.6. Business performance
- 10.5.7. Key strategic moves and developments
- 10.6. Biotronik SE & Co. KG
- 10.6.1. Company overview
- 10.6.2. Key executives
- 10.6.3. Company snapshot
- 10.6.4. Operating business segments
- 10.6.5. Product portfolio
- 10.6.6. Business performance
- 10.6.7. Key strategic moves and developments
- 10.7. electroCore, Inc.
- 10.7.1. Company overview
- 10.7.2. Key executives
- 10.7.3. Company snapshot
- 10.7.4. Operating business segments
- 10.7.5. Product portfolio
- 10.7.6. Business performance
- 10.7.7. Key strategic moves and developments
- 10.8. Sonova Holding AG
- 10.8.1. Company overview
- 10.8.2. Key executives
- 10.8.3. Company snapshot
- 10.8.4. Operating business segments
- 10.8.5. Product portfolio
- 10.8.6. Business performance
- 10.8.7. Key strategic moves and developments
- 10.9. Nevro Corporation
- 10.9.1. Company overview
- 10.9.2. Key executives
- 10.9.3. Company snapshot
- 10.9.4. Operating business segments
- 10.9.5. Product portfolio
- 10.9.6. Business performance
- 10.9.7. Key strategic moves and developments
- 10.10. Oticon Medical AB
- 10.10.1. Company overview
- 10.10.2. Key executives
- 10.10.3. Company snapshot
- 10.10.4. Operating business segments
- 10.10.5. Product portfolio
- 10.10.6. Business performance
- 10.10.7. Key strategic moves and developments
LIST OF TABLES
- TABLE 01. GLOBAL ELECTROCEUTICALS MARKET, BY PRODUCT, 2022-2032 ($MILLION)
- TABLE 02. ELECTROCEUTICALS MARKET FOR CARDIAC PACEMAKERS AND IMPLANTABLE CARDIOVERTER DEFIBRILLATORS, BY REGION, 2022-2032 ($MILLION)
- TABLE 03. ELECTROCEUTICALS MARKET FOR COCHLEAR IMPLANTS, BY REGION, 2022-2032 ($MILLION)
- TABLE 04. ELECTROCEUTICALS MARKET FOR SPINAL CORD STIMULATORS, BY REGION, 2022-2032 ($MILLION)
- TABLE 05. ELECTROCEUTICALS MARKET FOR DEEP BRAIN STIMULATORS, BY REGION, 2022-2032 ($MILLION)
- TABLE 06. ELECTROCEUTICALS MARKET FOR VAGUS NERVE STIMULATORS, BY REGION, 2022-2032 ($MILLION)
- TABLE 07. ELECTROCEUTICALS MARKET FOR SACRAL NERVE STIMULATORS, BY REGION, 2022-2032 ($MILLION)
- TABLE 08. ELECTROCEUTICALS MARKET FOR OTHERS, BY REGION, 2022-2032 ($MILLION)
- TABLE 09. GLOBAL ELECTROCEUTICALS MARKET, BY DEVICE TYPE, 2022-2032 ($MILLION)
- TABLE 10. ELECTROCEUTICALS MARKET FOR IMPLANTABLE DEVICES, BY REGION, 2022-2032 ($MILLION)
- TABLE 11. ELECTROCEUTICALS MARKET FOR NON-INVASIVE DEVICES, BY REGION, 2022-2032 ($MILLION)
- TABLE 12. GLOBAL ELECTROCEUTICALS MARKET, BY APPLICATION, 2022-2032 ($MILLION)
- TABLE 13. ELECTROCEUTICALS MARKET FOR ARRHYTHMIA, BY REGION, 2022-2032 ($MILLION)
- TABLE 14. ELECTROCEUTICALS MARKET FOR SENSORINEURAL HEARING LOSS, BY REGION, 2022-2032 ($MILLION)
- TABLE 15. ELECTROCEUTICALS MARKET FOR EPILEPSY, BY REGION, 2022-2032 ($MILLION)
- TABLE 16. ELECTROCEUTICALS MARKET FOR PARKINSON'S DISEASE, BY REGION, 2022-2032 ($MILLION)
- TABLE 17. ELECTROCEUTICALS MARKET FOR OTHERS, BY REGION, 2022-2032 ($MILLION)
- TABLE 18. GLOBAL ELECTROCEUTICALS MARKET, BY END USER, 2022-2032 ($MILLION)
- TABLE 19. ELECTROCEUTICALS MARKET FOR HOSPITALS, BY REGION, 2022-2032 ($MILLION)
- TABLE 20. ELECTROCEUTICALS MARKET FOR AMBULATORY SURGICAL CENTERS, BY REGION, 2022-2032 ($MILLION)
- TABLE 21. ELECTROCEUTICALS MARKET FOR OTHERS, BY REGION, 2022-2032 ($MILLION)
- TABLE 22. ELECTROCEUTICALS MARKET, BY REGION, 2022-2032 ($MILLION)
- TABLE 23. NORTH AMERICA ELECTROCEUTICALS MARKET, BY PRODUCT, 2022-2032 ($MILLION)
- TABLE 24. NORTH AMERICA ELECTROCEUTICALS MARKET, BY DEVICE TYPE, 2022-2032 ($MILLION)
- TABLE 25. NORTH AMERICA ELECTROCEUTICALS MARKET, BY APPLICATION, 2022-2032 ($MILLION)
- TABLE 26. NORTH AMERICA ELECTROCEUTICALS MARKET, BY END USER, 2022-2032 ($MILLION)
- TABLE 27. NORTH AMERICA ELECTROCEUTICALS MARKET, BY COUNTRY, 2022-2032 ($MILLION)
- TABLE 28. U.S. ELECTROCEUTICALS MARKET, BY PRODUCT, 2022-2032 ($MILLION)
- TABLE 29. U.S. ELECTROCEUTICALS MARKET, BY DEVICE TYPE, 2022-2032 ($MILLION)
- TABLE 30. U.S. ELECTROCEUTICALS MARKET, BY APPLICATION, 2022-2032 ($MILLION)
- TABLE 31. U.S. ELECTROCEUTICALS MARKET, BY END USER, 2022-2032 ($MILLION)
- TABLE 32. CANADA ELECTROCEUTICALS MARKET, BY PRODUCT, 2022-2032 ($MILLION)
- TABLE 33. CANADA ELECTROCEUTICALS MARKET, BY DEVICE TYPE, 2022-2032 ($MILLION)
- TABLE 34. CANADA ELECTROCEUTICALS MARKET, BY APPLICATION, 2022-2032 ($MILLION)
- TABLE 35. CANADA ELECTROCEUTICALS MARKET, BY END USER, 2022-2032 ($MILLION)
- TABLE 36. MEXICO ELECTROCEUTICALS MARKET, BY PRODUCT, 2022-2032 ($MILLION)
- TABLE 37. MEXICO ELECTROCEUTICALS MARKET, BY DEVICE TYPE, 2022-2032 ($MILLION)
- TABLE 38. MEXICO ELECTROCEUTICALS MARKET, BY APPLICATION, 2022-2032 ($MILLION)
- TABLE 39. MEXICO ELECTROCEUTICALS MARKET, BY END USER, 2022-2032 ($MILLION)
- TABLE 40. EUROPE ELECTROCEUTICALS MARKET, BY PRODUCT, 2022-2032 ($MILLION)
- TABLE 41. EUROPE ELECTROCEUTICALS MARKET, BY DEVICE TYPE, 2022-2032 ($MILLION)
- TABLE 42. EUROPE ELECTROCEUTICALS MARKET, BY APPLICATION, 2022-2032 ($MILLION)
- TABLE 43. EUROPE ELECTROCEUTICALS MARKET, BY END USER, 2022-2032 ($MILLION)
- TABLE 44. EUROPE ELECTROCEUTICALS MARKET, BY COUNTRY, 2022-2032 ($MILLION)
- TABLE 45. GERMANY ELECTROCEUTICALS MARKET, BY PRODUCT, 2022-2032 ($MILLION)
- TABLE 46. GERMANY ELECTROCEUTICALS MARKET, BY DEVICE TYPE, 2022-2032 ($MILLION)
- TABLE 47. GERMANY ELECTROCEUTICALS MARKET, BY APPLICATION, 2022-2032 ($MILLION)
- TABLE 48. GERMANY ELECTROCEUTICALS MARKET, BY END USER, 2022-2032 ($MILLION)
- TABLE 49. FRANCE ELECTROCEUTICALS MARKET, BY PRODUCT, 2022-2032 ($MILLION)
- TABLE 50. FRANCE ELECTROCEUTICALS MARKET, BY DEVICE TYPE, 2022-2032 ($MILLION)
- TABLE 51. FRANCE ELECTROCEUTICALS MARKET, BY APPLICATION, 2022-2032 ($MILLION)
- TABLE 52. FRANCE ELECTROCEUTICALS MARKET, BY END USER, 2022-2032 ($MILLION)
- TABLE 53. UK ELECTROCEUTICALS MARKET, BY PRODUCT, 2022-2032 ($MILLION)
- TABLE 54. UK ELECTROCEUTICALS MARKET, BY DEVICE TYPE, 2022-2032 ($MILLION)
- TABLE 55. UK ELECTROCEUTICALS MARKET, BY APPLICATION, 2022-2032 ($MILLION)
- TABLE 56. UK ELECTROCEUTICALS MARKET, BY END USER, 2022-2032 ($MILLION)
- TABLE 57. ITALY ELECTROCEUTICALS MARKET, BY PRODUCT, 2022-2032 ($MILLION)
- TABLE 58. ITALY ELECTROCEUTICALS MARKET, BY DEVICE TYPE, 2022-2032 ($MILLION)
- TABLE 59. ITALY ELECTROCEUTICALS MARKET, BY APPLICATION, 2022-2032 ($MILLION)
- TABLE 60. ITALY ELECTROCEUTICALS MARKET, BY END USER, 2022-2032 ($MILLION)
- TABLE 61. SPAIN ELECTROCEUTICALS MARKET, BY PRODUCT, 2022-2032 ($MILLION)
- TABLE 62. SPAIN ELECTROCEUTICALS MARKET, BY DEVICE TYPE, 2022-2032 ($MILLION)
- TABLE 63. SPAIN ELECTROCEUTICALS MARKET, BY APPLICATION, 2022-2032 ($MILLION)
- TABLE 64. SPAIN ELECTROCEUTICALS MARKET, BY END USER, 2022-2032 ($MILLION)
- TABLE 65. REST OF EUROPE ELECTROCEUTICALS MARKET, BY PRODUCT, 2022-2032 ($MILLION)
- TABLE 66. REST OF EUROPE ELECTROCEUTICALS MARKET, BY DEVICE TYPE, 2022-2032 ($MILLION)
- TABLE 67. REST OF EUROPE ELECTROCEUTICALS MARKET, BY APPLICATION, 2022-2032 ($MILLION)
- TABLE 68. REST OF EUROPE ELECTROCEUTICALS MARKET, BY END USER, 2022-2032 ($MILLION)
- TABLE 69. ASIA-PACIFIC ELECTROCEUTICALS MARKET, BY PRODUCT, 2022-2032 ($MILLION)
- TABLE 70. ASIA-PACIFIC ELECTROCEUTICALS MARKET, BY DEVICE TYPE, 2022-2032 ($MILLION)
- TABLE 71. ASIA-PACIFIC ELECTROCEUTICALS MARKET, BY APPLICATION, 2022-2032 ($MILLION)
- TABLE 72. ASIA-PACIFIC ELECTROCEUTICALS MARKET, BY END USER, 2022-2032 ($MILLION)
- TABLE 73. ASIA-PACIFIC ELECTROCEUTICALS MARKET, BY COUNTRY, 2022-2032 ($MILLION)
- TABLE 74. JAPAN ELECTROCEUTICALS MARKET, BY PRODUCT, 2022-2032 ($MILLION)
- TABLE 75. JAPAN ELECTROCEUTICALS MARKET, BY DEVICE TYPE, 2022-2032 ($MILLION)
- TABLE 76. JAPAN ELECTROCEUTICALS MARKET, BY APPLICATION, 2022-2032 ($MILLION)
- TABLE 77. JAPAN ELECTROCEUTICALS MARKET, BY END USER, 2022-2032 ($MILLION)
- TABLE 78. CHINA ELECTROCEUTICALS MARKET, BY PRODUCT, 2022-2032 ($MILLION)
- TABLE 79. CHINA ELECTROCEUTICALS MARKET, BY DEVICE TYPE, 2022-2032 ($MILLION)
- TABLE 80. CHINA ELECTROCEUTICALS MARKET, BY APPLICATION, 2022-2032 ($MILLION)
- TABLE 81. CHINA ELECTROCEUTICALS MARKET, BY END USER, 2022-2032 ($MILLION)
- TABLE 82. INDIA ELECTROCEUTICALS MARKET, BY PRODUCT, 2022-2032 ($MILLION)
- TABLE 83. INDIA ELECTROCEUTICALS MARKET, BY DEVICE TYPE, 2022-2032 ($MILLION)
- TABLE 84. INDIA ELECTROCEUTICALS MARKET, BY APPLICATION, 2022-2032 ($MILLION)
- TABLE 85. INDIA ELECTROCEUTICALS MARKET, BY END USER, 2022-2032 ($MILLION)
- TABLE 86. AUSTRALIA ELECTROCEUTICALS MARKET, BY PRODUCT, 2022-2032 ($MILLION)
- TABLE 87. AUSTRALIA ELECTROCEUTICALS MARKET, BY DEVICE TYPE, 2022-2032 ($MILLION)
- TABLE 88. AUSTRALIA ELECTROCEUTICALS MARKET, BY APPLICATION, 2022-2032 ($MILLION)
- TABLE 89. AUSTRALIA ELECTROCEUTICALS MARKET, BY END USER, 2022-2032 ($MILLION)
- TABLE 90. SOUTH KOREA ELECTROCEUTICALS MARKET, BY PRODUCT, 2022-2032 ($MILLION)
- TABLE 91. SOUTH KOREA ELECTROCEUTICALS MARKET, BY DEVICE TYPE, 2022-2032 ($MILLION)
- TABLE 92. SOUTH KOREA ELECTROCEUTICALS MARKET, BY APPLICATION, 2022-2032 ($MILLION)
- TABLE 93. SOUTH KOREA ELECTROCEUTICALS MARKET, BY END USER, 2022-2032 ($MILLION)
- TABLE 94. REST OF ASIA-PACIFIC ELECTROCEUTICALS MARKET, BY PRODUCT, 2022-2032 ($MILLION)
- TABLE 95. REST OF ASIA-PACIFIC ELECTROCEUTICALS MARKET, BY DEVICE TYPE, 2022-2032 ($MILLION)
- TABLE 96. REST OF ASIA-PACIFIC ELECTROCEUTICALS MARKET, BY APPLICATION, 2022-2032 ($MILLION)
- TABLE 97. REST OF ASIA-PACIFIC ELECTROCEUTICALS MARKET, BY END USER, 2022-2032 ($MILLION)
- TABLE 98. LATIN AMERICA ELECTROCEUTICALS MARKET, BY PRODUCT, 2022-2032 ($MILLION)
- TABLE 99. LATIN AMERICA ELECTROCEUTICALS MARKET, BY DEVICE TYPE, 2022-2032 ($MILLION)
- TABLE 100. LATIN AMERICA ELECTROCEUTICALS MARKET, BY APPLICATION, 2022-2032 ($MILLION)
- TABLE 101. LATIN AMERICA ELECTROCEUTICALS MARKET, BY END USER, 2022-2032 ($MILLION)
- TABLE 102. LATIN AMERICA ELECTROCEUTICALS MARKET, BY COUNTRY, 2022-2032 ($MILLION)
- TABLE 103. BRAZIL ELECTROCEUTICALS MARKET, BY PRODUCT, 2022-2032 ($MILLION)
- TABLE 104. BRAZIL ELECTROCEUTICALS MARKET, BY DEVICE TYPE, 2022-2032 ($MILLION)
- TABLE 105. BRAZIL ELECTROCEUTICALS MARKET, BY APPLICATION, 2022-2032 ($MILLION)
- TABLE 106. BRAZIL ELECTROCEUTICALS MARKET, BY END USER, 2022-2032 ($MILLION)
- TABLE 107. COLOMBIA ELECTROCEUTICALS MARKET, BY PRODUCT, 2022-2032 ($MILLION)
- TABLE 108. COLOMBIA ELECTROCEUTICALS MARKET, BY DEVICE TYPE, 2022-2032 ($MILLION)
- TABLE 109. COLOMBIA ELECTROCEUTICALS MARKET, BY APPLICATION, 2022-2032 ($MILLION)
- TABLE 110. COLOMBIA ELECTROCEUTICALS MARKET, BY END USER, 2022-2032 ($MILLION)
- TABLE 111. ARGENTINA ELECTROCEUTICALS MARKET, BY PRODUCT, 2022-2032 ($MILLION)
- TABLE 112. ARGENTINA ELECTROCEUTICALS MARKET, BY DEVICE TYPE, 2022-2032 ($MILLION)
- TABLE 113. ARGENTINA ELECTROCEUTICALS MARKET, BY APPLICATION, 2022-2032 ($MILLION)
- TABLE 114. ARGENTINA ELECTROCEUTICALS MARKET, BY END USER, 2022-2032 ($MILLION)
- TABLE 115. REST OF LA ELECTROCEUTICALS MARKET, BY PRODUCT, 2022-2032 ($MILLION)
- TABLE 116. REST OF LA ELECTROCEUTICALS MARKET, BY DEVICE TYPE, 2022-2032 ($MILLION)
- TABLE 117. REST OF LA ELECTROCEUTICALS MARKET, BY APPLICATION, 2022-2032 ($MILLION)
- TABLE 118. REST OF LA ELECTROCEUTICALS MARKET, BY END USER, 2022-2032 ($MILLION)
- TABLE 119. MIDDLE EAST AND AFRICA ELECTROCEUTICALS MARKET, BY PRODUCT, 2022-2032 ($MILLION)
- TABLE 120. MIDDLE EAST AND AFRICA ELECTROCEUTICALS MARKET, BY DEVICE TYPE, 2022-2032 ($MILLION)
- TABLE 121. MIDDLE EAST AND AFRICA ELECTROCEUTICALS MARKET, BY APPLICATION, 2022-2032 ($MILLION)
- TABLE 122. MIDDLE EAST AND AFRICA ELECTROCEUTICALS MARKET, BY END USER, 2022-2032 ($MILLION)
- TABLE 123. MIDDLE EAST AND AFRICA ELECTROCEUTICALS MARKET, BY COUNTRY, 2022-2032 ($MILLION)
- TABLE 124. GCC ELECTROCEUTICALS MARKET, BY PRODUCT, 2022-2032 ($MILLION)
- TABLE 125. GCC ELECTROCEUTICALS MARKET, BY DEVICE TYPE, 2022-2032 ($MILLION)
- TABLE 126. GCC ELECTROCEUTICALS MARKET, BY APPLICATION, 2022-2032 ($MILLION)
- TABLE 127. GCC ELECTROCEUTICALS MARKET, BY END USER, 2022-2032 ($MILLION)
- TABLE 128. SOUTH AFRICA ELECTROCEUTICALS MARKET, BY PRODUCT, 2022-2032 ($MILLION)
- TABLE 129. SOUTH AFRICA ELECTROCEUTICALS MARKET, BY DEVICE TYPE, 2022-2032 ($MILLION)
- TABLE 130. SOUTH AFRICA ELECTROCEUTICALS MARKET, BY APPLICATION, 2022-2032 ($MILLION)
- TABLE 131. SOUTH AFRICA ELECTROCEUTICALS MARKET, BY END USER, 2022-2032 ($MILLION)
- TABLE 132. NORTH AFRICA ELECTROCEUTICALS MARKET, BY PRODUCT, 2022-2032 ($MILLION)
- TABLE 133. NORTH AFRICA ELECTROCEUTICALS MARKET, BY DEVICE TYPE, 2022-2032 ($MILLION)
- TABLE 134. NORTH AFRICA ELECTROCEUTICALS MARKET, BY APPLICATION, 2022-2032 ($MILLION)
- TABLE 135. NORTH AFRICA ELECTROCEUTICALS MARKET, BY END USER, 2022-2032 ($MILLION)
- TABLE 136. REST OF MEA ELECTROCEUTICALS MARKET, BY PRODUCT, 2022-2032 ($MILLION)
- TABLE 137. REST OF MEA ELECTROCEUTICALS MARKET, BY DEVICE TYPE, 2022-2032 ($MILLION)
- TABLE 138. REST OF MEA ELECTROCEUTICALS MARKET, BY APPLICATION, 2022-2032 ($MILLION)
- TABLE 139. REST OF MEA ELECTROCEUTICALS MARKET, BY END USER, 2022-2032 ($MILLION)
- TABLE 140. MEDTRONIC: KEY EXECUTIVES
- TABLE 141. MEDTRONIC: COMPANY SNAPSHOT
- TABLE 142. MEDTRONIC: PRODUCT SEGMENTS
- TABLE 143. MEDTRONIC: SERVICE SEGMENTS
- TABLE 144. MEDTRONIC: PRODUCT PORTFOLIO
- TABLE 145. MEDTRONIC: KEY STRATERGIES
- TABLE 146. ABBOTT LABORATORIES: KEY EXECUTIVES
- TABLE 147. ABBOTT LABORATORIES: COMPANY SNAPSHOT
- TABLE 148. ABBOTT LABORATORIES: PRODUCT SEGMENTS
- TABLE 149. ABBOTT LABORATORIES: SERVICE SEGMENTS
- TABLE 150. ABBOTT LABORATORIES: PRODUCT PORTFOLIO
- TABLE 151. ABBOTT LABORATORIES: KEY STRATERGIES
- TABLE 152. BOSTON SCIENTIFIC CORPORATION: KEY EXECUTIVES
- TABLE 153. BOSTON SCIENTIFIC CORPORATION: COMPANY SNAPSHOT
- TABLE 154. BOSTON SCIENTIFIC CORPORATION: PRODUCT SEGMENTS
- TABLE 155. BOSTON SCIENTIFIC CORPORATION: SERVICE SEGMENTS
- TABLE 156. BOSTON SCIENTIFIC CORPORATION: PRODUCT PORTFOLIO
- TABLE 157. BOSTON SCIENTIFIC CORPORATION: KEY STRATERGIES
- TABLE 158. COCHLEAR LIMITED: KEY EXECUTIVES
- TABLE 159. COCHLEAR LIMITED: COMPANY SNAPSHOT
- TABLE 160. COCHLEAR LIMITED: PRODUCT SEGMENTS
- TABLE 161. COCHLEAR LIMITED: SERVICE SEGMENTS
- TABLE 162. COCHLEAR LIMITED: PRODUCT PORTFOLIO
- TABLE 163. COCHLEAR LIMITED: KEY STRATERGIES
- TABLE 164. LIVANOVA PLC: KEY EXECUTIVES
- TABLE 165. LIVANOVA PLC: COMPANY SNAPSHOT
- TABLE 166. LIVANOVA PLC: PRODUCT SEGMENTS
- TABLE 167. LIVANOVA PLC: SERVICE SEGMENTS
- TABLE 168. LIVANOVA PLC: PRODUCT PORTFOLIO
- TABLE 169. LIVANOVA PLC: KEY STRATERGIES
- TABLE 170. BIOTRONIK SE & CO. KG: KEY EXECUTIVES
- TABLE 171. BIOTRONIK SE & CO. KG: COMPANY SNAPSHOT
- TABLE 172. BIOTRONIK SE & CO. KG: PRODUCT SEGMENTS
- TABLE 173. BIOTRONIK SE & CO. KG: SERVICE SEGMENTS
- TABLE 174. BIOTRONIK SE & CO. KG: PRODUCT PORTFOLIO
- TABLE 175. BIOTRONIK SE & CO. KG: KEY STRATERGIES
- TABLE 176. ELECTROCORE, INC.: KEY EXECUTIVES
- TABLE 177. ELECTROCORE, INC.: COMPANY SNAPSHOT
- TABLE 178. ELECTROCORE, INC.: PRODUCT SEGMENTS
- TABLE 179. ELECTROCORE, INC.: SERVICE SEGMENTS
- TABLE 180. ELECTROCORE, INC.: PRODUCT PORTFOLIO
- TABLE 181. ELECTROCORE, INC.: KEY STRATERGIES
- TABLE 182. SONOVA HOLDING AG: KEY EXECUTIVES
- TABLE 183. SONOVA HOLDING AG: COMPANY SNAPSHOT
- TABLE 184. SONOVA HOLDING AG: PRODUCT SEGMENTS
- TABLE 185. SONOVA HOLDING AG: SERVICE SEGMENTS
- TABLE 186. SONOVA HOLDING AG: PRODUCT PORTFOLIO
- TABLE 187. SONOVA HOLDING AG: KEY STRATERGIES
- TABLE 188. NEVRO CORPORATION: KEY EXECUTIVES
- TABLE 189. NEVRO CORPORATION: COMPANY SNAPSHOT
- TABLE 190. NEVRO CORPORATION: PRODUCT SEGMENTS
- TABLE 191. NEVRO CORPORATION: SERVICE SEGMENTS
- TABLE 192. NEVRO CORPORATION: PRODUCT PORTFOLIO
- TABLE 193. NEVRO CORPORATION: KEY STRATERGIES
- TABLE 194. OTICON MEDICAL AB: KEY EXECUTIVES
- TABLE 195. OTICON MEDICAL AB: COMPANY SNAPSHOT
- TABLE 196. OTICON MEDICAL AB: PRODUCT SEGMENTS
- TABLE 197. OTICON MEDICAL AB: SERVICE SEGMENTS
- TABLE 198. OTICON MEDICAL AB: PRODUCT PORTFOLIO
- TABLE 199. OTICON MEDICAL AB: KEY STRATERGIES
LIST OF FIGURES
- FIGURE 01. ELECTROCEUTICALS MARKET, 2022-2032
- FIGURE 02. SEGMENTATION OF ELECTROCEUTICALS MARKET,2022-2032
- FIGURE 03. TOP IMPACTING FACTORS IN ELECTROCEUTICALS MARKET
- FIGURE 04. TOP INVESTMENT POCKETS IN ELECTROCEUTICALS MARKET (2023-2032)
- FIGURE 05. BARGAINING POWER OF SUPPLIERS
- FIGURE 06. BARGAINING POWER OF BUYERS
- FIGURE 07. THREAT OF SUBSTITUTION
- FIGURE 08. THREAT OF SUBSTITUTION
- FIGURE 09. COMPETITIVE RIVALRY
- FIGURE 10. GLOBAL ELECTROCEUTICALS MARKET:DRIVERS, RESTRAINTS AND OPPORTUNITIES
- FIGURE 11. ELECTROCEUTICALS MARKET, BY PRODUCT, 2022 AND 2032(%)
- FIGURE 12. COMPARATIVE SHARE ANALYSIS OF ELECTROCEUTICALS MARKET FOR CARDIAC PACEMAKERS AND IMPLANTABLE CARDIOVERTER DEFIBRILLATORS, BY COUNTRY 2022 AND 2032(%)
- FIGURE 13. COMPARATIVE SHARE ANALYSIS OF ELECTROCEUTICALS MARKET FOR COCHLEAR IMPLANTS, BY COUNTRY 2022 AND 2032(%)
- FIGURE 14. COMPARATIVE SHARE ANALYSIS OF ELECTROCEUTICALS MARKET FOR SPINAL CORD STIMULATORS, BY COUNTRY 2022 AND 2032(%)
- FIGURE 15. COMPARATIVE SHARE ANALYSIS OF ELECTROCEUTICALS MARKET FOR DEEP BRAIN STIMULATORS, BY COUNTRY 2022 AND 2032(%)
- FIGURE 16. COMPARATIVE SHARE ANALYSIS OF ELECTROCEUTICALS MARKET FOR VAGUS NERVE STIMULATORS, BY COUNTRY 2022 AND 2032(%)
- FIGURE 17. COMPARATIVE SHARE ANALYSIS OF ELECTROCEUTICALS MARKET FOR SACRAL NERVE STIMULATORS, BY COUNTRY 2022 AND 2032(%)
- FIGURE 18. COMPARATIVE SHARE ANALYSIS OF ELECTROCEUTICALS MARKET FOR OTHERS, BY COUNTRY 2022 AND 2032(%)
- FIGURE 19. ELECTROCEUTICALS MARKET, BY DEVICE TYPE, 2022 AND 2032(%)
- FIGURE 20. COMPARATIVE SHARE ANALYSIS OF ELECTROCEUTICALS MARKET FOR IMPLANTABLE DEVICES, BY COUNTRY 2022 AND 2032(%)
- FIGURE 21. COMPARATIVE SHARE ANALYSIS OF ELECTROCEUTICALS MARKET FOR NON-INVASIVE DEVICES, BY COUNTRY 2022 AND 2032(%)
- FIGURE 22. ELECTROCEUTICALS MARKET, BY APPLICATION, 2022 AND 2032(%)
- FIGURE 23. COMPARATIVE SHARE ANALYSIS OF ELECTROCEUTICALS MARKET FOR ARRHYTHMIA, BY COUNTRY 2022 AND 2032(%)
- FIGURE 24. COMPARATIVE SHARE ANALYSIS OF ELECTROCEUTICALS MARKET FOR SENSORINEURAL HEARING LOSS, BY COUNTRY 2022 AND 2032(%)
- FIGURE 25. COMPARATIVE SHARE ANALYSIS OF ELECTROCEUTICALS MARKET FOR EPILEPSY, BY COUNTRY 2022 AND 2032(%)
- FIGURE 26. COMPARATIVE SHARE ANALYSIS OF ELECTROCEUTICALS MARKET FOR PARKINSON'S DISEASE, BY COUNTRY 2022 AND 2032(%)
- FIGURE 27. COMPARATIVE SHARE ANALYSIS OF ELECTROCEUTICALS MARKET FOR OTHERS, BY COUNTRY 2022 AND 2032(%)
- FIGURE 28. ELECTROCEUTICALS MARKET, BY END USER, 2022 AND 2032(%)
- FIGURE 29. COMPARATIVE SHARE ANALYSIS OF ELECTROCEUTICALS MARKET FOR HOSPITALS, BY COUNTRY 2022 AND 2032(%)
- FIGURE 30. COMPARATIVE SHARE ANALYSIS OF ELECTROCEUTICALS MARKET FOR AMBULATORY SURGICAL CENTERS, BY COUNTRY 2022 AND 2032(%)
- FIGURE 31. COMPARATIVE SHARE ANALYSIS OF ELECTROCEUTICALS MARKET FOR OTHERS, BY COUNTRY 2022 AND 2032(%)
- FIGURE 32. ELECTROCEUTICALS MARKET BY REGION, 2022 AND 2032(%)
- FIGURE 33. U.S. ELECTROCEUTICALS MARKET, 2022-2032 ($MILLION)
- FIGURE 34. CANADA ELECTROCEUTICALS MARKET, 2022-2032 ($MILLION)
- FIGURE 35. MEXICO ELECTROCEUTICALS MARKET, 2022-2032 ($MILLION)
- FIGURE 36. GERMANY ELECTROCEUTICALS MARKET, 2022-2032 ($MILLION)
- FIGURE 37. FRANCE ELECTROCEUTICALS MARKET, 2022-2032 ($MILLION)
- FIGURE 38. UK ELECTROCEUTICALS MARKET, 2022-2032 ($MILLION)
- FIGURE 39. ITALY ELECTROCEUTICALS MARKET, 2022-2032 ($MILLION)
- FIGURE 40. SPAIN ELECTROCEUTICALS MARKET, 2022-2032 ($MILLION)
- FIGURE 41. REST OF EUROPE ELECTROCEUTICALS MARKET, 2022-2032 ($MILLION)
- FIGURE 42. JAPAN ELECTROCEUTICALS MARKET, 2022-2032 ($MILLION)
- FIGURE 43. CHINA ELECTROCEUTICALS MARKET, 2022-2032 ($MILLION)
- FIGURE 44. INDIA ELECTROCEUTICALS MARKET, 2022-2032 ($MILLION)
- FIGURE 45. AUSTRALIA ELECTROCEUTICALS MARKET, 2022-2032 ($MILLION)
- FIGURE 46. SOUTH KOREA ELECTROCEUTICALS MARKET, 2022-2032 ($MILLION)
- FIGURE 47. REST OF ASIA-PACIFIC ELECTROCEUTICALS MARKET, 2022-2032 ($MILLION)
- FIGURE 48. BRAZIL ELECTROCEUTICALS MARKET, 2022-2032 ($MILLION)
- FIGURE 49. COLOMBIA ELECTROCEUTICALS MARKET, 2022-2032 ($MILLION)
- FIGURE 50. ARGENTINA ELECTROCEUTICALS MARKET, 2022-2032 ($MILLION)
- FIGURE 51. REST OF LA ELECTROCEUTICALS MARKET, 2022-2032 ($MILLION)
- FIGURE 52. GCC ELECTROCEUTICALS MARKET, 2022-2032 ($MILLION)
- FIGURE 53. SOUTH AFRICA ELECTROCEUTICALS MARKET, 2022-2032 ($MILLION)
- FIGURE 54. NORTH AFRICA ELECTROCEUTICALS MARKET, 2022-2032 ($MILLION)
- FIGURE 55. REST OF MEA ELECTROCEUTICALS MARKET, 2022-2032 ($MILLION)
- FIGURE 56. TOP WINNING STRATEGIES, BY YEAR
- FIGURE 57. TOP WINNING STRATEGIES, BY DEVELOPMENT
- FIGURE 58. TOP WINNING STRATEGIES, BY COMPANY
- FIGURE 59. PRODUCT MAPPING OF TOP 10 PLAYERS
- FIGURE 60. COMPETITIVE DASHBOARD
- FIGURE 61. COMPETITIVE HEATMAP: ELECTROCEUTICALS MARKET
- FIGURE 62. TOP PLAYER POSITIONING, 2022


