


 |
市場調查報告書
商品編碼
1365838
生物液化天然氣市場:按來源、按應用分類:2023-2032年全球機會分析與產業預測Bio-LNG Market By Source (Agriculture Residues, Industrial Waste, Household Waste, Others), By Application (Automotive, Ships, Power Generation, Others): Global Opportunity Analysis and Industry Forecast, 2023-2032 |
||||||
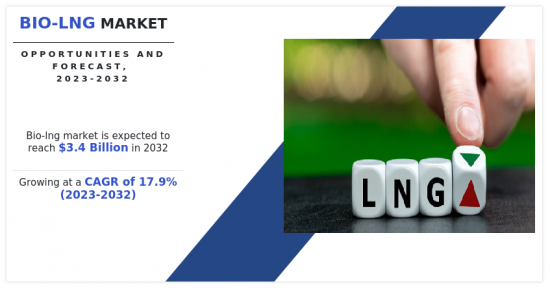
2022年生物液化天然氣市場規模預計為7億美元,預計2032年將達34億美元,2023年至2032年年複合成長率為17.9%。
生物液化天然氣市場迅速擴大。這是由於人們對氣候變遷認知的加深和減少溫室氣體排放的迫切需求。成千上萬的公司、國家和世界領導人尋求更清潔、更永續的能源解決方案。目前基礎設施有更容易大規模部署的替代方案。在這種情況下,生物液化天然氣作為清潔燃料具有巨大的潛力。在生物液化天然氣的幫助下,能源結構預計將顯著多樣化。生物液化天然氣的使用預計將透過減少對石化燃料的依賴來改善國內和全球能源安全。此外,預計這將減少阻礙石油和天然氣供應鏈的風險和不穩定的地緣政治,而石油和天然氣供應鏈目前在世界能源結構中發揮重要作用。
生物液化天然氣可以輕鬆整合到現有的液化天然氣基礎設施和目前運作中的天然氣汽車中。生物液化天然氣與目前的能源系統高度相容,因此無需對現有基礎設施進行重大修改或變更。生物液化天然氣的這些優勢成為生物液化天然氣市場的成長動力。然而,市場面臨著持續成長必須解決的挑戰。由於有機廢棄物、農業殘留物和垃圾垃圾掩埋沼氣的供應不穩定且不可靠,市場面臨多項挑戰。原料收集和籌資策略的最佳化可能會提供市場成長潛力。
另一個問題是生物液化天然氣的生產和精製過程是能源集中且成本高昂的。整個價值鏈的高效技術和進步對於提高整體能源效率和降低生產成本非常重要。研究和開發投資預計將在克服這些障礙並使生物液化天然氣成為更具競爭力的選擇方面發揮關鍵作用。生物液化天然氣。隨著政府和企業優先考慮排放工作和永續交通解決方案,這為市場成長提供了利潤豐厚的機會。
由於人們對氣候變遷的認知不斷增強以及減少溫室氣體排放的願望,生物液化天然氣市場經歷顯著成長。將生物液化天然氣融入當前的能源基礎設施將加速其採用並刺激市場擴張。然而,與原料可得性、生產流程和成本相關的挑戰限制生物液化天然氣市場的整體成長。生物液化天然氣的多項環境效益和永續燃料機會預計將為產業成長提供有利的成長機會。
生物液化天然氣市場根據來源、應用和區域進行研究。依來源分類,生物液化天然氣市場分為農業殘留物、工業廢棄物、生活廢棄物等。農業殘留物也稱為農業或作物殘留物。農業殘留物,也稱為農業或作物殘留物,是農業活動排放的產品或廢棄物。主要作物收穫後剩餘的食物包含各種植物物質,包括莖、葉、殼、穀殼和莖。玉米稈、稻殼、麥稈、甘蔗渣等農業廢棄物也可用於生產生質液化天然氣。這些廢棄物透過厭氧消化轉化為生物液化天然氣,其中微生物在缺氧的情況下分解廢棄物。生物液化天然氣可用於供熱、運輸和發電等多種用途。
依用途分為汽車、船舶、發電等。生物液化天然氣是船舶(尤其是航運業)更清潔、更永續的燃料的可行選擇。與重型燃油(HFO)和船用柴油(MDO)等傳統船用燃料相比,它具有多種優勢。在環保性能和遵守排放法規方面,生物液化天然氣燃料明顯優於傳統燃料。與傳統船用燃料相比,生物液化天然氣可顯著減少溫室氣體排放。它產生更少的溫室氣體、硫氧化物(SOx)、氮氧化物(NOx)和顆粒物,改善空氣品質並減少對環境的負面影響。國際海事組織(IMO)制定了嚴格的法規來減少船舶的硫排放。其中之一是 IMO2020 硫上限法規,該法規限制船用燃料的硫含量。其中一項法律是 IMO2020年硫上限法規,該法規對船用燃料的硫含量設定了限制。生物液化天然氣幾乎不含硫,這有助於船舶營運商滿足這些規定。生物液化天然氣具有高能量密度,可為船舶提供與傳統液化天然氣相似的航程。這使得船舶能夠在不影響燃油效率的情況下遠距航行。
依地區分析了北美、歐洲、亞太地區和拉丁美洲、中東、非洲的生物液化天然氣市場。美國在採用再生能源方面取得長足進步。由於生物液化天然氣已成為最有前途的可能性之一,該國花費大量資金進行研發計劃以改善生物液化天然氣。除政府外,一些私人公司和組織也在投資使用有機廢棄物和農業殘留物作為原料的生物液化天然氣生產設施。生物液化天然氣在運輸業有多種應用,特別是重型運輸和公共運輸。生物液化天然氣是一種比汽油和柴油燃料更環保的替代品。人們對在發電行業使用生物液化天然氣作為低碳燃料的興趣日益濃厚,推動全國範圍內對生物液化天然氣的需求。透過獎勵、法律、法規、補貼和再生能源措施的結合,美國政府繼續支持生物液化天然氣和其他再生燃料。
- 此外,加拿大大力投資生物液化天然氣,以減少溫室氣體排放並推廣再生能源。各州都在規劃生物液化天然氣的生產和基礎設施,特別是在農業和林業部門容易取得有機廢棄物原料的地區。由於生物液化天然氣被認為是一種很有前景的運輸燃料,政府打算強調其在擁有天然氣加註基礎設施的地區的使用。各國政府透過目的是減少碳排放和促進清潔能源技術的法律和計劃大力支持再生燃料的使用。
- 生物液化天然氣產業的主要公司有 Linde plc、Nordsol、Flogas Britain Ltd.、EnviTec Biogas AG、Biokraft International AB、TotalEnergies、Titan LNG、DBG Group BV、BoxLNG Pvt.Ltd.、Shell Plc is。公司採取聯盟等關鍵策略來增加市場佔有率。
- 本報告說明了市場促進因素、市場抑制因素和市場機會,以便更佳了解市場動態。報告也強調了關鍵投資領域。此外,還包括波特的五力分析,以了解產業的競爭場景以及每個利害關係人的角色。本報告重點介紹了主要市場參與企業為維持市場立足點而採取的策略。此外,它還凸顯了主要企業擴大市場佔有率、維持產業激烈競爭的競爭形勢。
目錄
第1章 簡介
第2章 執行摘要
第3章 市場概況
- 市場定義和範圍
- 主要發現
- 影響因素
- 主要投資機會
- 波特五力分析
- 市場動態
- 促進因素
- 環境議題與再生能源政策
- 能源安全和廢棄物管理
- 低排放氣體且與現有基礎設施相容
- 抑制因素
- 原物料可得性
- 加工和基礎設施成本
- 技術挑戰
- 機會
- 過渡到循環經濟和廢棄物管理、再生能源
- 脫碳與能源安全
- 促進因素
- 價值鏈分析
- 專利形勢
第4章 生物液化天然氣市場:依來源分類
- 概述
- 農業殘留物
- 工業廢棄物
- 家庭廢棄物
- 其他
第5章 生物液化天然氣市場:依應用分類
- 概述
- 汽車
- 船
- 發電
- 其他
第6章 生物液化天然氣市場:依地區
- 概述
- 北美洲
- 美國
- 加拿大
- 墨西哥
- 歐洲
- 德國
- 英國
- 法國
- 義大利
- 西班牙
- 其他
- 亞太地區
- 中國
- 日本
- 印度
- 韓國
- 澳洲
- 其他
- 拉丁美洲、中東、非洲
- 巴西
- 沙烏地阿拉伯
- 南非
- 其他
第7章 競爭形勢
- 介紹
- 關鍵成功策略
- 10家主要企業產品圖譜
- 競爭儀表板
- 競爭熱圖
- 2022年主要企業定位
第8章 公司簡介
- Linde Plc
- Shell Plc.
- Nordsol
- Flogas Britain Ltd.
- EnviTec Biogas AG
- TotalEnergies SE.
- Titan LNG
- BIOKRAFT INTERNATIONAL AB
- DBG Group BV
- BoxLNG Pvt. Ltd.
According to a new report published by Allied Market Research, titled, "Bio-LNG Market," The bio-lng market was valued at $0.7 billion in 2022, and is estimated to reach $3.4 billion by 2032, growing at a CAGR of 17.9% from 2023 to 2032.
The market for bio-LNG is expanding quickly. The growing understanding of climate change and the urgent need to cut greenhouse gas emissions is credited with this. Numerous businesses, countries, and world leaders are looking for cleaner, more sustainable energy solutions. The currently existing infrastructure has the preferable alternatives that are simple to deploy on a wide scale. In this situation, bio-LNG has a lot of potential as a clean fuel. The energy mix is expected to be significantly diversified with the help of bio-LNG. The usage of Bio-LNG is anticipated to improve both domestic and global energy security by reducing the dependency on fossil fuels. Moreover, it is also expected to limit the exposure to risks and volatile geopolitics that loom around the oil and gas supply chain that are currently major role players in the world energy mix.
Bio-LNG can be easily integrated into existing LNG infrastructure and natural gas vehicles that are in operation at present. Since bio-LNG is highly compatible with current energy systems Its adoption will not need extensive modifications or changes in existing infrastructure. Such benefits of bio-LNG act as a driving factor for the bio-LNG market growth. However, the market faces challenges that need to be resolved for continuous growth. The market faces several challenges from unstable and unreliable supply of organic waste, agricultural residues, and landfill gas. The optimization of feedstock collection and sourcing strategies will offer the potential for market growth.
Another obstacle to consider is the energy-intensive and costly nature of the bio-LNG production and purification processes. Efficient technologies and advancements in the entire value chain are essential to improve overall energy efficiency and reduce production costs. Investing in R&D is anticipated to play a vital role in overcoming these hurdles and making bio-LNG a more competitive option. Bio-LNG. This offers lucrative opportunities for market growth, as governments and companies prioritize emission reduction efforts and sustainable transportation solutions.
The bio-LNG market has experienced remarkable growth due to heightened climate change awareness and the desire to cut greenhouse gas emissions. Integrating bio-LNG into the current energy infrastructure facilitates its adoption and fuels market expansion. However, challenges related to feedstock availability, production processes, and costs restrain the overall bio-LNG market growth. Several environmental benefits and sustainable fuel opportunities of bio-LNG is expected to offer lucrative growth opportunities for the industry growth.
The bio-LNG market is studied on the basis of source, application, and region. By source, the bio-LNG market is divided into agriculture residues, industrial waste, household waste, and others. Agriculture residues are also known as agricultural or crop residues. They are the by-products or waste materials left from several agricultural activities. A variety of plant materials, including stalks, leaves, husks, shells, and stems, are among the leftovers after the main crop has been harvested. Agricultural wastes like maize stalks, rice husks, wheat straw, sugarcane bagasse, and similar materials are also used in the production of bio-LNG. These wastes are transformed into bio-LNG by anaerobic digestion, which involves microorganisms breaking down trash in the absence of oxygen. It can be utilized for many things, like as heating, moving around, and creating power.
By application, the market is categorized into automotive, ships, power generation, and others. Bio-LNG (liquefied natural gas) is a viable option for cleaner and more sustainable fuel in ships, especially in the maritime industry. It has several benefits against traditional marine fuels, such as heavy fuel oil (HFO) and marine diesel oil (MDO). Regarding environmental performance and compliance with emissions laws, bio-LNG fuel performs significantly better than conventional fuels. When comparing bio-LNG to conventional marine fuels, greenhouse gas emissions can be significantly reduced. The air is better and it has less of an adverse effect on the environment because it creates fewer greenhouse gases, sulfur oxides (SOx), nitrogen oxides (NOx), and particles. The International Maritime Organization (IMO) has created stringent regulations to decrease sulfur emissions from ships. The IMO 2020 sulfur cap, which places a restriction on the sulfur content of marine fuels, is one such law. One such law is the IMO 2020 sulfur cap, which establishes a limit on the sulfur content of marine fuels. Bio-LNG can help ship operators comply with these regulations, as it contains negligible sulfur content. Bio-LNG has a high energy density, providing a similar range to conventional LNG for ships. This allows vessels to cover longer distances without compromising on fuel efficiency.
By region, the bio-LNG market analysis is done across North America, Europe, Asia-Pacific, and LAMEA. The United States has made tremendous progress toward implementing renewable energy sources. The nation is spending a lot of money on research and development projects to improve bio-LNG because it has become one of the most promising possibilities. Apart from the government, several private companies and organizations are investing in bio-LNG production facilities that use organic waste and agricultural residues as feedstock. There are several applications for bio-LNG in the transportation industry, particularly in heavy-duty haulage and public transportation. It offers a more environmentally friendly substitute for gasoline and diesel fuel. The growing interest in using bio-LNG as a low-carbon fuel in the power generation industry has increased demand for bio-LNG throughout the nation. Through a combination of incentives, laws, regulations, subsidies, and renewable energy initiatives, the US government continuously supports bio-LNG and other renewable fuels.
- In addition, Canada is spending a lot of money on bio-LNG in an effort to reduce greenhouse gas emissions and promote renewable energy. Various provinces are planning for bio-LNG production and infrastructure, especially in regions with easy access to agricultural and forestry sectors for organic waste feedstock. The government intends to highlight the use of bio-LNG in areas with natural gas refueling infrastructure since the fuel is thought to be a promising choice for transportation. Through laws and programs meant to cut carbon emissions and boost clean energy technology, the government strongly supports the use of renewable fuels.
- The major players operating in the bio-LNG industry are Linde plc, Nordsol, Flogas Britain Ltd., EnviTec Biogas AG, Biokraft International AB, TotalEnergies, Titan LNG, DBG Group B.V., BoxLNG Pvt. Ltd., and Shell Plc. The companies adopted key strategies such as collaboration to increase their market share.
- The drivers, restraints, and opportunities are explained in the report to better understand the market dynamics. This report further highlights the key areas of investment. In addition, it includes Porter's five forces analysis to understand the competitive scenario of the industry and the role of each stakeholder. The report features strategies adopted by key market players to maintain their foothold in the market. Furthermore, it highlights the competitive landscape of key players to increase their market share and sustain the intense competition in the industry.
Key Benefits For Stakeholders
- This report provides a quantitative analysis of the market segments, current trends, estimations, and dynamics of the bio-lng market analysis from 2022 to 2032 to identify the prevailing bio-lng market opportunities.
- The market research is offered along with information related to key drivers, restraints, and opportunities.
- Porter's five forces analysis highlights the potency of buyers and suppliers to enable stakeholders make profit-oriented business decisions and strengthen their supplier-buyer network.
- In-depth analysis of the bio-lng market segmentation assists to determine the prevailing market opportunities.
- Major countries in each region are mapped according to their revenue contribution to the global market.
- Market player positioning facilitates benchmarking and provides a clear understanding of the present position of the market players.
- The report includes the analysis of the regional as well as global bio-lng market trends, key players, market segments, application areas, and market growth strategies.
Additional benefits you will get with this purchase are:
- Quarterly Update and* (only available with a corporate license, on listed price)
- 5 additional Company Profile of client Choice pre- or Post-purchase, as a free update.
- Free Upcoming Version on the Purchase of Five and Enterprise User License.
- 16 analyst hours of support* (post-purchase, if you find additional data requirements upon review of the report, you may receive support amounting to 16 analyst hours to solve questions, and post-sale queries)
- 15% Free Customization* (in case the scope or segment of the report does not match your requirements, 20% is equivalent to 3 working days of free work, applicable once)
- Free data Pack on the Five and Enterprise User License. (Excel version of the report)
- Free Updated report if the report is 6-12 months old or older.
- 24-hour priority response*
- Free Industry updates and white papers.
Possible Customization with this report (with additional cost and timeline talk to the sales executive to know more)
- Investment Opportunities
- Additional company profiles with specific to client's interest
- Additional country or region analysis- market size and forecast
- Criss-cross segment analysis- market size and forecast
- Expanded list for Company Profiles
- Historic market data
- Import Export Analysis/Data
- List of customers/consumers/raw material suppliers- value chain analysis
- SWOT Analysis
Key Market Segments
By Source
- Agriculture Residues
- Industrial Waste
- Household Waste
- Others
By Application
- Automotive
- Ships
- Power Generation
- Others
By Region
- North America
- U.S.
- Canada
- Mexico
- Europe
- Germany
- UK
- France
- Italy
- Spain
- Rest of Europe
- Asia-Pacific
- China
- Japan
- India
- South Korea
- Australia
- Rest of Asia-Pacific
- LAMEA
- Brazil
- Saudi Arabia
- South Africa
- Rest of LAMEA
Key Market Players:
- Nordsol
- BoxLNG Pvt. Ltd.
- TotalEnergies SE.
- Titan LNG
- EnviTec Biogas AG
- Shell Plc.
- Linde Plc
- DBG Group B.V.
- BIOKRAFT INTERNATIONAL AB
- Flogas Britain Ltd.
TABLE OF CONTENTS
CHAPTER 1: INTRODUCTION
- 1.1. Report description
- 1.2. Key market segments
- 1.3. Key benefits to the stakeholders
- 1.4. Research Methodology
- 1.4.1. Primary research
- 1.4.2. Secondary research
- 1.4.3. Analyst tools and models
CHAPTER 2: EXECUTIVE SUMMARY
- 2.1. CXO Perspective
CHAPTER 3: MARKET OVERVIEW
- 3.1. Market definition and scope
- 3.2. Key findings
- 3.2.1. Top impacting factors
- 3.2.2. Top investment pockets
- 3.3. Porter's five forces analysis
- 3.3.1. Low bargaining power of suppliers
- 3.3.2. Low threat of new entrants
- 3.3.3. Low threat of substitutes
- 3.3.4. Low intensity of rivalry
- 3.3.5. Low bargaining power of buyers
- 3.4. Market dynamics
- 3.4.1. Drivers
- 3.4.1.1. Environment concerns and renewable energy policies
- 3.4.1.2. Energy security and waste management
- 3.4.1.3. Low emissions and compatibility with existing infrastructure
- 3.4.2. Restraints
- 3.4.2.1. Feedstock availability
- 3.4.2.2. Processing and infrastructure costs
- 3.4.2.3. Technological challenges
- 3.4.3. Opportunities
- 3.4.3.1. Circular economy and waste management & renewable energy transition
- 3.4.3.2. Decarbonization and energy security
- 3.4.1. Drivers
- 3.5. Value Chain Analysis
- 3.6. Patent Landscape
CHAPTER 4: BIO-LNG MARKET, BY SOURCE
- 4.1. Overview
- 4.1.1. Market size and forecast
- 4.2. Agriculture Residues
- 4.2.1. Key market trends, growth factors and opportunities
- 4.2.2. Market size and forecast, by region
- 4.2.3. Market share analysis by country
- 4.3. Industrial Waste
- 4.3.1. Key market trends, growth factors and opportunities
- 4.3.2. Market size and forecast, by region
- 4.3.3. Market share analysis by country
- 4.4. Household Waste
- 4.4.1. Key market trends, growth factors and opportunities
- 4.4.2. Market size and forecast, by region
- 4.4.3. Market share analysis by country
- 4.5. Others
- 4.5.1. Key market trends, growth factors and opportunities
- 4.5.2. Market size and forecast, by region
- 4.5.3. Market share analysis by country
CHAPTER 5: BIO-LNG MARKET, BY APPLICATION
- 5.1. Overview
- 5.1.1. Market size and forecast
- 5.2. Automotive
- 5.2.1. Key market trends, growth factors and opportunities
- 5.2.2. Market size and forecast, by region
- 5.2.3. Market share analysis by country
- 5.3. Ships
- 5.3.1. Key market trends, growth factors and opportunities
- 5.3.2. Market size and forecast, by region
- 5.3.3. Market share analysis by country
- 5.4. Power Generation
- 5.4.1. Key market trends, growth factors and opportunities
- 5.4.2. Market size and forecast, by region
- 5.4.3. Market share analysis by country
- 5.5. Others
- 5.5.1. Key market trends, growth factors and opportunities
- 5.5.2. Market size and forecast, by region
- 5.5.3. Market share analysis by country
CHAPTER 6: BIO-LNG MARKET, BY REGION
- 6.1. Overview
- 6.1.1. Market size and forecast By Region
- 6.2. North America
- 6.2.1. Key market trends, growth factors and opportunities
- 6.2.2. Market size and forecast, by Source
- 6.2.3. Market size and forecast, by Application
- 6.2.4. Market size and forecast, by country
- 6.2.4.1. U.S.
- 6.2.4.1.1. Market size and forecast, by Source
- 6.2.4.1.2. Market size and forecast, by Application
- 6.2.4.2. Canada
- 6.2.4.2.1. Market size and forecast, by Source
- 6.2.4.2.2. Market size and forecast, by Application
- 6.2.4.3. Mexico
- 6.2.4.3.1. Market size and forecast, by Source
- 6.2.4.3.2. Market size and forecast, by Application
- 6.3. Europe
- 6.3.1. Key market trends, growth factors and opportunities
- 6.3.2. Market size and forecast, by Source
- 6.3.3. Market size and forecast, by Application
- 6.3.4. Market size and forecast, by country
- 6.3.4.1. Germany
- 6.3.4.1.1. Market size and forecast, by Source
- 6.3.4.1.2. Market size and forecast, by Application
- 6.3.4.2. UK
- 6.3.4.2.1. Market size and forecast, by Source
- 6.3.4.2.2. Market size and forecast, by Application
- 6.3.4.3. France
- 6.3.4.3.1. Market size and forecast, by Source
- 6.3.4.3.2. Market size and forecast, by Application
- 6.3.4.4. Italy
- 6.3.4.4.1. Market size and forecast, by Source
- 6.3.4.4.2. Market size and forecast, by Application
- 6.3.4.5. Spain
- 6.3.4.5.1. Market size and forecast, by Source
- 6.3.4.5.2. Market size and forecast, by Application
- 6.3.4.6. Rest of Europe
- 6.3.4.6.1. Market size and forecast, by Source
- 6.3.4.6.2. Market size and forecast, by Application
- 6.4. Asia-Pacific
- 6.4.1. Key market trends, growth factors and opportunities
- 6.4.2. Market size and forecast, by Source
- 6.4.3. Market size and forecast, by Application
- 6.4.4. Market size and forecast, by country
- 6.4.4.1. China
- 6.4.4.1.1. Market size and forecast, by Source
- 6.4.4.1.2. Market size and forecast, by Application
- 6.4.4.2. Japan
- 6.4.4.2.1. Market size and forecast, by Source
- 6.4.4.2.2. Market size and forecast, by Application
- 6.4.4.3. India
- 6.4.4.3.1. Market size and forecast, by Source
- 6.4.4.3.2. Market size and forecast, by Application
- 6.4.4.4. South Korea
- 6.4.4.4.1. Market size and forecast, by Source
- 6.4.4.4.2. Market size and forecast, by Application
- 6.4.4.5. Australia
- 6.4.4.5.1. Market size and forecast, by Source
- 6.4.4.5.2. Market size and forecast, by Application
- 6.4.4.6. Rest of Asia-Pacific
- 6.4.4.6.1. Market size and forecast, by Source
- 6.4.4.6.2. Market size and forecast, by Application
- 6.5. LAMEA
- 6.5.1. Key market trends, growth factors and opportunities
- 6.5.2. Market size and forecast, by Source
- 6.5.3. Market size and forecast, by Application
- 6.5.4. Market size and forecast, by country
- 6.5.4.1. Brazil
- 6.5.4.1.1. Market size and forecast, by Source
- 6.5.4.1.2. Market size and forecast, by Application
- 6.5.4.2. Saudi Arabia
- 6.5.4.2.1. Market size and forecast, by Source
- 6.5.4.2.2. Market size and forecast, by Application
- 6.5.4.3. South Africa
- 6.5.4.3.1. Market size and forecast, by Source
- 6.5.4.3.2. Market size and forecast, by Application
- 6.5.4.4. Rest of LAMEA
- 6.5.4.4.1. Market size and forecast, by Source
- 6.5.4.4.2. Market size and forecast, by Application
CHAPTER 7: COMPETITIVE LANDSCAPE
- 7.1. Introduction
- 7.2. Top winning strategies
- 7.3. Product Mapping of Top 10 Player
- 7.4. Competitive Dashboard
- 7.5. Competitive Heatmap
- 7.6. Top player positioning, 2022
CHAPTER 8: COMPANY PROFILES
- 8.1. Linde Plc
- 8.1.1. Company overview
- 8.1.2. Key Executives
- 8.1.3. Company snapshot
- 8.1.4. Operating business segments
- 8.1.5. Product portfolio
- 8.1.6. Business performance
- 8.1.7. Key strategic moves and developments
- 8.2. Shell Plc.
- 8.2.1. Company overview
- 8.2.2. Key Executives
- 8.2.3. Company snapshot
- 8.2.4. Operating business segments
- 8.2.5. Product portfolio
- 8.2.6. Business performance
- 8.2.7. Key strategic moves and developments
- 8.3. Nordsol
- 8.3.1. Company overview
- 8.3.2. Key Executives
- 8.3.3. Company snapshot
- 8.3.4. Operating business segments
- 8.3.5. Product portfolio
- 8.3.6. Key strategic moves and developments
- 8.4. Flogas Britain Ltd.
- 8.4.1. Company overview
- 8.4.2. Key Executives
- 8.4.3. Company snapshot
- 8.4.4. Operating business segments
- 8.4.5. Product portfolio
- 8.5. EnviTec Biogas AG
- 8.5.1. Company overview
- 8.5.2. Key Executives
- 8.5.3. Company snapshot
- 8.5.4. Operating business segments
- 8.5.5. Product portfolio
- 8.5.6. Business performance
- 8.6. TotalEnergies SE.
- 8.6.1. Company overview
- 8.6.2. Key Executives
- 8.6.3. Company snapshot
- 8.6.4. Operating business segments
- 8.6.5. Product portfolio
- 8.6.6. Business performance
- 8.6.7. Key strategic moves and developments
- 8.7. Titan LNG
- 8.7.1. Company overview
- 8.7.2. Key Executives
- 8.7.3. Company snapshot
- 8.7.4. Operating business segments
- 8.7.5. Product portfolio
- 8.8. BIOKRAFT INTERNATIONAL AB
- 8.8.1. Company overview
- 8.8.2. Key Executives
- 8.8.3. Company snapshot
- 8.8.4. Operating business segments
- 8.8.5. Product portfolio
- 8.8.6. Business performance
- 8.8.7. Key strategic moves and developments
- 8.9. DBG Group B.V.
- 8.9.1. Company overview
- 8.9.2. Key Executives
- 8.9.3. Company snapshot
- 8.9.4. Operating business segments
- 8.9.5. Product portfolio
- 8.9.6. Key strategic moves and developments
- 8.10. BoxLNG Pvt. Ltd.
- 8.10.1. Company overview
- 8.10.2. Key Executives
- 8.10.3. Company snapshot
- 8.10.4. Operating business segments
- 8.10.5. Product portfolio
- 8.10.6. Key strategic moves and developments
LIST OF TABLES
- TABLE 01. GLOBAL BIO-LNG MARKET, BY SOURCE, 2022-2032 ($MILLION)
- TABLE 02. BIO-LNG MARKET FOR AGRICULTURE RESIDUES, BY REGION, 2022-2032 ($MILLION)
- TABLE 03. BIO-LNG MARKET FOR INDUSTRIAL WASTE, BY REGION, 2022-2032 ($MILLION)
- TABLE 04. BIO-LNG MARKET FOR HOUSEHOLD WASTE, BY REGION, 2022-2032 ($MILLION)
- TABLE 05. BIO-LNG MARKET FOR OTHERS, BY REGION, 2022-2032 ($MILLION)
- TABLE 06. GLOBAL BIO-LNG MARKET, BY APPLICATION, 2022-2032 ($MILLION)
- TABLE 07. BIO-LNG MARKET FOR AUTOMOTIVE, BY REGION, 2022-2032 ($MILLION)
- TABLE 08. BIO-LNG MARKET FOR SHIPS, BY REGION, 2022-2032 ($MILLION)
- TABLE 09. BIO-LNG MARKET FOR POWER GENERATION, BY REGION, 2022-2032 ($MILLION)
- TABLE 10. BIO-LNG MARKET FOR OTHERS, BY REGION, 2022-2032 ($MILLION)
- TABLE 11. BIO-LNG MARKET, BY REGION, 2022-2032 ($MILLION)
- TABLE 12. NORTH AMERICA BIO-LNG MARKET, BY SOURCE, 2022-2032 ($MILLION)
- TABLE 13. NORTH AMERICA BIO-LNG MARKET, BY APPLICATION, 2022-2032 ($MILLION)
- TABLE 14. NORTH AMERICA BIO-LNG MARKET, BY COUNTRY, 2022-2032 ($MILLION)
- TABLE 15. U.S. BIO-LNG MARKET, BY SOURCE, 2022-2032 ($MILLION)
- TABLE 16. U.S. BIO-LNG MARKET, BY APPLICATION, 2022-2032 ($MILLION)
- TABLE 17. CANADA BIO-LNG MARKET, BY SOURCE, 2022-2032 ($MILLION)
- TABLE 18. CANADA BIO-LNG MARKET, BY APPLICATION, 2022-2032 ($MILLION)
- TABLE 19. MEXICO BIO-LNG MARKET, BY SOURCE, 2022-2032 ($MILLION)
- TABLE 20. MEXICO BIO-LNG MARKET, BY APPLICATION, 2022-2032 ($MILLION)
- TABLE 21. EUROPE BIO-LNG MARKET, BY SOURCE, 2022-2032 ($MILLION)
- TABLE 22. EUROPE BIO-LNG MARKET, BY APPLICATION, 2022-2032 ($MILLION)
- TABLE 23. EUROPE BIO-LNG MARKET, BY COUNTRY, 2022-2032 ($MILLION)
- TABLE 24. GERMANY BIO-LNG MARKET, BY SOURCE, 2022-2032 ($MILLION)
- TABLE 25. GERMANY BIO-LNG MARKET, BY APPLICATION, 2022-2032 ($MILLION)
- TABLE 26. UK BIO-LNG MARKET, BY SOURCE, 2022-2032 ($MILLION)
- TABLE 27. UK BIO-LNG MARKET, BY APPLICATION, 2022-2032 ($MILLION)
- TABLE 28. FRANCE BIO-LNG MARKET, BY SOURCE, 2022-2032 ($MILLION)
- TABLE 29. FRANCE BIO-LNG MARKET, BY APPLICATION, 2022-2032 ($MILLION)
- TABLE 30. ITALY BIO-LNG MARKET, BY SOURCE, 2022-2032 ($MILLION)
- TABLE 31. ITALY BIO-LNG MARKET, BY APPLICATION, 2022-2032 ($MILLION)
- TABLE 32. SPAIN BIO-LNG MARKET, BY SOURCE, 2022-2032 ($MILLION)
- TABLE 33. SPAIN BIO-LNG MARKET, BY APPLICATION, 2022-2032 ($MILLION)
- TABLE 34. REST OF EUROPE BIO-LNG MARKET, BY SOURCE, 2022-2032 ($MILLION)
- TABLE 35. REST OF EUROPE BIO-LNG MARKET, BY APPLICATION, 2022-2032 ($MILLION)
- TABLE 36. ASIA-PACIFIC BIO-LNG MARKET, BY SOURCE, 2022-2032 ($MILLION)
- TABLE 37. ASIA-PACIFIC BIO-LNG MARKET, BY APPLICATION, 2022-2032 ($MILLION)
- TABLE 38. ASIA-PACIFIC BIO-LNG MARKET, BY COUNTRY, 2022-2032 ($MILLION)
- TABLE 39. CHINA BIO-LNG MARKET, BY SOURCE, 2022-2032 ($MILLION)
- TABLE 40. CHINA BIO-LNG MARKET, BY APPLICATION, 2022-2032 ($MILLION)
- TABLE 41. JAPAN BIO-LNG MARKET, BY SOURCE, 2022-2032 ($MILLION)
- TABLE 42. JAPAN BIO-LNG MARKET, BY APPLICATION, 2022-2032 ($MILLION)
- TABLE 43. INDIA BIO-LNG MARKET, BY SOURCE, 2022-2032 ($MILLION)
- TABLE 44. INDIA BIO-LNG MARKET, BY APPLICATION, 2022-2032 ($MILLION)
- TABLE 45. SOUTH KOREA BIO-LNG MARKET, BY SOURCE, 2022-2032 ($MILLION)
- TABLE 46. SOUTH KOREA BIO-LNG MARKET, BY APPLICATION, 2022-2032 ($MILLION)
- TABLE 47. AUSTRALIA BIO-LNG MARKET, BY SOURCE, 2022-2032 ($MILLION)
- TABLE 48. AUSTRALIA BIO-LNG MARKET, BY APPLICATION, 2022-2032 ($MILLION)
- TABLE 49. REST OF ASIA-PACIFIC BIO-LNG MARKET, BY SOURCE, 2022-2032 ($MILLION)
- TABLE 50. REST OF ASIA-PACIFIC BIO-LNG MARKET, BY APPLICATION, 2022-2032 ($MILLION)
- TABLE 51. LAMEA BIO-LNG MARKET, BY SOURCE, 2022-2032 ($MILLION)
- TABLE 52. LAMEA BIO-LNG MARKET, BY APPLICATION, 2022-2032 ($MILLION)
- TABLE 53. LAMEA BIO-LNG MARKET, BY COUNTRY, 2022-2032 ($MILLION)
- TABLE 54. BRAZIL BIO-LNG MARKET, BY SOURCE, 2022-2032 ($MILLION)
- TABLE 55. BRAZIL BIO-LNG MARKET, BY APPLICATION, 2022-2032 ($MILLION)
- TABLE 56. SAUDI ARABIA BIO-LNG MARKET, BY SOURCE, 2022-2032 ($MILLION)
- TABLE 57. SAUDI ARABIA BIO-LNG MARKET, BY APPLICATION, 2022-2032 ($MILLION)
- TABLE 58. SOUTH AFRICA BIO-LNG MARKET, BY SOURCE, 2022-2032 ($MILLION)
- TABLE 59. SOUTH AFRICA BIO-LNG MARKET, BY APPLICATION, 2022-2032 ($MILLION)
- TABLE 60. REST OF LAMEA BIO-LNG MARKET, BY SOURCE, 2022-2032 ($MILLION)
- TABLE 61. REST OF LAMEA BIO-LNG MARKET, BY APPLICATION, 2022-2032 ($MILLION)
- TABLE 62. LINDE PLC: KEY EXECUTIVES
- TABLE 63. LINDE PLC: COMPANY SNAPSHOT
- TABLE 64. LINDE PLC: PRODUCT SEGMENTS
- TABLE 65. LINDE PLC: PRODUCT PORTFOLIO
- TABLE 66. LINDE PLC: KEY STRATERGIES
- TABLE 67. SHELL PLC.: KEY EXECUTIVES
- TABLE 68. SHELL PLC.: COMPANY SNAPSHOT
- TABLE 69. SHELL PLC.: PRODUCT SEGMENTS
- TABLE 70. SHELL PLC.: PRODUCT PORTFOLIO
- TABLE 71. SHELL PLC.: KEY STRATERGIES
- TABLE 72. NORDSOL: KEY EXECUTIVES
- TABLE 73. NORDSOL: COMPANY SNAPSHOT
- TABLE 74. NORDSOL: PRODUCT SEGMENTS
- TABLE 75. NORDSOL: PRODUCT PORTFOLIO
- TABLE 76. NORDSOL: KEY STRATERGIES
- TABLE 77. FLOGAS BRITAIN LTD.: KEY EXECUTIVES
- TABLE 78. FLOGAS BRITAIN LTD.: COMPANY SNAPSHOT
- TABLE 79. FLOGAS BRITAIN LTD.: PRODUCT SEGMENTS
- TABLE 80. FLOGAS BRITAIN LTD.: PRODUCT PORTFOLIO
- TABLE 81. ENVITEC BIOGAS AG: KEY EXECUTIVES
- TABLE 82. ENVITEC BIOGAS AG: COMPANY SNAPSHOT
- TABLE 83. ENVITEC BIOGAS AG: SERVICE SEGMENTS
- TABLE 84. ENVITEC BIOGAS AG: PRODUCT PORTFOLIO
- TABLE 85. TOTALENERGIES SE.: KEY EXECUTIVES
- TABLE 86. TOTALENERGIES SE.: COMPANY SNAPSHOT
- TABLE 87. TOTALENERGIES SE.: SERVICE SEGMENTS
- TABLE 88. TOTALENERGIES SE.: PRODUCT PORTFOLIO
- TABLE 89. TOTALENERGIES SE.: KEY STRATERGIES
- TABLE 90. TITAN LNG: KEY EXECUTIVES
- TABLE 91. TITAN LNG: COMPANY SNAPSHOT
- TABLE 92. TITAN LNG: SERVICE SEGMENTS
- TABLE 93. TITAN LNG: PRODUCT PORTFOLIO
- TABLE 94. BIOKRAFT INTERNATIONAL AB: KEY EXECUTIVES
- TABLE 95. BIOKRAFT INTERNATIONAL AB: COMPANY SNAPSHOT
- TABLE 96. BIOKRAFT INTERNATIONAL AB: PRODUCT SEGMENTS
- TABLE 97. BIOKRAFT INTERNATIONAL AB: PRODUCT PORTFOLIO
- TABLE 98. BIOKRAFT INTERNATIONAL AB: KEY STRATERGIES
- TABLE 99. DBG GROUP B.V.: KEY EXECUTIVES
- TABLE 100. DBG GROUP B.V.: COMPANY SNAPSHOT
- TABLE 101. DBG GROUP B.V.: PRODUCT SEGMENTS
- TABLE 102. DBG GROUP B.V.: PRODUCT PORTFOLIO
- TABLE 103. DBG GROUP B.V.: KEY STRATERGIES
- TABLE 104. BOXLNG PVT. LTD.: KEY EXECUTIVES
- TABLE 105. BOXLNG PVT. LTD.: COMPANY SNAPSHOT
- TABLE 106. BOXLNG PVT. LTD.: PRODUCT SEGMENTS
- TABLE 107. BOXLNG PVT. LTD.: PRODUCT PORTFOLIO
- TABLE 108. BOXLNG PVT. LTD.: KEY STRATERGIES
LIST OF FIGURES
- FIGURE 01. BIO-LNG MARKET, 2022-2032
- FIGURE 02. SEGMENTATION OF BIO-LNG MARKET,2022-2032
- FIGURE 03. TOP INVESTMENT POCKETS IN BIO-LNG MARKET (2023-2032)
- FIGURE 04. LOW BARGAINING POWER OF SUPPLIERS
- FIGURE 05. LOW THREAT OF NEW ENTRANTS
- FIGURE 06. LOW THREAT OF SUBSTITUTES
- FIGURE 07. LOW INTENSITY OF RIVALRY
- FIGURE 08. LOW BARGAINING POWER OF BUYERS
- FIGURE 09. GLOBAL BIO-LNG MARKET:DRIVERS, RESTRAINTS AND OPPORTUNITIES
- FIGURE 10. PATENT ANALYSIS BY COMPANY
- FIGURE 11. PATENT ANALYSIS BY COUNTRY
- FIGURE 12. BIO-LNG MARKET, BY SOURCE, 2022 AND 2032(%)
- FIGURE 13. COMPARATIVE SHARE ANALYSIS OF BIO-LNG MARKET FOR AGRICULTURE RESIDUES, BY COUNTRY 2022 AND 2032(%)
- FIGURE 14. COMPARATIVE SHARE ANALYSIS OF BIO-LNG MARKET FOR INDUSTRIAL WASTE, BY COUNTRY 2022 AND 2032(%)
- FIGURE 15. COMPARATIVE SHARE ANALYSIS OF BIO-LNG MARKET FOR HOUSEHOLD WASTE, BY COUNTRY 2022 AND 2032(%)
- FIGURE 16. COMPARATIVE SHARE ANALYSIS OF BIO-LNG MARKET FOR OTHERS, BY COUNTRY 2022 AND 2032(%)
- FIGURE 17. BIO-LNG MARKET, BY APPLICATION, 2022 AND 2032(%)
- FIGURE 18. COMPARATIVE SHARE ANALYSIS OF BIO-LNG MARKET FOR AUTOMOTIVE, BY COUNTRY 2022 AND 2032(%)
- FIGURE 19. COMPARATIVE SHARE ANALYSIS OF BIO-LNG MARKET FOR SHIPS, BY COUNTRY 2022 AND 2032(%)
- FIGURE 20. COMPARATIVE SHARE ANALYSIS OF BIO-LNG MARKET FOR POWER GENERATION, BY COUNTRY 2022 AND 2032(%)
- FIGURE 21. COMPARATIVE SHARE ANALYSIS OF BIO-LNG MARKET FOR OTHERS, BY COUNTRY 2022 AND 2032(%)
- FIGURE 22. BIO-LNG MARKET BY REGION, 2022 AND 2032(%)
- FIGURE 23. U.S. BIO-LNG MARKET, 2022-2032 ($MILLION)
- FIGURE 24. CANADA BIO-LNG MARKET, 2022-2032 ($MILLION)
- FIGURE 25. MEXICO BIO-LNG MARKET, 2022-2032 ($MILLION)
- FIGURE 26. GERMANY BIO-LNG MARKET, 2022-2032 ($MILLION)
- FIGURE 27. UK BIO-LNG MARKET, 2022-2032 ($MILLION)
- FIGURE 28. FRANCE BIO-LNG MARKET, 2022-2032 ($MILLION)
- FIGURE 29. ITALY BIO-LNG MARKET, 2022-2032 ($MILLION)
- FIGURE 30. SPAIN BIO-LNG MARKET, 2022-2032 ($MILLION)
- FIGURE 31. REST OF EUROPE BIO-LNG MARKET, 2022-2032 ($MILLION)
- FIGURE 32. CHINA BIO-LNG MARKET, 2022-2032 ($MILLION)
- FIGURE 33. JAPAN BIO-LNG MARKET, 2022-2032 ($MILLION)
- FIGURE 34. INDIA BIO-LNG MARKET, 2022-2032 ($MILLION)
- FIGURE 35. SOUTH KOREA BIO-LNG MARKET, 2022-2032 ($MILLION)
- FIGURE 36. AUSTRALIA BIO-LNG MARKET, 2022-2032 ($MILLION)
- FIGURE 37. REST OF ASIA-PACIFIC BIO-LNG MARKET, 2022-2032 ($MILLION)
- FIGURE 38. BRAZIL BIO-LNG MARKET, 2022-2032 ($MILLION)
- FIGURE 39. SAUDI ARABIA BIO-LNG MARKET, 2022-2032 ($MILLION)
- FIGURE 40. SOUTH AFRICA BIO-LNG MARKET, 2022-2032 ($MILLION)
- FIGURE 41. REST OF LAMEA BIO-LNG MARKET, 2022-2032 ($MILLION)
- FIGURE 42. TOP WINNING STRATEGIES, BY YEAR (2017-2023)
- FIGURE 43. TOP WINNING STRATEGIES, BY DEVELOPMENT (2017-2023)
- FIGURE 44. TOP WINNING STRATEGIES, BY COMPANY (2017-2023)
- FIGURE 45. PRODUCT MAPPING OF TOP 10 PLAYERS
- FIGURE 46. COMPETITIVE DASHBOARD
- FIGURE 47. COMPETITIVE HEATMAP: BIO-LNG MARKET
- FIGURE 48. TOP PLAYER POSITIONING, 2022
- FIGURE 49. LINDE PLC: NET SALES, 2020-2022 ($MILLION)
- FIGURE 50. LINDE PLC: RESEARCH & DEVELOPMENT EXPENDITURE, 2020-2022 ($MILLION)
- FIGURE 51. LINDE PLC: REVENUE SHARE BY SEGMENT, 2022 (%)
- FIGURE 52. LINDE PLC: REVENUE SHARE BY REGION, 2022 (%)
- FIGURE 53. SHELL PLC.: NET REVENUE, 2020-2022 ($MILLION)
- FIGURE 54. SHELL PLC.: RESEARCH & DEVELOPMENT EXPENDITURE, 2020-2022 ($MILLION)
- FIGURE 55. SHELL PLC.: REVENUE SHARE BY SEGMENT, 2022 (%)
- FIGURE 56. SHELL PLC.: REVENUE SHARE BY REGION, 2022 (%)
- FIGURE 57. ENVITEC BIOGAS AG: NET SALES, 2019-2021 ($MILLION)
- FIGURE 58. ENVITEC BIOGAS AG: REVENUE SHARE BY SEGMENT, 2021 (%)
- FIGURE 59. ENVITEC BIOGAS AG: REVENUE SHARE BY REGION, 2021 (%)
- FIGURE 60. TOTALENERGIES SE.: SALES REVENUE, 2020-2022 ($MILLION)
- FIGURE 61. TOTALENERGIES SE.: RESEARCH & DEVELOPMENT EXPENDITURE, 2020-2022 ($MILLION)
- FIGURE 62. TOTALENERGIES SE.: REVENUE SHARE BY SEGMENT, 2022 (%)
- FIGURE 63. BIOKRAFT INTERNATIONAL AB: NET SALES, 2020-2022 ($MILLION)
 2025年液化天然氣全球市場報告2025年液化天然氣壓縮機全球市場報告
 計畫中的液化天然氣市場-全球產業規模、佔有率、趨勢、機會和預測,按技術(液化、再氣化)、應用(住宅、商業、工業)、地區和競爭細分,2020-2030 年預測2025年全球工業液化天然氣(LNG)汽化器市場報告
 全球生物液化天然氣市場:2032 年預測-按原料產品、生產流程、分銷類型、應用、最終用戶和地區進行分析
 全球生物液化天然氣市場
 液化天然氣市場規模、佔有率、成長分析(按類型、按液化天然氣基礎設施、按液化天然氣貿易、按應用、按地區)- 2025-2032 年產業預測
 生物液化天然氣市場 - 全球及區域分析:按應用、產地及地區 - 分析與預測(2025-2034)車用液化天然氣市場 - 全球產業規模、佔有率、趨勢、機會和預測,按車輛類型、按最終用戶產業、按液化天然氣儲存和基礎設施、按地區和競爭進行細分,2020-2030 年預測
 LNG 市場:市場佔有率分析、產業趨勢與統計、成長預測(2025-2030 年)