


 |
市場調查報告書
商品編碼
2040973
眼科藥物市場(2026-2036):疾病趨勢、研發管線、市場狀況及預測Ophthalmic Drugs Market, 2026 - 2036: Disease Landscape, Pipeline, Commercial Dynamics and Forecasts |
||||||
概括:
全球眼科藥物市場正經歷一場變革。人口老化、糖尿病在全球範圍內的日益流行,以及自2023年以來作用機制各異的新藥核准,都在擴大目標患者群體,開闢三年前尚不存在的全新商業領域,並引發眼科疾病治療方法的結構性轉變。這項轉變正從慢性病患者的每日自我用藥,轉向醫師給藥的緩釋系統,最終發展到單劑量基因治療平台。這些變化在所有主要疾病領域同時發生,且速度驚人,縮短了現有治療方法的典型產品生命週期。
全球眼科藥物市場預計到 2026 年將達到約 468 億美元,到 2030 年將以 5.7% 的年複合成長率成長。這一成長的促進因素包括抗 VEGF 療法等生物製藥的商業性化成熟、首個核准治療地圖狀萎縮的藥物的出現、乾眼症市場的結構性重新評估,以及向基因療法和緩釋給藥平台的逐步轉變。
市場正經歷日益加劇的結構性兩極化。隨著多種阿伐維西普和雷珠單抗生物相似藥的核准,成熟的抗VEGF藥物市場正面臨來自生物相似藥的加速競爭,預計到2027年,隨著剩餘參與企業完成專利結算,價格壓力將進一步加大。同時,2023年核准的一類新藥開闢了一個高價位市場,短期內不會面臨學名藥的競爭。具體而言,這些新藥包括用於治療地圖狀萎縮的培塞他考普蘭和阿巴辛卡帕特聚乙二醇,用於治療乾眼症的全氟己辛烷和無水Cyclosporine,用於治療青光眼的曲伏前列素前房植入,以及用於治療蠕形蟎眼瞼炎的羅替拉納。 Falicimab(Vabysmo)是首個核准用於眼科的雙特異性抗體,其年銷售額在2024年突破40億美元,憑藉其獨特的作用機制和更長的作用持續時間,重新定義了濕性老齡化黃斑部病變(濕性AMD)的治療標準。 2026年4月,Irea HD獲得FDA核准,最長給藥間隔20週。這是目前核准的注射型抗VEGF藥物的最長給藥間隔,進一步鞏固了Regeneron公司抵禦生物相似藥市場佔有率衝擊的策略。
涵蓋的主題:
本報告涵蓋以下主題:
- 全球眼科藥品市場規模、市場區隔及2021年至2036年預測。
- 市場促進因素、障礙和宏觀經濟趨勢
- 已通過核准的藥物類別和主要市場產品,適用於所有主要眼科適應症
- 對 140 個有前景的候選藥物進行管線審查,直至 2026 年。
- 先進的藥物傳輸技術與創新平台
- 2036 年前眼科藥物研發未來藍圖
- 眼科藥物價值鏈分析
- 超過100家領先生態系統公司的公司簡介和策略
- 競爭格局,包括收購、合作和併購
- 為開發商、投資者和醫療保健相關人員提供的策略建議
圖:
截至2036年的研發管線代表了該領域史上最重要的進展之一。三個針對濕性老齡化黃斑部病變(濕性AMD)的III期基因治療項目,分別是4D-150(4D Molecular Therapeutics)、Ixo-vec(禮來/Adverum Biotechnologies)和surabgene lomparvovec(艾伯維/REGENXBIO),預計將抗低藥物藥物市場給藥於單次模式。 AXPAXLI(Ocular Therapeutix)在2026年2月的一項III期臨床試驗中報告其療效優於2mg Aflavelcept,並即將作為首個用於治療濕性AMD的TKI植入提交新藥認證(NDA)。在青光眼領域,iDose TR(Glaukos)累計在2026年第一季在美國實現約5,400萬美元的銷售額,展現出商業化規模的干涉模式。在地圖狀萎縮(GA)領域,vonaprument(Annexon)的III期ARCHER II試驗預計將於2026年下半年提供首個針對GA的大型臨床試驗的功能性視力終點數據。在乾眼症領域,2021年至2025年間,三種First-in-Class作用機制的藥物獲得FDA核准,使其成為2026年至2030年年複合成長率(CAGR)最高的眼科主要治療領域。
《眼科藥物市場(2026-2036):疾病現狀、研發管線、商業性趨勢及預測》報告對2026年至2036年全球眼科藥物市場進行了全面評估,涵蓋疾病現狀、研發開發平臺、競爭格局、生物相似藥競爭、給藥創新和戰略展望。此外,該報告還包含主要眼科藥物研發公司、生物製藥公司、生物相似藥生產商以及貫穿整個價值鏈的專業生物技術公司的概況和策略。
市場規模預測細分為六大治療領域、五種給藥途徑、三種分銷管道、四種藥物類型、兩種處方狀態類別、三種專利狀態類別、五個區域市場和26個各國市場。產品線分析涵蓋六大作用機制類別及四種策略分類的140個有效候選藥物。本報告附帶一套Excel資料表,其中包含所有定量預測資料和完整的產品線資料集。
主要發現:
本報告包含以下主要結論:
- 隨著視網膜疾病、青光眼和乾眼症等疾病的新作用機制核准,目標治療市場不斷擴大,並建立了以前不存在的商業類別,預計到 2026 年,全球眼科藥物銷售額將超過 468 億美元,年複合成長率為 5.7%。
- 在 2026 年的資料集中,與老齡化的黃斑部病變(AMD) 和視網膜疾病、青光眼、乾眼症和糖尿病眼科疾病約佔所有開發平臺候選藥物的 92%。
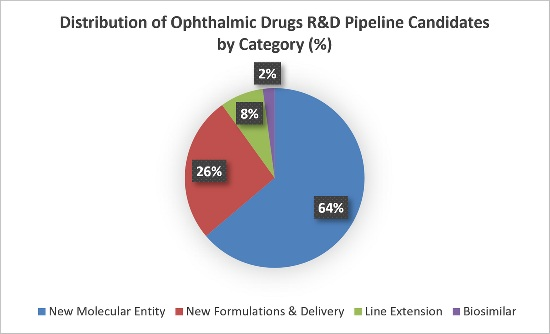
- 細胞和基因療法目前占我們正在研發的藥物的 19%,是作用機制中成長最快的類別,也是自抗 VEGF生物製藥問世以來眼科藥物開發領域最重大的結構性變化。
- 在濕性AMD)領域,競爭的焦點正從減少給藥頻率轉向縮短給藥療程。首個緩釋型酪胺酸激酶抑制劑(TKI)植入在第三期臨床試驗中已證實優於標準抗血管內皮生長因子(VEGF)療法,而三個第三期基因治療計畫的目標是實現單次或每年一次給藥。這些進展可望從根本上重塑眼科藥品市場最大細分領域的規模經濟格局。
- 自2023年以來,地圖狀萎縮症的治療市場已從一片未開發的領域轉變為競爭激烈的市場,但目前已獲已通過核准的治療方法均未顯示出改善視力的功能。新一代補體療法、神經保護療法和基因療法計畫旨在填補這一臨床空白,預計在預測期內將獲得3期臨床試驗的功能終點數據。
- 青光眼藥物治療正經歷結構性轉變,從患者每日眼藥水的眼藥水轉向醫生給藥的緩釋系統。首批經脈絡膜內給藥的藥物在2026年初的美國單季銷售額約為5,400萬美元,而一系列新一代脈絡膜內、淚小管內和經皮給藥平台也即將提交監管部門批准。
- 自 2021 年以來,隨著多項First-in-Class核准,乾眼症市場結構發生了重新評估,預計在 2026 年至 2030 年期間,其銷售額年複合成長率將成為眼科領域成長最快的主要治療類別。此外,預計在整個預測期內,具有不同作用機制的在研發線產品將陸續進入市場,進一步擴大該類別的規模。
- 在眼科治療的各個領域,藥物傳遞技術的創新正變得與分子層面的創新一樣具有重要的商業性價值。生物可吸收植入、脈絡膜傳遞、無防腐劑平台和基因療法正在全面重新定義視網膜疾病、青光眼和乾眼症的治療永續性、依從性和負擔。
需要解答的主要問題:
本報告解答了以下關鍵問題:
- 2026年全球眼科藥品市場規模將達到多少?到2036年銷售額和成長預測如何?
- 在預測期內,哪些治療領域和區域市場具有最高的成長潛力?
- 基因療法和細胞療法如何改變眼科藥物研發的競爭格局和臨床環境?
- 緩釋藥物傳遞技術的創新,無論現在或將來,整體主要眼科適應症產生什麼樣的商業性影響?
- 抗 VEGF 生物相似藥領域的競爭將如何改變市場動態?先行企業又將如何因應?
- 哪些後期研發管線計畫將成為短期內最重要的臨床和商業性催化劑?
- 主要原廠藥專利到期將如何影響市場結構與競爭格局?
- 哪些主要參與者正在塑造眼科藥物市場的競爭格局?哪些戰略決定了它們的地位?
- 宏觀經濟趨勢,例如衛生技術評估 (HTA) 的壓力、價格改革以及數位醫療的整合,對眼科藥物研發公司和投資者意味著什麼?
- 到 2036 年,開發公司、投資者和醫療保健相關人員應該採取哪些策略步驟來最大限度地掌握眼科藥物領域的機會?
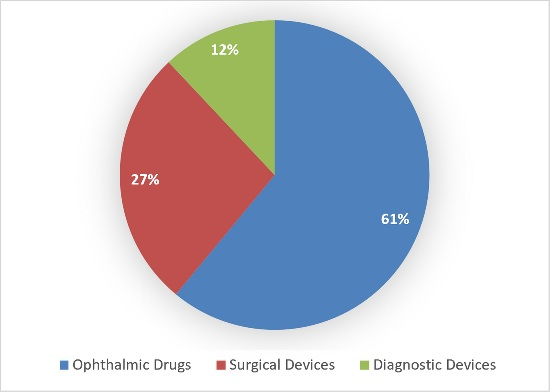
圖:全球眼科產品按細分市場分類的支出百分比(%)
預測分割:
本報告對眼科藥品市場的多個方面進行了詳細的銷售預測,其中包括:
治療區域
- 抗感染藥物
- 抗過敏藥和抗發炎藥
- 乾眼症
- 青光眼
- 視網膜疾病
- 其他疾病
給藥途徑
- 局部(眼藥水/凝膠/眼膏)
- 玻璃體腔內
- 緩釋(SR)植入
- 全身給藥/其他
- 視網膜下
通路
- 醫院/專科藥房
- 普通藥房
- 線上藥局/D2C
藥物種類
- 小分子藥物
- 生物製藥
- 基因和細胞療法
- RNA療法
處方狀態
- 處方藥(RX)
- 非處方藥(OTC)
專利狀態
- 原藥
- 非專利的
- 生物相似藥
當地市場
- 亞太地區
- 歐洲
- 中東和非洲
- 北美洲
- 拉丁美洲和中美洲
各國市場
- 澳洲
- 巴西
- 加拿大
- 中國
- 埃及
- 法國
- 德國
- 希臘
- 印度
- 以色列
- 義大利
- 日本
- 墨西哥
- 荷蘭
- 波蘭
- 葡萄牙
- 俄羅斯
- 沙烏地阿拉伯
- 南非
- 韓國
- 西班牙
- 瑞士
- 台灣
- 土耳其
- 英國
- 美國
目錄
第1章:引言
第2章 眼科藥物概述
- 什麼是眼科藥物?
- 藥物在眼科中的作用
- 常見眼科疾病
- 眼瞼炎
- 白內障
- 霰粒腫
- 結膜炎
- 糖尿病視網膜病變及糖尿病黃斑部水腫(DME)
- 乾眼症
- 青光眼
- 角膜炎
- 黃斑部病變
- 眼內壓升高
- 視網膜靜脈阻塞(RVO)
- 葡萄膜炎
- 地圖狀萎縮(GA)
- 其他條件
- 市場成長促進因素
- 眼科疾病對日常生活的影響
- 眼科疾病發生率上升
- 預期壽命正在延長。
- 糖尿病發生率上升
- 生活方式及其他因素
- 藥物傳輸技術的進步
- 市場限制
- 缺乏意識
- 患者用藥依從性
- 替代療法
- 生物相似藥市場准入與價格壓力
- 醫療保險不足
第3章:主要應用領域和主要治療方法
- 主要應用領域
- 感染疾病物
- 抗過敏藥和抗發炎藥
- 乾眼症
- 青光眼
- 視網膜疾病和其他疾病
- 主要眼科藥物
- Acetazolamide
- 檸檬色雅閣
- 阿柏西普
- 阿普拉克隆定
- 阿奇黴素
- 貝西沙星
- 倍他索
- Bevacizumab
- Bimatoprost
- 溴莫尼定
- 布林佐胺
- 布羅盧西珠單抗
- 溴芬酸
- 卡巴卡爾
- 卡替洛爾
- 西替利嗪眼藥水
- 塞內格明
- Cyclosporine/Cyclosporine
- Ciprofloxacin
- 丙酸氯倍他索眼藥水
- 半胱胺
- 地塞米松
- 雙氯芬酸鈉
- 地氟潑尼酯眼藥水
- 地匹福林
- 澤誇福索
- 多佐胺
- 法利西單抗
- 氟輕鬆
- 氟比洛芬
- 更昔洛韋
- 加替沙星
- 透明質酸(透明質酸)
- Ketorolac
- 拉坦前列素
- 拉坦前列素布諾
- 萊博·諾羅爾
- levofloxacin
- 重新定義 Grast
- 依他凡諾酯
- 烤餅燈籠
- 美他唑胺
- 甲羥孕酮
- 莫西沙星
- 尼帕芬納克
- 內塔蘇吉爾
- 胞漿素
- 氧氟沙星
- 奧洛他定
- 培加帕尼
- 全氟己辛烷
- 苯海拉明
- 皮卡爾派恩
- 雷尼珠單抗
- rebamipide
- 利帕西
- 透明質酸鈉
- 塔福普羅斯特
- 蒂莫羅爾
- 妥布黴素
- 曲前列素
- 曲安奈德
- 離胺酸
- Uno Prostone
- 纈更昔洛韋
- 貝替泊芬
- 長春新鹼
- 沃萊蒂根·內帕博韋克
- 其他及近期核准
- 學名藥和生物類似藥的機遇
- 未來開發平臺
- 新藥研發的關鍵領域
- 管道候選人審查
第4章:眼科藥物的未來發展藍圖與價值鏈
- 未來藍圖
- 價值鏈
第5章:主要市場參與企業
- 4D Molecular Therapeutics
- AbbVie Inc.
- Adverum Biotechnologies Inc. (Eli Lilly and Company)
- Alcon Inc.
- Aldeyra Therapeutics
- Allysta Pharmaceuticals
- ANI Pharmaceuticals Inc.
- Allegro Ophthalmics LLC
- Alteogen Inc.
- Amgen Inc.
- Amorphex Therapeutics
- Annexon Biosciences
- Apellis Pharmaceuticals Inc.
- Astellas Pharma Inc.
- Bausch + Lomb
- Bayer AG
- Benitec Biopharma Inc.
- Bioeq IP AG
- BioLight Life Sciences Ltd.
- Accure Therapeutics
- Lineage Cell Therapeutics Inc.
- Bristol-Myers Squibb (BMS)
- Cell Cure Neurosciences Ltd.
- Chengdu Kanghong Pharmaceuticals Group Ltd.
- Chong Kun Dang Pharmaceutical Corporation
- Colby Pharmaceutical Company
- D.Western Therapeutics Institute Inc.
- Optus Pharmaceuticals Co., Ltd.
- Dompe Farmaceutici SpA
- Euclid Vision Corporation
- Kiora Pharmaceuticals Inc.
- Focus Laboratories (Part of Cormica)
- Fera Pharmaceuticals LLC
- PulseSight Therapeutics SAS
- Fidia Farmaceutici SpA
- Kubota Vision Inc.
- TearSolutions Inc.
- FUJIFILM Cellular Dynamics, Inc. (FCDI)
- Formycon AG
- Gene Signal International SA
- Gensight Biologics SA
- Glaukos Corporation
- Glycadia Pharmaceuticals
- Healios KK
- Helvetic BioPharma
- HitGen Inc.
- ID Pharma Co., Ltd.
- InMed Pharmaceuticals Inc.
- Intas Pharmaceuticals Ltd.
- Isarna Therapeutics
- Johnson & Johnson Vision
- KalVista Pharmaceuticals Inc.
- Kissei Pharmaceutical Co., Ltd.
- Kodiak Sciences Inc.
- Kowa Company
- Laboratorios SALVAT SA
- Lee's Pharmaceutical Holdings
- Laboratorios Sophia
- Lubris BioPharma LLC
- MacuCLEAR Inc.
- Keenova Therapeutics
- Mannin Research Inc.
- Mati Therapeutics Inc.
- MC2 Therapeutics A/S
- Merck & Co.
- MimeTech Srl
- Mimetogen Pharmaceuticals
- Mitotech SA
- Mundipharma International Limited
- NeuMedics Inc.
- Neurotech Pharmaceuticals Inc.
- Nicox
- Novaliq GmbH
- Novartis AG
- NovelMed Therapeutics Inc.
- Ocugen Inc.
- Ocular Therapeutix Inc.
- Oculis Holding AG
- InflammX Therapeutics
- Omeros Corporation
- Oncolys BioPharma Inc.
- ONL Therapeutics Inc.
- ONO Pharmaceutical Co
- Otero Therapeutics
- Otsuka Pharmaceutical Co.
- Oxford BioMedica
- Parion Sciences Inc.
- Peregrine Ophthalmic
- Pfizer Inc.
- pH Pharma Co
- Sylentis (PharmaMar)
- Q BioMed Inc.
- Radikal Therapeutics Inc.
- Regeneron Pharmaceuticals Inc.
- RegeneRx Biopharmaceuticals Inc.
- REGENXBIO Inc.
- Replenish Inc.
- Roche Holding (F. Hoffmann-La Roche)
- Santen Pharmaceutical Company
- Seikagaku Corporation
- Senju Pharmaceutical Company
- SPARC (Sun Pharma Advanced Research Company)
- Spark Therapeutics Inc.
- STADA Arzneimittel AG
- Stealth BioTherapeutics
- Stemedica Cell Technologies
- Sumitomo Pharma
- Sun Pharma (Sun Pharmaceutical Industries)
- Taejoon Pharm
- Teva Pharmaceutical Industries
- Laboratories THEA
- TikoMed
- Ube Industries
- Vision Medicines Inc.
- Wakamoto Company
- Xbrane Biopharma
第6章:市場規模的計算與預測
- 全球眼科藥物市場展望
- 按治療領域分類的收入
- 依行政途徑分類的收入(RoA)
- 按銷售管道分類的收入
- 按藥品類型分類的收入
- 按處方箋類型分類的收入
- 按專利狀態分類的收入
- 按地區分類的收入
- 主要各國市場
- 澳洲
- 巴西
- 加拿大
- 中國
- 埃及
- 法國
- 德國
- 希臘
- 印度
- 以色列
- 義大利
- 日本
- 墨西哥
- 荷蘭
- 波蘭
- 葡萄牙
- 俄羅斯
- 沙烏地阿拉伯
- 南非
- 韓國
- 西班牙
- 瑞士
- 台灣
- 土耳其
- 英國
- 美國
第7章:結論與策略建議
- 市場預期成長的原因有哪些?
- 競爭激烈的產業格局:收購、合作與併購
- 低成本國家:增加對研發和製造業的投資。
- 研發開發平臺回顧:新治療方法的展望
- 聯合治療:利用多種作用機制
- 邁向新的配送路線
- 提高患者用藥依從性
- 宏觀經濟狀況:疫情後情勢、醫療系統壓力與數位轉型。
- 區域展望:哪個國家成長潛力最大?
- 哪一類治療藥物在市場上佔據主導地位?
- 策略建議
Synopsis:
The global ophthalmic drugs market is at an inflection point. Demographic ageing, the global diabetes epidemic, and a wave of mechanistically novel approvals since 2023 have simultaneously expanded the addressable patient population, opened commercial categories that did not exist three years ago, and set in motion a structural transition in how ophthalmic diseases are treated. This transition is moving from chronic daily self-administration toward physician-administered sustained-release systems and, ultimately, toward single-administration gene therapy platforms. These shifts are occurring across all major disease areas concurrently and at a pace that is compressing the typical product lifecycle timeline for incumbent therapies.
Global ophthalmic drug revenues reached approximately $46.8 billion in 2026 and are projected to grow at a CAGR of 5.7% through 2030, driven by the commercial maturation of biologic anti-VEGF therapies, the entry of the first approved treatments for geographic atrophy, the structural re-rating of the dry eye disease market, and the progressive transition toward gene therapy and sustained-release delivery platforms.
The market is undergoing structural bifurcation. The established anti-VEGF segment faces accelerating biosimilar competition following the approval of multiple aflibercept and ranibizumab biosimilars, with net pricing compression intensifying through 2027 as remaining entrants complete patent settlement timelines. Simultaneously, the 2023 approval class opened premium-priced categories with no near-term generic competition: pegcetacoplan and avacincaptad pegol for geographic atrophy, perfluorohexyloctane and water-free cyclosporine for dry eye disease, travoprost intracameral implant for glaucoma, and lotilaner for Demodex blepharitis. Faricimab (Vabysmo), the first bispecific antibody approved in ophthalmology, exceeded $4 billion in annual revenues in 2024 and has repositioned the wet AMD standard of care around mechanism differentiation and extended durability. Eylea HD received FDA approval in April 2026 for dosing intervals of up to 20 weeks, the longest approved interval for any injectable anti-VEGF, extending Regeneron's franchise defense strategy against biosimilar displacement.
Topics Covered:
The report covers the following topics:
- Global ophthalmic drugs market sizing, segmentation, and forecasts from 2021 to 2036
- Market drivers, barriers, and macro-environmental trends
- Approved drug classes and leading commercial products across all major ophthalmic indications
- 2026 pipeline review across 140 active candidates
- Advanced drug delivery technologies and innovation platforms
- Future roadmap for ophthalmic drug development to 2036
- Ophthalmic drugs value chain analysis
- Company profiles and strategies of over 100 leading ecosystem players
- Competitive landscape including acquisitions, alliances, and consolidation
- Strategic recommendations for developers, investors, and healthcare stakeholders
Sample Figure:
The pipeline through 2036 is amongst the most consequential in the history of the category. Three Phase III gene therapy programs targeting wet AMD, specifically 4D-150 (4D Molecular Therapeutics), Ixo-vec (Eli Lilly/Adverum Biotechnologies), and surabgene lomparvovec (AbbVie/REGENXBIO), carry the potential to restructure the anti-VEGF market from a chronic injection model to single or infrequent administration. AXPAXLI (Ocular Therapeutix) reported Phase III superiority over aflibercept 2 mg in February 2026 and is approaching NDA submission as the first TKI implant for wet AMD. In glaucoma, iDose TR (Glaukos) generated approximately $54 million in US revenue in a single quarter in early 2026, validating the interventional model at commercial scale. In geographic atrophy, the Phase III ARCHER II trial of vonaprument (Annexon) is expected to deliver the first functional vision endpoint data from a pivotal GA trial in H2 2026. In dry eye disease, three first-in-class mechanisms received FDA approval between 2021 and 2025, making it the fastest-growing major therapeutic category in ophthalmology by revenue CAGR over the 2026 to 2030 period.
The “Ophthalmic Drugs Market 2026 to 2036: Disease Landscape, Pipeline, Commercial Dynamics and Forecasts” report provides a comprehensive assessment of the global ophthalmic drugs market from 2026 to 2036, covering the disease landscape, R&D pipeline, competitive dynamics, biosimilar competition, delivery innovation, and strategic outlook. The report additionally includes profiles and strategies of leading ophthalmic drug developers, biopharmaceutical companies, biosimilar manufacturers, and specialist biotechs active across the value chain.
Market size forecasts are segmented across 6 therapeutic categories, 5 routes of administration, 3 distribution channels, 4 drug types, 2 prescription status categories, 3 patent status categories, 5 regional markets, and 26 country markets. The pipeline analysis covers 140 active candidates across six mechanistic classes and four strategic classifications. The report is accompanied by an Excel datasheet suite covering all quantitative forecast data and the full pipeline dataset.
Key Findings:
The report has the following key findings:
- Global ophthalmic drug revenues are estimated to surpass $46.8 billion in 2026, with a compound annual growth rate of 5.7%, as mechanistically novel approvals across retinal disease, glaucoma, and dry eye disease expand the addressable treated market and establish commercial categories where none previously existed.
- AMD and retinal disease, glaucoma, dry eye disease, and diabetic eye disease collectively account for approximately 92% of all active pipeline candidates in the 2026 dataset.
- Cell and gene therapies now constitute 19% of the active pipeline, the fastest-growing mechanistic category and the most structurally significant shift in ophthalmic drug development since the introduction of anti-VEGF biologics.
- The competitive frontier in wet AMD has moved beyond injection frequency reduction toward duration elimination. The first sustained-release TKI implant has reported Phase 3 superiority over the anti-VEGF standard of care, and three Phase 3 gene therapy programs are targeting single or annual administration, developments expected to fundamentally restructure the volume economics of the largest segment in the ophthalmic drugs market.
- Geographic atrophy has transitioned from an unaddressed indication to an actively contested market since 2023, yet neither approved therapy has demonstrated functional vision benefit. The next generation of complement, neuroprotective, and gene therapy programs is targeting this clinical gap, with Phase 3 functional endpoint data anticipated within the forecast period.
- Glaucoma pharmacotherapy is undergoing a structural shift from daily patient-administered drops toward physician-administered sustained-release systems. The first intracameral procedural pharmaceutical generated approximately $54 million in US revenues in a single quarter in early 2026, and a pipeline of next-generation intracameral, intracanalicular, and transdermal platforms is approaching regulatory submission.
- The dry eye disease market has been structurally re-rated by multiple first-in-class approvals since 2021 and represents the fastest-growing major therapeutic category in ophthalmology by revenue CAGR over the 2026 to 2030 period, with further mechanism-diverse pipeline entrants expected to deepen the category through the forecast period.
- Drug delivery innovation has become as commercially consequential as molecular innovation across all ophthalmic therapeutic categories. Bioresorbable implants, suprachoroidal delivery, preservative-free platforms, and gene therapy are collectively redefining durability, compliance, and treatment burden across retinal disease, glaucoma, and dry eye disease.
Key Questions Answered:
The report provides answers to the following key questions:
- How large is the global ophthalmic drugs market in 2026, and what is the revenue and growth outlook through 2036?
- Which therapeutic categories and regional markets offer the highest growth potential over the forecast period?
- How are gene and cell therapies reshaping the competitive and clinical landscape of ophthalmic drug development?
- What is the current and future commercial impact of sustained-release drug delivery innovation across all major ophthalmic indications?
- How will biosimilar competition in the anti-VEGF segment reshape market dynamics, and how are innovator companies responding?
- Which late-stage pipeline programs represent the most significant near-term clinical and commercial catalysts?
- How will patent expirations of major innovator drugs affect market structure and competitive positioning?
- Who are the key companies shaping the ophthalmic drugs competitive landscape, and what strategies are defining their positions?
- What are the implications of macro-environmental trends including health technology assessment pressures, pricing reform, and digital health integration for ophthalmic drug developers and investors?
- What strategic actions should developers, investors, and healthcare stakeholders take to capitalize on the opportunities in ophthalmic drugs through 2036?
Sample Figure: Global Ophthalmic Product Spending by Submarket (%)
Forecast Segmentation:
The report provides detailed revenue forecasts across multiple dimensions of the ophthalmic drugs market, including:
Therapeutic Area
- Anti-Infectives
- Allergy & Anti-Inflammatory
- Dry Eye
- Glaucoma
- Retinal Disorders
- Other Disorders
Route of Administration
- Topical (Eye Drops / Gels / Ointments)
- Intravitreal
- Sustained-Release (SR) Implants
- Systemic / Others
- Sub Retinal
Distribution Channel
- Hospital / Specialty Pharmacy
- Retail Pharmacy
- Online Pharmacies / D2C
Drug Type
- Small Molecules
- Biologics
- Gene & Cell Therapies
- RNA Therapies
Prescription Status
- Prescription (RX)
- Over-The-Counter (OTC)
Patent Status
- Originator
- Generic
- Biosimilar
Regional Markets
- Asia Pacific
- Europe
- Middle East & Africa
- North America
- Latin & Central America
Country Markets
- Australia
- Brazil
- Canada
- China
- Egypt
- France
- Germany
- Greece
- India
- Israel
- Italy
- Japan
- Mexico
- Netherlands
- Poland
- Portugal
- Russia
- Saudi Arabia
- South Africa
- South Korea
- Spain
- Switzerland
- Taiwan
- Turkey
- UK
- USA
Table of Contents
Chapter 1: Introduction
- 1.1 Executive Summary
- 1.2 Topics Covered
- 1.3 Forecast Segmentation
- 1.4 Key Questions Answered
- 1.5 Key Findings
- 1.6 Methodology
- 1.7 Target Audience
- 1.8 Companies & Organizations Mentioned
Chapter 2: An Overview of Ophthalmic Drugs
- 2.1 What Are Ophthalmic Drugs?
- 2.2 The Role of Drugs in Ophthalmology
- 2.3 Common Eye Disorders
- 2.3.1 Blepharitis
- 2.3.1.1 Anterior Blepharitis
- 2.3.1.2 Posterior Blepharitis
- 2.3.2 Cataracts
- 2.3.3 Chalazion
- 2.3.4 Conjunctivitis
- 2.3.4.1 Allergic Conjunctivitis
- 2.3.4.2 Infective Conjunctivitis
- 2.3.4.3 Irritant Conjunctivitis
- 2.3.5 Diabetic Retinopathy & DME (Diabetic Macular Edema)
- 2.3.6 Dry Eye Disease
- 2.3.7 Glaucoma
- 2.3.7.1 Open-Angle Glaucoma
- 2.3.7.2 Angle-Closure Glaucoma
- 2.3.7.3 Secondary Glaucoma
- 2.3.7.4 Congenital (Infantile) Glaucoma
- 2.3.7.5 NTG (Normal-Tension Glaucoma)
- 2.3.8 Keratitis
- 2.3.9 Macular Degeneration
- 2.3.9.1 Dry AMD
- 2.3.9.2 Wet AMD
- 2.3.10 Ocular Hypertension
- 2.3.11 RVO (Retinal Vein Occlusion)
- 2.3.11.1 CRVO (Central Retinal Vein Occlusion)
- 2.3.12 Uveitis
- 2.3.12.1 Anterior Uveitis
- 2.3.12.2 Intermediate Uveitis
- 2.3.12.3 Posterior Uveitis
- 2.3.13 Geographic Atrophy (GA)
- 2.3.14 Other Conditions
- 2.3.1 Blepharitis
- 2.4 Market Growth Drivers
- 2.4.1 Impact of Eye Disorders on Daily Life
- 2.4.2 Growing Prevalence of Eye Disorders
- 2.4.3 Longevity on the Rise
- 2.4.4 Rising Incidences of Diabetes
- 2.4.5 Lifestyle Habits & Other Factors
- 2.4.6 Advances in Drug Delivery Technologies
- 2.5 Market Barriers
- 2.5.1 Lack of Awareness
- 2.5.2 Patient Compliance
- 2.5.3 Alternative Healing Options
- 2.5.4 Biosimilar Entry and Pricing Pressure
- 2.5.5 Lack of Healthcare Insurance
Chapter 3: Key Application Areas & Leading Therapies
- 3.1 Key Application Areas
- 3.1.1 Anti-Infectives
- 3.1.2 Allergy & Anti-Inflammatory
- 3.1.3 Dry Eye
- 3.1.4 Glaucoma
- 3.1.5 Retinal & Other Disorders
- 3.2 Leading Ophthalmic Drugs
- 3.2.1 Acetazolamide
- 3.2.2 Acoltremon
- 3.2.3 Aflibercept
- 3.2.4 Apraclonidine
- 3.2.5 Azithromycin
- 3.2.6 Besifloxacin
- 3.2.7 Betaxolol
- 3.2.8 Bevacizumab
- 3.2.9 Bimatoprost
- 3.2.10 Brimonidine
- 3.2.11 Brinzolamide
- 3.2.12 Brolucizumab
- 3.2.13 Bromfenac
- 3.2.14 Carbachol
- 3.2.15 Carteolol
- 3.2.16 Cetirizine ophthalmic solution
- 3.2.17 Cenegermin
- 3.2.18 Ciclosporin/Cyclosporine
- 3.2.19 Ciprofloxacin
- 3.2.20 Clobetasol Propionate Ophthalmic
- 3.2.21 Cysteamine
- 3.2.22 Dexamethasone
- 3.2.23 Diclofenac
- 3.2.24 Difluprednate ophthalmic
- 3.2.25 Dipivefrin
- 3.2.26 Diquafosol
- 3.2.27 Dorzolamide
- 3.2.28 Faricimab
- 3.2.29 Fluocinolone
- 3.2.30 Flurbiprofen
- 3.2.31 Ganciclovir
- 3.2.32 Gatifloxacin
- 3.2.33 Hyaluronic Acid (Hyaluronan)
- 3.2.34 Ketorolac
- 3.2.35 Latanoprost
- 3.2.36 Latanoprostene Bunod
- 3.2.37 Levobunolol
- 3.2.38 Levofloxacin
- 3.2.39 Lifitegrast
- 3.2.40 Loteprednol Etabonate
- 3.2.41 Lotilaner
- 3.2.42 Methazolamide
- 3.2.43 Metipranolol
- 3.2.44 Moxifloxacin
- 3.2.45 Nepafenac
- 3.2.46 Netarsudil
- 3.2.47 Ocriplasmin
- 3.2.48 Ofloxacin
- 3.2.49 Olopatadine
- 3.2.50 Pegaptanib
- 3.2.51 Perfluorohexyloctane
- 3.2.52 Phenylephrine
- 3.2.53 Pilocarpine
- 3.2.54 Ranibizumab
- 3.2.55 Rebamipide
- 3.2.56 Ripasudil
- 3.2.57 Sodium Hyaluronate
- 3.2.58 Tafluprost
- 3.2.59 Timolol
- 3.2.60 Tobramycin
- 3.2.61 Travoprost
- 3.2.62 Triamcinolone
- 3.2.63 Trifluridine
- 3.2.64 Unoprostone
- 3.2.65 Valganciclovir
- 3.2.66 Verteporfin
- 3.2.67 Vincristine
- 3.2.68 Voretigene Neparvovec
- 3.2.69 Others & Recent Approvals
- 3.2.69.1 Bimatoprost SR (Sustained-Release)
- 3.2.69.2 Netarsudil/Latanoprost ophthalmic solution
- 3.2.69.3 Omidenepag Isopropyl
- 3.2.69.4 Vizz
- 3.3 Opportunities for Generic & Biosimilar Drugs
- 3.4 Future R&D Pipeline
- 3.4.1 Key Areas of New Drug Development
- 3.4.2 Review of Pipeline Candidates
- 3.4.2.1 AMD & Retinal Disorders
- 3.4.2.2 Diabetic Eye Disease
- 3.4.2.3 Dry Eye Disease
- 3.4.2.4 Glaucoma & Ocular Hypertension
- 3.4.2.5 Ocular Immunology
- 3.4.2.6 Other Indications
Chapter 4: Ophthalmic Drugs Future Roadmap & Value Chain
- 4.1 Future Roadmap
- 4.1.1 Pre-2030: Sustained Delivery and Novel Mechanisms Enter the Market
- 4.1.2 2030 – 2033: Gene and Cell Therapy Reach Commercial Scale
- 4.1.3 2033 – 2036 & Beyond: Precision, Durability, and AI-Integrated Care
- 4.2 Value Chain
- 4.2.1 API Manufacturers & Enabling Technology Providers
- 4.2.2 Generic and Biosimilar Drug Manufacturers
- 4.2.3 Innovator Pharmaceutical Companies
- 4.2.4 Regional Distributors
- 4.2.5 Healthcare Providers, Pharmacies & Drug Stores
Chapter 5: Key Market Players
- 5.1 4D Molecular Therapeutics
- 5.2 AbbVie Inc.
- 5.3 Adverum Biotechnologies Inc. (Eli Lilly and Company)
- 5.4 Alcon Inc.
- 5.5 Aldeyra Therapeutics
- 5.6 Allysta Pharmaceuticals
- 5.7 ANI Pharmaceuticals Inc.
- 5.8 Allegro Ophthalmics LLC
- 5.9 Alteogen Inc.
- 5.10 Amgen Inc.
- 5.11 Amorphex Therapeutics
- 5.12 Annexon Biosciences
- 5.13 Apellis Pharmaceuticals Inc.
- 5.14 Astellas Pharma Inc.
- 5.15 Bausch + Lomb
- 5.16 Bayer AG
- 5.17 Benitec Biopharma Inc.
- 5.18 Bioeq IP AG
- 5.19 BioLight Life Sciences Ltd.
- 5.20 Accure Therapeutics
- 5.21 Lineage Cell Therapeutics Inc.
- 5.22 Bristol-Myers Squibb (BMS)
- 5.23 Cell Cure Neurosciences Ltd.
- 5.24 Chengdu Kanghong Pharmaceuticals Group Ltd.
- 5.25 Chong Kun Dang Pharmaceutical Corporation
- 5.26 Colby Pharmaceutical Company
- 5.27 D.Western Therapeutics Institute Inc.
- 5.28 Optus Pharmaceuticals Co., Ltd.
- 5.29 Dompe Farmaceutici S.p.A.
- 5.30 Euclid Vision Corporation
- 5.31 Kiora Pharmaceuticals Inc.
- 5.32 Focus Laboratories (Part of Cormica)
- 5.33 Fera Pharmaceuticals LLC
- 5.34 PulseSight Therapeutics SAS
- 5.35 Fidia Farmaceutici S.p.A.
- 5.36 Kubota Vision Inc.
- 5.37 TearSolutions Inc.
- 5.38 FUJIFILM Cellular Dynamics, Inc. (FCDI)
- 5.39 Formycon AG
- 5.40 Gene Signal International SA
- 5.41 Gensight Biologics S.A.
- 5.42 Glaukos Corporation
- 5.43 Glycadia Pharmaceuticals
- 5.44 Healios K.K.
- 5.45 Helvetic BioPharma
- 5.46 HitGen Inc.
- 5.47 ID Pharma Co., Ltd.
- 5.48 InMed Pharmaceuticals Inc.
- 5.49 Intas Pharmaceuticals Ltd.
- 5.50 Isarna Therapeutics
- 5.51 Johnson & Johnson Vision
- 5.52 KalVista Pharmaceuticals Inc.
- 5.53 Kissei Pharmaceutical Co., Ltd.
- 5.54 Kodiak Sciences Inc.
- 5.55 Kowa Company
- 5.56 Laboratorios SALVAT S.A.
- 5.57 Lee's Pharmaceutical Holdings
- 5.58 Laboratorios Sophia
- 5.59 Lubris BioPharma LLC
- 5.60 MacuCLEAR Inc.
- 5.61 Keenova Therapeutics
- 5.62 Mannin Research Inc.
- 5.63 Mati Therapeutics Inc.
- 5.64 MC2 Therapeutics A/S
- 5.65 Merck & Co.
- 5.66 MimeTech S.r.l.
- 5.67 Mimetogen Pharmaceuticals
- 5.68 Mitotech S.A.
- 5.69 Mundipharma International Limited
- 5.70 NeuMedics Inc.
- 5.71 Neurotech Pharmaceuticals Inc.
- 5.72 Nicox
- 5.73 Novaliq GmbH
- 5.74 Novartis AG
- 5.75 NovelMed Therapeutics Inc.
- 5.76 Ocugen Inc.
- 5.77 Ocular Therapeutix Inc.
- 5.78 Oculis Holding AG
- 5.79 InflammX Therapeutics
- 5.80 Omeros Corporation
- 5.81 Oncolys BioPharma Inc.
- 5.82 ONL Therapeutics Inc.
- 5.83 ONO Pharmaceutical Co
- 5.84 Otero Therapeutics
- 5.85 Otsuka Pharmaceutical Co.
- 5.86 Oxford BioMedica
- 5.87 Parion Sciences Inc.
- 5.88 Peregrine Ophthalmic
- 5.89 Pfizer Inc.
- 5.90 pH Pharma Co
- 5.91 Sylentis (PharmaMar)
- 5.92 Q BioMed Inc.
- 5.93 Radikal Therapeutics Inc.
- 5.94 Regeneron Pharmaceuticals Inc.
- 5.95 RegeneRx Biopharmaceuticals Inc.
- 5.96 REGENXBIO Inc.
- 5.97 Replenish Inc.
- 5.98 Roche Holding (F. Hoffmann-La Roche)
- 5.99 Santen Pharmaceutical Company
- 5.100 Seikagaku Corporation
- 5.101 Senju Pharmaceutical Company
- 5.102 SPARC (Sun Pharma Advanced Research Company)
- 5.103 Spark Therapeutics Inc.
- 5.104 STADA Arzneimittel AG
- 5.105 Stealth BioTherapeutics
- 5.106 Stemedica Cell Technologies
- 5.107 Sumitomo Pharma
- 5.108 Sun Pharma (Sun Pharmaceutical Industries)
- 5.109 Taejoon Pharm
- 5.110 Teva Pharmaceutical Industries
- 5.111 Laboratories THEA
- 5.112 TikoMed
- 5.113 Ube Industries
- 5.114 Vision Medicines Inc.
- 5.115 Wakamoto Company
- 5.116 Xbrane Biopharma
Chapter 6: Market Sizing & Forecasts
- 6.1 Global Outlook for Ophthalmic Drugs
- 6.2 Revenue by Therapeutic Area
- 6.2.1 Anti-Infectives
- 6.2.2 Allergy & Anti-Inflammatory
- 6.2.3 Dry Eye
- 6.2.4 Glaucoma
- 6.2.5 Retinal Disorders
- 6.2.6 Other Ophthalmic Disorders
- 6.3 Revenue by Route of Administration (RoA)
- 6.3.1 Topical (Eye Drops / Gels / Ointments)
- 6.3.2 Intravitreal
- 6.3.3 Sustained-Release (SR) Implants
- 6.3.4 Systemic / Others
- 6.3.5 Sub Retinal
- 6.4 Revenue by Distribution Channel
- 6.4.1 Hospital / Specialty Pharmacy
- 6.4.2 Retail Pharmacy
- 6.4.3 Online Pharmacies / D2C
- 6.5 Revenue by Drug Type
- 6.5.1 Small Molecules
- 6.5.2 Biologics
- 6.5.3 Gene & Cell Therapies
- 6.5.4 RNA Therapies
- 6.6 Revenue by Prescription Status
- 6.6.1 Prescription (RX)
- 6.6.2 Over-The-Counter (OTC)
- 6.7 Revenue by Patent Status
- 6.7.1 Originator
- 6.7.2 Generic
- 6.7.3 Biosimilar
- 6.8 Revenue by Region
- 6.8.1 Asia Pacific
- 6.8.2 Europe
- 6.8.3 Middle East & Africa
- 6.8.4 Latin & Central America
- 6.8.5 North America
- 6.9 Top Country Markets
- 6.9.1 Australia
- 6.9.2 Brazil
- 6.9.3 Canada
- 6.9.4 China
- 6.9.5 Egypt
- 6.9.6 France
- 6.9.7 Germany
- 6.9.8 Greece
- 6.9.9 India
- 6.9.10 Israel
- 6.9.11 Italy
- 6.9.12 Japan
- 6.9.13 Mexico
- 6.9.14 Netherlands
- 6.9.15 Poland
- 6.9.16 Portugal
- 6.9.17 Russia
- 6.9.18 Saudi Arabia
- 6.9.19 South Africa
- 6.9.20 South Korea
- 6.9.21 Spain
- 6.9.22 Switzerland
- 6.9.23 Taiwan
- 6.9.24 Turkey
- 6.9.25 UK
- 6.9.26 USA
Chapter 7: Conclusion & Strategic Recommendations
- 7.1 Why is the Market Poised to Grow?
- 7.2 Competitive Industry Landscape: Acquisitions, Alliances & Consolidation
- 7.3 Lower-Cost Countries: Increasing R&D and Manufacturing Investments
- 7.4 R&D Pipeline Review: Prospects of New Therapies
- 7.4.1 Long-Acting VEGF Inhibitors for Wet AMD
- 7.4.2 Dual-Inhibition Bispecifics: Beyond VEGF Monotherapy
- 7.4.3 Emerging Mechanisms for Diabetic Eye Disease
- 7.4.4 Dry AMD and Geographic Atrophy: Building Beyond the First Approvals
- 7.4.5 Sustained Release Platforms for Glaucoma
- 7.4.6 ROCK & Other Kinase Inhibitors for Glaucoma
- 7.4.7 Prostaglandin EP2, EP3 & FP Receptor Agonists
- 7.4.8 NO (Nitric Oxide) Donors
- 7.4.9 New Drug Classes for Dry Eye Disease and Others
- 7.4.10 Gene & Cell Therapies
- 7.4.11 Other Programs
- 7.5 Combination Therapy: Exploiting Multiple Mechanisms of Action
- 7.5.1 Fixed-Dose Combination Topical Therapy for Glaucoma
- 7.5.2 Bispecific Biologics: Faricimab and the Dual-Mechanism Paradigm in Retinal Disease
- 7.5.3 Complement Inhibition Combinations in Geographic Atrophy
- 7.5.4 Anti-VEGF Combined with Tyrosine Kinase Inhibitors
- 7.5.5 Gene Therapy and Pharmacological Adjuncts
- 7.5.6 Sustained-Release Dual-Payload Devices
- 7.5.7 Regulatory Considerations for Combination of Ophthalmic Products
- 7.6 Towards New Delivery Routes
- 7.6.1 Oral Delivery
- 7.6.2 Injectables
- 7.6.3 Implants
- 7.6.3.1 Surface Implants & Contact Lenses
- 7.6.3.2 Subconjunctival Implants
- 7.6.3.3 Intrascleral Implants
- 7.6.3.4 Intracameral Implants
- 7.6.3.5 Intravitreal Implants
- 7.6.4 Punctal Plugs
- 7.6.5 Eye Drops for Posterior Segment Disease
- 7.6.6 Gel-Forming Drops
- 7.6.7 Nanotechnology
- 7.6.8 Iontophoresis
- 7.6.9 High Precision Micro-Dosing
- 7.7 Improving Patient Compliance
- 7.7.1 The Trend of Treatment Discontinuation
- 7.7.2 Reducing Preservatives
- 7.8 Macro-Environmental Context: Post-Pandemic Landscape, Health System Pressures, and Digital Transformation
- 7.9 Geographic Outlook: Which Countries Offer the Highest Growth Potential?
- 7.10 Which Therapeutic Class Leads the Market?
- 7.11 Strategic Recommendations
List of Figures
- Figure 1: Common Eye Disorders
- Figure 2: Global Ophthalmic Product Spending by Submarket (%)
- Figure 3: Patent Expiration Dates for Key Innovator Ophthalmic Drugs
- Figure 4: Distribution of Ophthalmic Drugs R&D Pipeline Candidates by Therapeutic Area (%)
- Figure 5: Distribution of Ophthalmic Drugs R&D Pipeline Candidates by Mechanistic Class (%)
- Figure 6: Distribution of Ophthalmic Drugs R&D Pipeline Candidates by Category (%)
- Figure 7: Distribution of Ophthalmic Drugs R&D Pipeline Candidates by Phase (%)
- Figure 8: AMD & Retinal Disorders Drug Developmental Pipeline Candidates Table
- Figure 9: A Diabetic Eye Disease Drug Developmental Pipeline Candidates Table
- Figure 10: Dry Eye Disease Drug Developmental Pipeline Candidates Table
- Figure 11: Glaucoma & Ocular Hypertension Drug Developmental Pipeline Candidates Table
- Figure 12: Ocular Immunology Drug Developmental Pipeline Candidates Table
- Figure 13: Other Indications Drug Developmental Pipeline Candidates Table
- Figure 14: Ophthalmic Drugs Future Roadmap: 2026 - 2036
- Figure 15: Ophthalmic Drugs Value Chain
- Figure 16: Global Ophthalmic Drugs Revenue ($ Billion): 2026 - 2036
- Figure 17: Global Ophthalmic Drugs Revenue Table ($ Million): 2026 - 2036
- Figure 18: Global Ophthalmic Drugs Revenue Table by Therapeutic Area ($ Million): 2026 - 2036
- Figure 19: Global Ophthalmic Drugs Revenue by Therapeutic Area ($ Billion): 2026 - 2036
- Figure 20: Ophthalmic Anti-Infective Drugs Revenue ($ Billion): 2026 - 2036
- Figure 21: Ophthalmic Allergy & Anti-Inflammatory Drugs Revenue ($ Billion): 2026 - 2036
- Figure 22: Dry Eye Drugs Revenue ($ Billion): 2026 - 2036
- Figure 23: Glaucoma Drugs Revenue ($ Billion): 2026 - 2036
- Figure 24: Retinal Disorder Drugs Revenue ($ Billion): 2026 - 2036
- Figure 25: Other Ophthalmic Disorder Drugs Revenue ($ Billion): 2026 - 2036
- Figure 26: Global Ophthalmic Drugs Revenue Table by Route of Administration ($ Billion): 2026 - 2036
- Figure 27: Global Ophthalmic Drugs Revenue by Route of Administration ($ Billion): 2026 - 2036
- Figure 28: Topical Ophthalmic Drugs Revenue ($ Billion): 2026 - 2036
- Figure 29: Intravitreal Ophthalmic Drugs Revenue ($ Billion): 2026 - 2036
- Figure 30: Sustained-Release (SR) Implants Ophthalmic Drugs Revenue ($ Billion): 2026 - 2036
- Figure 31: Systemic / Others Ophthalmic Drugs Revenue ($ Billion): 2026 - 2036
- Figure 32: Sub Retinal Ophthalmic Drugs Revenue ($ Billion): 2026 - 2036
- Figure 33: Global Ophthalmic Drugs Revenue Table by Distribution Channel ($ Million): 2026 - 2036
- Figure 34: Global Ophthalmic Drugs Revenue by Distribution Channel ($ Billion): 2026 - 2036
- Figure 35: Hospital / Specialty Pharmacy Ophthalmic Drugs Revenue ($ Billion): 2026 - 2036
- Figure 36: Retail Pharmacy Ophthalmic Drugs Revenue ($ Billion): 2026 - 2036
- Figure 37: Online Pharmacies / D2C Ophthalmic Drugs Revenue ($ Billion): 2026 - 2036
- Figure 38: Global Ophthalmic Drugs Revenue Table by Drug Type ($ Billion): 2026 - 2036
- Figure 39: Global Ophthalmic Drugs Revenue by Drug Type ($ Billion): 2026 - 2036
- Figure 40: Small Molecule Ophthalmic Drugs Revenue ($ Billion): 2026 - 2036
- Figure 41: Biologic Ophthalmic Drugs Revenue ($ Billion): 2026 - 2036
- Figure 42: Gene & Cell Therapies Ophthalmic Drugs Revenue ($ Billion): 2026 - 2036
- Figure 43: RNA Therapies Ophthalmic Drugs Revenue ($ Billion): 2026 - 2036
- Figure 44: Global Ophthalmic Drugs Revenue Table by Prescription Status ($ Million): 2026 - 2036
- Figure 45: Global Ophthalmic Drugs Revenue by Prescription Status ($ Billion): 2026 - 2036
- Figure 46: Prescription (RX) Ophthalmic Drugs Revenue ($ Billion): 2026 - 2036
- Figure 47: Over-The-Counter (OTC) Ophthalmic Drugs Revenue ($ Billion): 2026 - 2036
- Figure 48: Global Ophthalmic Drugs Revenue Table by Patent Status ($ Million): 2026 - 2036
- Figure 49: Global Ophthalmic Drugs Revenue by Patent Status ($ Billion): 2026 - 2036
- Figure 50: Originator Ophthalmic Drugs Revenue ($ Billion): 2026 - 2036
- Figure 51: Generic Ophthalmic Drugs Revenue ($ Billion): 2026 - 2036
- Figure 52: Biosimilar Ophthalmic Drugs Revenue ($ Billion): 2026 - 2036
- Figure 53: Global Ophthalmic Drugs Revenue Table by Region ($ Million): 2026 - 2036
- Figure 54: Global Ophthalmic Drugs Revenue by Region ($ Billion): 2026 - 2036
- Figure 55: Asia Pacific Ophthalmic Drugs Revenue ($ Billion): 2026 - 2036
- Figure 56: Europe Ophthalmic Drugs Revenue ($ Billion): 2026 - 2036
- Figure 57: Middle East & Africa Ophthalmic Drugs Revenue ($ Billion): 2026 - 2036
- Figure 58: Latin & Central America Ophthalmic Drugs Revenue ($ Billion): 2026 - 2036
- Figure 59: North America Ophthalmic Drugs Revenue ($ Billion): 2026 - 2036
- Figure 60: Top 20 Ophthalmic Drugs Country Markets Table by Revenue ($ Million): 2026 - 2036
- Figure 61: Australia Ophthalmic Drugs Revenue ($ Million): 2026 - 2036
- Figure 62: Brazil Ophthalmic Drugs Revenue ($ Million): 2026 - 2036
- Figure 63: Canada Ophthalmic Drugs Revenue ($ Million): 2026 - 2036
- Figure 64: China Ophthalmic Drugs Revenue ($ Million): 2026 - 2036
- Figure 65: Egypt Ophthalmic Drugs Revenue ($ Million): 2026 - 2036
- Figure 66: France Ophthalmic Drugs Revenue ($ Million): 2026 - 2036
- Figure 67: Germany Ophthalmic Drugs Revenue ($ Million): 2026 - 2036
- Figure 68: Greece Ophthalmic Drugs Revenue ($ Million): 2026 - 2036
- Figure 69: India Ophthalmic Drugs Revenue ($ Million): 2026 - 2036
- Figure 70: Israel Ophthalmic Drugs Revenue ($ Million): 2026 - 2036
- Figure 71: Italy Ophthalmic Drugs Revenue ($ Million): 2026 - 2036
- Figure 72: Japan Ophthalmic Drugs Revenue ($ Million): 2026 - 2036
- Figure 73: Mexico Ophthalmic Drugs Revenue ($ Million): 2026 - 2036
- Figure 74: Netherlands Ophthalmic Drugs Revenue ($ Million): 2026 - 2036
- Figure 75: Poland Ophthalmic Drugs Revenue ($ Million): 2026 - 2036
- Figure 76: Portugal Ophthalmic Drugs Revenue ($ Million): 2026 - 2036
- Figure 77: Russia Ophthalmic Drugs Revenue ($ Million): 2026 - 2036
- Figure 78: Saudi Arabia Ophthalmic Drugs Revenue ($ Million): 2026 - 2036
- Figure 79: South Africa Ophthalmic Drugs Revenue ($ Million): 2026 - 2036
- Figure 80: South Korea Ophthalmic Drugs Revenue ($ Million): 2026 - 2036
- Figure 81: Spain Ophthalmic Drugs Revenue ($ Million): 2026 - 2036
- Figure 82: Switzerland Ophthalmic Drugs Revenue ($ Million): 2026 - 2036
- Figure 83: Taiwan Ophthalmic Drugs Revenue ($ Million): 2026 - 2036
- Figure 84: Turkey Ophthalmic Drugs Revenue ($ Million): 2026 - 2036
- Figure 85: UK Ophthalmic Drugs Revenue ($ Million): 2026 - 2036
- Figure 86: USA Ophthalmic Drugs Revenue ($ Million): 2026 - 2036
 眼科藥物市場-全球產業規模、佔有率、趨勢、機會和預測:按藥物類別、適應症、產品類型、劑型、給藥途徑、分銷管道、地區和競爭格局分類,2021-2031年
 全球視網膜設備市場(2026):2025年至2031年市場分析
 眼科藥品市場:2026-2032年全球市場預測(依產品類型、藥物類別、給藥途徑、治療領域、病患群體、最終使用者和通路分類)
 眼科藥品市場報告:按類型、藥物類別、適應症、劑型、分銷管道和地區分類(2026-2034 年)
 地氟潑尼酯市場:按產品類型、應用、分銷管道和地區分類眼科藥物市場:依適應症、類型、劑型、通路、治療分類及地區分類。
 獸用眼科藥品市場規模、佔有率和趨勢分析報告:按動物種類、藥物、適應症、分銷管道、地區和細分市場分類(2026-2033 年)肢端皮膚炎治療市場:依治療方法、診斷技術、最終用戶、通路,全球預測,2026-2032年
 全球眼科藥品市場按劑型、治療領域、應用、給藥途徑、國家及地區分類-產業分析、市場規模、市佔率及2025-2032年預測淚囊炎市場-全球產業規模、佔有率、趨勢、機會、預測:按適應症、通路、地區和競爭格局分類,2021-2031年