


 |
市場調查報告書
商品編碼
2112602
微型生物反應器市場:按生物反應器容量、細胞培養類型、運作方法、生物反應器類型、最終用戶、運作規模和地區分類的趨勢和預測(至2035年)Mini Bioreactors Market By Capacity of Bioreactor, Type of Cell Culture, Mode of Operation, Type of Bioreactor, End User, Scale of Operation and Geographical Regions - Trends and Forecast Till 2035 |
||||||

微型生物反應器市場概覽
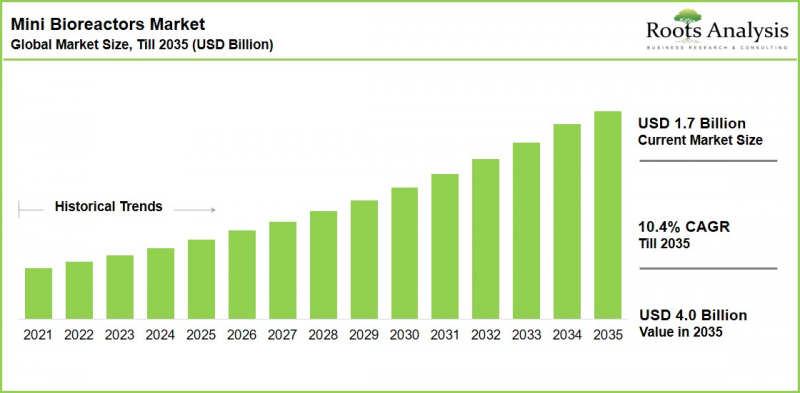
全球微型生物反應器市場預計將從今年的 17 億美元成長到 2035 年的 40 億美元,在整個預測期內實現 10.4% 的複合年成長率。
微型生物反應器市場-成長與趨勢
微型生物反應器是一種緊湊的桌上型發酵和細胞培養系統,其運作體積通常小於250 mL。這些生物反應器透過感測器控制pH值、溫度、溶氧量和攪拌等參數。它們能夠模擬生產規模的條件,同時顯著減少安裝面積、成本和試劑消耗,因此是篩檢研究、培養基和製程最佳化以及生物製藥(如單株抗體、重組蛋白、疫苗和病毒載體)早期開發的基礎。
該領域正經歷三大發展趨勢:一次性培養容器的日益普及、自動化和即時分析技術的進一步融合,以及研究機構和合約研發生產機構(CDMO)高通量平台的廣泛應用。這些趨勢的結合,使得研發人員篩檢更多製程變量,同時最大限度地減少昂貴培養基、細胞和試劑的消耗,從而縮短從實驗室到臨床的轉化路徑。
隨著生物製藥創新者繼續優先考慮靈活、永續和數據驅動的生產,預計小型和微型生物反應器平台將在全球研發實驗室、學術機構和合約開發組織中得到更廣泛的應用,進一步加強其作為現代生物製程開發基礎工具的作用。
成長驅動力:支持市場擴張的因素
- 對更快生物製程的需求:微型生物反應器能夠實現培養過程的並行化,顯著縮短菌株篩檢、培養基最佳化和製程條件測試等任務所需的時間。這縮短了整個生物製藥研發團隊的開發週期。
- 製程開發中的成本效益:由於這些平台以小規模運行,與傳統的桌上型系統相比,它們可以降低試劑、培養基和人事費用,這使得它們成為研發預算有限的中小型生物技術公司和 CDMO 特別有吸引力的選擇。
- 平台創新穩步推進:緊湊型、分散式一次性平台和能夠按需生產培養基和緩衝液的艙式密封系統等新產品的持續部署,正在推動供應商在自動化、連接性和靈活製造形式方面的投資。
市場挑戰:阻礙進展的主要障礙
- 可擴展性和放大限制:微型系統和工業規模系統在攪拌動力學、氧氣傳遞和剪切條件方面的差異意味著,針對小規模系統最佳化的程式參數通常需要在放大過程中重新檢驗,這使得從研發到商業生產的過渡變得複雜。
- 前期投資高且成本敏感:先進的全自動微型生物反應器系統前期成本高昂,這可能會限制其在小規模研究實驗室和對價格敏感的學術機構中的應用。此外,操作自動化平台所需的專業人員也會增加整體擁有成本 (TCO)。
微型生物反應器市場—關鍵洞察
本報告分析了微型生物反應器市場的現狀和未來,並指出了該行業內的成長機會。主要發現包括:
- 活躍的新產品平臺:近期推出的產品包括緊湊型自動化一次性平台和艙式封閉式系統,可實現培養基和緩衝液的按需製備。例如,Nucleus Biologics公司於2月推出了Krakatoa® K500,這是一款整合了自動化、分析功能和數位化批次記錄的艙式封閉系統,能夠按需製備35至500公升培養基和緩衝液。這些新產品的推出表明,供應商正在競相將小型化與生產級自動化結合。
- 策略聯盟與夥伴關係:領先的生命科學儀器公司正透過與專業的生物反應器創新者建立策略聯盟來拓展業務,而不是自行建立所有能力,這表明圍繞差異化自動化能力的整合已進入早期階段。例如,2025年8月,Cytiva擴大了與Culture Biosciences的合作,共同在全球獨家商業化Stratyx™ 250雲連接生物反應器平台,並共同開發其他類型的生物反應器。
- 需求主要集中在早期研發階段:藥物發現和臨床階段的生物製藥公司佔當前需求的近85%,這表明小型生物反應器更多地被定位為上游工程中商業化前的製程開發工具,而非生產規模的設備。這意味著大部分已安裝的產能用於克隆和培養篩檢等任務,這些任務是在首批符合GMP標準的分子生產之前進行的,因此,單位需求往往與正在進行的臨床前和I/II期生物製藥項目的數量相關。
- 未來展望:隨著技術的成熟,全自動系統的長期放大保真度、跨平台可重複性以及總體擁有成本等數據,對於投資者和用戶而言仍將是至關重要的考慮因素。小規模反應器和生產規模生物反應器在混合動力學、氧氣傳輸和剪切應力方面的差異,通常需要在放大過程中進行製程重新最佳化。因此,已發表的放大相關性數據和多中心可重複性研究仍將是衡量平台可靠性的重要指標。
微型生物反應器市場細分
市場規模和機會分析是根據以下參數進行細分的:
生物反應器(以容量計)
- 10毫升或更少
- 10 mL~50 mL
- 50 mL~250 mL
細胞培養類型
- 哺乳動物培養
- 微生物培養
- 病毒培養
- 昆蟲培養
- 其他
透過運作方法
- 批次/進料批量模式
- 連續模式
生物反應器類型
- 免洗生物反應器
- 不銹鋼生物反應器
- 玻璃生物反應器
最終用戶
- 生物製藥公司
- 學術機構/研究機構
按營運規模
- 生物製藥公司在藥物發現和臨床試驗中
- 處於商業化階段的生物製藥公司
按地區
- 北美洲
- 美國
- 加拿大
- 墨西哥
- 歐洲
- 德國
- 法國
- 英國
- 義大利
- 西班牙
- 其他歐洲國家
- 亞太地區
- 中國
- 日本
- 印度
- 韓國
- 亞太其他地區
- 中東和北非
- 沙烏地阿拉伯
- 阿拉伯聯合大公國
- 中東和北非其他地區
- 拉丁美洲
- 巴西
- 阿根廷
- 其他拉丁美洲
目錄
第1章 背景
第2章:調查方法
第3章 經濟及其他項目特定考量因素
第4章 宏觀經濟指標
第5章摘要整理
第6章:引言
第7章 市場狀況:小型生物反應器
第8章:產品競爭力分析
第9章:公司簡介
- 章節概要
- Bionet
- Biosan
- Cytiva
- Distek
- Eppendorf
- Merck Millipore
- Pall Corporation
- Sartorius
第10章 市場趨勢
第11章案例研究:拋棄式生物反應器
第12章 市場影響分析:促進因素、阻礙因素、機會與挑戰
第13章:小型生物反應器的全球市場
第14章:小型生物反應器市場(以生物反應器容量分類)
第15章:微型生物反應器市場(依細胞培養類型分類)
第16章:小型生物反應器市場(依運作方法分類)
第17章:小型生物反應器市場(依生物反應器類型分類)
第18章:小型生物反應器市場(以最終用戶分類)
第19章:小型生物反應器市場(按地區分類)
第20章:小型生物反應器市場(以主要公司分類)
第21章:高階主管洞察
第22章附錄1:表格形式數據
第23章 附錄2:公司與組織列表
MINI BIOREACTORS MARKET: OVERVIEW
As per Roots Analysis, the global mini bioreactors market is estimated to grow from USD 1.7 billion in the current year to USD 4.0 billion by 2035, registering a CAGR of 10.4% across the forecast period.
Mini Bioreactors Market: Growth and Trends
Mini bioreactors are compact, benchtop fermentation and cell-culture systems, typically operating at working volumes below 250 mL. These bioreactors are built around sensor-driven parameters such as pH, temperature, dissolved oxygen, and agitation. By recreating production-scale conditions at a fraction of the footprint, cost, and reagent consumption, these systems have become a cornerstone for screening studies, media and process optimization, and early-phase development of biologics, including monoclonal antibodies, recombinant proteins, vaccines, and viral vectors.
The domain is evolving through three key trends, increasing adoption of single-use culture vessels, greater integration of automation and real-time analytics, and wider use of high-throughput platforms by research institutes and contract development and manufacturing organizations (CDMOs). Collectively, these trends allow developers to screen a larger number of process variables in parallel while minimizing consumption of costly media, cells, and reagents, shortening the path from bench to clinic.
As biopharmaceutical innovators continue to prioritize flexible, sustainable, and data-driven manufacturing, mini and micro-scale bioreactor platforms are expected to see broadening uptake across R&D laboratories, academic institutions, and outsourced development organizations worldwide, reinforcing their role as a foundational tool in modern bioprocess development.
Growth Drivers: Factors Fueling Market Expansion
- Need for Accelerated Bioprocessing: Mini bioreactors support parallelized cultivation runs, materially compressing the time needed for tasks such as strain screening, media optimization, and process-condition testing, which shortens overall development timelines for biopharmaceutical R&D teams.
- Cost-Efficiency in Process Development: Low-volume operation reduces reagent, media, and labor costs relative to conventional bench-top systems, making these platforms particularly attractive to small and mid-sized biotech companies and CDMOs operating under constrained R&D budgets.
- Steady Pace of Platform Innovation: Continued new product activity including compact, decentralized single-use platforms and pod-based, closed systems capable of on-demand media and buffer production signals sustained supplier investment in automation, connectivity, and flexible manufacturing formats.
Market Challenges: Critical Barriers Hindering Progress
- Scalability and Scale-Up Limitations: Differences in mixing dynamics, oxygen transfer, and shear conditions between mini-scale and industrial-scale systems mean that process parameters optimized at small scale often require re-validation during scale-up, complicating the transition from R&D to commercial manufacturing.
- High Initial Investment and Cost Sensitivity: Advanced, fully automated mini bioreactor systems carry a high upfront cost, which can restrict adoption among smaller research labs and price-sensitive academic institutions. Meanwhile, the specialized personnel needed to operate automated platforms add to total cost of ownership.
Mini Bioreactors Market: Key Insights
The report examines the current and future state of the mini bioreactors market and highlights the growth opportunities within the industry. Select findings include:
- Active New-Product Pipeline: Recent product launches include compact automated single-use platforms and pod-based closed systems for on-demand media and buffer generation. For instance, in February, Nucleus Biologics launched the Krakatoa(R) K500, a pod-based, closed system capable of producing 35-500 litres of media and buffers on demand with integrated automation, analytics, and digital batch records. Such launches illustrate how suppliers are racing to combine miniaturization with manufacturing-grade automation.
- Strategic Collaborations and Partnerships: Life science tool majors are extending their footprint through strategic collaborations with specialized bioreactor innovators rather than building every capability in-house, indicating early-stage consolidation around differentiated automation ability. For instance, Cytiva expanded its collaboration with Culture Biosciences in August 2025 to take on exclusive global commercialization of the Stratyx(TM) 250 cloud-connected bioreactor platform and to jointly develop additional bioreactor formats.
- Demand Concentrated in Early-Stage Development: Discovery and clinical-stage biopharmaceutical companies account for close to 85% of current demand, underscoring the position of mini bioreactors as an upstream, pre-commercial process-development tool rather than a manufacturing-scale asset. This means the bulk of installed capacity is used for tasks such as clone and media screening ahead of a molecule's first GMP batch, so unit demand tends to track the number of active pre-clinical and Phase I/II biologics programs.
- Future Opportunities: Long-term data on scale-up fidelity, cross-platform reproducibility, and total cost of ownership for fully automated systems will remain an important factor for investors and adopters to track as the technology matures. Differences in mixing dynamics, oxygen transfer, and shear stress between small-scale and production-scale bioreactors often require process re-optimization during scale-up. Therefore, published scale-up correlation data and multi-site reproducibility studies remain key indicators of platform reliability.
Mini Bioreactors Market Segments
The market sizing and opportunity analysis has been segmented across the following parameters:
By Capacity of Bioreactor
- Up to 10 mL
- 10 mL - 50 mL
- 50 mL - 250 mL
By Type of Cell Culture
- Mammalian Culture
- Microbial Culture
- Viral Culture
- Insect Culture
- Other Cultures
By Mode of Operation
- Batch / Fed-batch Mode
- Continuous Mode
By Type of Bioreactor
- Single-Use Bioreactors
- Stainless-Steel Bioreactors
- Glass Bioreactors
By End User
- Biopharmaceutical Companies
- Academic / Research Institutes
By Scale of Operation
- Discovery and Clinical-Stage Biopharmaceutical Companies
- Commercial-Stage Biopharmaceutical Companies
By Geographical Regions
- North America
- US
- Canada
- Mexico
- Europe
- Germany
- France
- UK
- Italy
- Spain
- Rest of Europe
- Asia-Pacific
- China
- Japan
- India
- South Korea
- Rest of Asia-Pacific
- Middle East and North Africa
- Saudi Arabia
- UAE
- Rest of Middle East and North Africa
- Latin America
- Brazil
- Argentina
- Rest of Latin America
Mini Bioreactors Market: Key Segments
Batch and Fed-Batch Operation Leads the Market
Based on Roots Analysis market report, batch, and fed-batch operation together account for the majority of current market share. This highest growth is driven by their operational simplicity and broad compatibility with both microbial and mammalian workflows. Fed-batch culture supports controlled nutrient feeding, enabling higher cell densities and product titers while reducing nutrient depletion and toxic metabolite accumulation. As the predominant manufacturing mode for commercial monoclonal antibodies and recombinant proteins, fed-batch processes are typically optimized and validated in mini bioreactors before scale-up, driving demand for these systems during process development.
Continuous mode is expected to register faster CAGR during the forecast period as biopharmaceutical companies increasingly pursue process intensification and manufacturing efficiency. Further, continuous mode supports sustained cell growth and uninterrupted product harvest, improving volumetric productivity and reducing downtime compared with batch processing. Consequently, developers are increasingly leveraging mini bioreactors to optimize and de-risk perfusion-based and other continuous manufacturing strategies before investing in commercial-scale continuous production lines.
.
Single-Use Systems Hold the Highest Share
According to our market analysis, single-use systems capture the largest share of the market. This largest share is due to their lower capital intensity, reduced cross-contamination risk, and elimination of cleaning and sterilization validation cycles associated with reusable stainless-steel systems. By eliminating the clean-in-place (CIP) and steam-in-place (SIP) qualification requirements of stainless-steel systems, single-use mini bioreactors reduce turnaround time between experiments. This is especially beneficial in process development, where multiple parallel and back-to-back studies are routinely performed.
Suppliers such as Sartorius, Eppendorf, and Cytiva have built much of their recent mini bioreactor product activity, including Cytiva's Stratyx(TM) 250 platform, around disposable culture vessels for this reason.
This segment is also expected to grow at a higher CAGR during the forecast period. This unprecedented growth is supported by the continued expansion of biologics, biosimilars, and advanced-therapy pipelines. These drugs expansion further adds incremental screening and process-development demand that developers increasingly prefer to route through disposable, ready-to-use vessels rather than reusable glass or stainless-steel hardware.
Biopharmaceutical Companies Holds the Highest Share
Based on the Roots Analysis market report, biopharmaceutical companies represent the largest end user category. This dominance is largely due to their extensive use of mini bioreactors across biologics development, process optimization, cell-line screening, and scale-up studies.
Unlike academic and research institutes, which typically use a limited number of mini bioreactors for exploratory research and training, biopharmaceutical companies integrate these systems into structured process development workflows. Biopharmaceutical companies operate mini bioreactors continuously across multiple concurrent drug development programs, resulting in a significantly larger installed base and sustained demand for consumables.
Owing to the growing demand, this segment is expected to register higher CAGR during the forecast period. This growth is further supported by expanding biologics pipelines and rising investment in bioprocess innovation. Each new clinical-stage biologic or biosimilar candidate entering development requires a dedicated phase of cell line development and process optimization, driving sustained demand for mini bioreactor systems.
Discovery and Clinical-Stage Companies Lead the Scale of Operation
Based on the Roots Analysis market report, discovery and clinical-stage biopharmaceutical companies account for nearly 85% of global market share. This highest share reflects the primary role of mini bioreactors as process development tools used before commercial-scale manufacturing.
During discovery and early clinical development, each molecule undergoes multiple rounds of clone selection, media optimization, and process screening, driving repeated use of mini bioreactor systems.
Once the manufacturing process is optimized, locked, and validated for commercial production, these systems are rarely required for the same program. Consequently, market demand is largely driven by the continuous influx of new drug development programs entering the pipeline rather than by the expansion of commercial manufacturing capacity.
North America Dominates the Mini Bioreactors Market
North America currently dominates the market and is likely to remain dominant in the future. This dominance is underpinned by an established biopharmaceutical industry, deep research infrastructure, and high levels of biotechnology investment. The region's concentration of biopharma companies, CDMOs, and academic research institutions, along with favorable government funding for biotechnology research, continues to support early and sustained adoption of high-throughput bioprocessing platforms.
Asia-Pacific is Emerging as Fastest Growing Region
Asia-Pacific is expected to register the highest CAGR through the forecast period. This lucrative growth is driven by expanding biopharmaceutical manufacturing capacity in China, India, Japan, and South Korea, rising biotechnology R&D investment, and growing outsourcing of biomanufacturing activity to the region. Further, the expanding government support for biotechnology innovation and growing cell and gene therapy research are expected to further accelerate regional adoption.
Example Players in Mini Bioreactors Market
- Biosan
- Bionet
- Cytiva
- Distek
- Eppendorf
- Merck Millipore
- Pall Corporation
- Sartorius
Expert Interview and Industry Insights
The opinions and insights presented in this study were shaped by discussions with multiple stakeholders across the value chain. The research report features detailed transcripts of interviews held with the following industry participants:
- Co-Founder, Small Company, US
- Chief Executive Officer and Co-founder, Mid-sized Company, Germany
- Chief Executive Officer, Small Company, US
- Chief Executive Officer, Mid-sized Company, UK
- Director of Cell Line Development and Bioprocess Development, Small Company, Germany
- Director, Mid-sized Company, US
- Head of Business Operations, Large Company, Germany
- Head of Bioprocess Applications, Very Large Company, Denmark
- Product Life Cycle Manager, Very Large Company, Denmark
MINI BIOREACTORS MARKET: RESEARCH COVERAGE
- Market Sizing and Opportunity Analysis: The report features an in-depth analysis of the mini bioreactors market, focusing on key segments including capacity of bioreactor, type of cell culture, mode of operation, type of bioreactor, end user, scale of operation, and geographical regions.
- Mini Bioreactors Market Landscape: A detailed assessment of the overall mini bioreactors market landscape, including analysis of product offerings by capacity, cell culture compatibility, mode of operation, and manufacturer attributes such as year of establishment, company size, and location of headquarters.
- Company Profiles: In-depth profiles of prominent players engaged in offering mini bioreactor systems, featuring information on year of establishment, headquarters, company size, product portfolio, and key strategic initiatives.
- Patent Analysis: An analysis of patents filed and granted related to mini bioreactor technologies, based on parameters such as patent type, application and publication year, jurisdiction, CPC symbols, applicant type, and patent benchmarking and valuation.
- Case Study: A detailed case study of the mini bioreactors market, featuring an analysis of commercially available products across key technical and application-based parameters, along with a comprehensive assessment of developer competitiveness based on company characteristics, geographic presence, and product portfolios, highlighting the current market landscape and emerging industry trends.
- Market Impact Analysis: An analysis of the drivers, restraints, opportunities, and challenges expected to shape the future trajectory of the mini bioreactors market.
Key Questions Answered in this Report
- Which are the leading companies in the mini bioreactors market?
- Which region dominates the mini bioreactors market, and which region is growing fastest?
- What are the key trends observed in the mini bioreactors market?
- What factors are likely to influence the evolution of this market?
- What are the primary challenges faced by mini bioreactor developers and adopters?
- What is the current and future size of the mini bioreactors market?
- What is the CAGR of the mini bioreactors market through 2035?
- How is current and future market opportunity distributed across capacity, cell culture type, mode of operation, bioreactor type, end user, and scale of operation?
Reasons to Buy this Report
This report is designed to give distributors, channel partners, and investors a decisive analytical edge in a fast-consolidating market. Its core differentiators include:
- The report provides a comprehensive market analysis with detailed revenue projections for the overall market and its sub-segments, valuable to both established leaders and emerging entrants.
- It offers stakeholders a complete view of key drivers, barriers, opportunities, and challenges, enabling data-driven decisions to capitalize on growth prospects.
- It helps businesses identify future opportunities across sub-segments and geographies and assess whether those opportunities are worth pursuing.
- It supports understanding of end user needs, preferences, and behavior, helping tailor products and services more effectively.
- It equips new entrants with the market intelligence needed to build sound go-to-market and business strategies.
- It supports more informed, evidence-backed conversations with investors, partners, and other stakeholders.
Additional Benefits
- Complementary PPT Insights Pack
- Complementary Excel Data Packs for all Analytical Modules in the Report
- 15% Free Content Customization
- Detailed Report Walkthrough Session with Research Team
- Free Updated report if the report is 6-12 months old or older
TABLE OF CONTENTS
1. BACKGROUND
- 1.1. Context
- 1.2. Project Objectives
2. RESEARCH METHODOLOGY
- 2.1. Chapter Overview
- 2.2. Research Assumptions
- 2.2.1. Market Landscape and Market Trends
- 2.2.2. Market Forecast and Opportunity Analysis
- 2.2.3. Comparative Analysis
- 2.3. Database Building
- 2.3.1. Data Collection
- 2.3.2. Data Validation
- 2.3.3. Data Analysis
- 2.4. Project Methodology
- 2.4.1. Secondary Research
- 2.4.1.1. Annual Reports
- 2.4.1.2. Academic Research Papers
- 2.4.1.3. Company Websites
- 2.4.1.4. Investor Presentations
- 2.4.1.5. Regulatory Filings
- 2.4.1.6. White Papers
- 2.4.1.7. Industry Publications
- 2.4.1.8. Conferences and Seminars
- 2.4.1.9. Government Portals
- 2.4.1.10. Media and Press Releases
- 2.4.1.11. Newsletters
- 2.4.1.12. Industry Databases
- 2.4.1.13. Roots Proprietary Databases
- 2.4.1.14. Paid Databases and Sources
- 2.4.1.15. Social Media Portals
- 2.4.1.16. Other Secondary Sources
- 2.4.2. Primary Research
- 2.4.2.1. Types of Primary Research
- 2.4.2.1.1. Qualitative Research
- 2.4.2.1.2. Quantitative Research
- 2.4.2.1.3. Hybrid Approach
- 2.4.2.2. Advantages of Primary Research
- 2.4.2.3. Techniques for Primary Research
- 2.4.2.3.1. Interviews
- 2.4.2.3.2. Surveys
- 2.4.2.3.3. Focus Groups
- 2.4.2.3.4. Observational Research
- 2.4.2.3.5. Social Media Interactions
- 2.4.2.4. Key Opinion Leaders Considered in Primary Research
- 2.4.2.4.1. Company Executives (CXOs)
- 2.4.2.4.2. Board of Directors
- 2.4.2.4.3. Company Presidents and Vice Presidents
- 2.4.2.4.4. Research and Development Heads
- 2.4.2.4.5. Technical Experts
- 2.4.2.4.6. Subject Matter Experts
- 2.4.2.4.7. Scientists
- 2.4.2.4.8. Doctors and Other Healthcare Providers
- 2.4.2.5. Ethics and Integrity
- 2.4.2.5.1. Research Ethics
- 2.4.2.5.2. Data Integrity
- 2.4.2.1. Types of Primary Research
- 2.4.3. Analytical Tools and Databases
- 2.4.1. Secondary Research
- 2.5. Robust Quality Control
3. ECONOMIC AND OTHER PROJECT-SPECIFIC CONSIDERATIONS
- 3.1. Chapter Overview
- 3.2. Forecast Methodology
- 3.2.1. Top-down Approach
- 3.2.2. Bottom-up Approach
- 3.2.3. Hybrid Approach
- 3.3. Market Assessment Framework
- 3.3.1. Total Addressable Market (TAM)
- 3.3.2. Serviceable Addressable Market (SAM)
- 3.3.3. Serviceable Obtainable Market (SOM)
- 3.3.4. Currently Acquired Market (CAM)
- 3.4. Forecasting Tools and Techniques
- 3.4.1. Qualitative Forecasting
- 3.4.2. Correlation
- 3.4.3. Regression
- 3.4.4. Extrapolation
- 3.4.5. Convergence
- 3.4.6. Sensitivity Analysis
- 3.4.7. Scenario Planning
- 3.4.8. Data Visualization
- 3.4.9. Time Series Analysis
- 3.4.10. Forecast Error Analysis
- 3.5. Key Considerations
- 3.5.1. Demographics
- 3.5.2. Government Regulations
- 3.5.3. Reimbursement Scenarios
- 3.5.4. Market Access
- 3.5.5. Supply Chain
- 3.5.6. Industry Consolidation
- 3.5.7. Pandemic / Unforeseen Disruptions Impact
- 3.6. Limitations
4. MACRO-ECONOMIC INDICATORS
- 4.1. Chapter Overview
- 4.2. Market Dynamics
- 4.2.1. Time Period
- 4.2.1.1. Historical Trends
- 4.2.1.2. Current and Forecasted Estimates
- 4.2.2. Currency Coverage
- 4.2.2.1. Major Currencies Affecting the Market
- 4.2.2.2. Factors Affecting Currency Fluctuations
- 4.2.2.3. Impact of Currency Fluctuations on the Industry
- 4.2.3. Foreign Currency Exchange Rate
- 4.2.3.1. Impact of Foreign Exchange Rate Volatility on the Market
- 4.2.3.2. Strategies for Mitigating Foreign Exchange Risk
- 4.2.4. Recession
- 4.2.4.1. Assessment of Current Economic Conditions and Potential Impact on the Market
- 4.2.4.2. Historical Analysis of Past Recessions and Lessons Learnt
- 4.2.5. Inflation
- 4.2.5.1. Measurement and Analysis of Inflationary Pressures in the Economy
- 4.2.5.2. Potential Impact of Inflation on the Market Evolution
- 4.2.6. Interest Rates
- 4.2.6.1. Interest Rates and Their Impact on the Market
- 4.2.6.2. Strategies for Managing Interest Rate Risk
- 4.2.7. Commodity Flow Analysis
- 4.2.7.1. Type of Commodity
- 4.2.7.2. Origins and Destinations
- 4.2.7.3. Values and Weights
- 4.2.7.4. Modes of Transportation
- 4.2.8. Global Trade Dynamics
- 4.2.8.1. Import Scenario
- 4.2.8.2. Export Scenario
- 4.2.8.3. Trade Policies
- 4.2.8.4. Strategies for Mitigating the Risks Associated with Trade Barriers
- 4.2.8.5. Impact of Trade Barriers on the Market
- 4.2.9. War Impact Analysis
- 4.2.9.1. Russian-Ukraine War
- 4.2.9.2. Israel-Hamas War
- 4.2.10. COVID Impact / Related Factors
- 4.2.10.1. Global Economic Impact
- 4.2.10.2. Industry-specific Impact
- 4.2.10.3. Government Response and Stimulus Measures
- 4.2.10.4. Future Outlook and Adaptation Strategies
- 4.2.11. Other Indicators
- 4.2.11.1. Fiscal Policy
- 4.2.11.2. Consumer Spending
- 4.2.11.3. Gross Domestic Product (GDP)
- 4.2.11.4. Employment
- 4.2.11.5. Taxes
- 4.2.11.6. Stock Market Performance
- 4.2.11.7. Cross-Border Dynamics
- 4.2.1. Time Period
- 4.3. Conclusion
5. EXECUTIVE SUMMARY
6. INTRODUCTION
- 6.1. Chapter Overview
- 6.2. Overview of Mini Bioreactors
- 6.2.1. Types of Mini Bioreactors
- 6.3. Advantages of Mini Bioreactors
- 6.4. Fabrication Materials for Small Scale Bioreactors
- 6.5. Future Perspectives
7. MARKET LANDSCAPE: MINI BIOREACTORS
- 7.1. Chapter Overview
- 7.2. Small Scale Bioreactors: Overall Market Landscape
- 7.2.1. Analysis by Product Characteristics
- 7.2.2. Analysis by Mode of Operation
- 7.2.3. Analysis by Type of Cell Culture
- 7.2.4. Analysis by Type of Bioreactor
- 7.2.5. Analysis by Type of Fabrication Material
- 7.2.6. Analysis by Scale of Operation
- 7.2.7. Analysis by Application Area
- 7.2.8. Analysis by Type of Process Development
- 7.2.9. Analysis by End User
- 7.2.10. Analysis by Total Volume
- 7.3. Small Scale Bioreactors Manufacturers: List of Developers
- 7.3.1. Analysis by Year of Establishment
- 7.3.2. Analysis by Company Size
- 7.3.3. Analysis by Year of Establishment and Company Size
- 7.3.4. Analysis by Location of Headquarters
- 7.3.5. Leading Manufacturers: Analysis by Number of Products
8. PRODUCT COMPETITIVENESS ANALYSIS
- 8.1. Chapter Overview
- 8.2. Assumptions and Key Parameters
- 8.3. Methodology
- 8.4. Product Competitiveness Analysis: Mini Bioreactors
- 8.4.1. Mini Bioreactors Offered by Players based in North America
- 8.4.2. Mini Bioreactors Offered by Players based in Europe
- 8.4.3. Mini Bioreactors Offered by Players based in Asia-Pacific
9. COMPANY PROFILES
- 9.1. Chapter Overview
- 9.2. Bionet
- 9.2.1. Company Overview
- 9.2.2. Product Portfolio
- 9.2.3. Recent Developments and Future Outlook
- 9.3. Biosan
- 9.4. Cytiva
- 9.5. Distek
- 9.6. Eppendorf
- 9.7. Merck Millipore
- 9.8. Pall Corporation
- 9.9. Sartorius
10. MARKET TRENDS
- 10.1. Chapter Overview
- 10.2. Scope and Methodology
- 10.3. Small Scale Bioreactors: Patent Analysis
- 10.3.1. Analysis by Patent Publication Year
- 10.3.2. Analysis by Type of Patent and Publication Year
- 10.3.3. Analysis by Patent Application Year
- 10.3.4. Analysis by Patent Jurisdiction
- 10.3.5. Analysis by CPC Symbols
- 10.3.6. Analysis by Type of Applicant
- 10.3.7. Leading Industry Players: Analysis by Number of Patents
- 10.3.8. Leading Non-Industry Players: Analysis by Number of Patents
- 10.4. Patent Benchmarking Analysis
- 10.4.1. Analysis by Patent Characteristics
- 10.5. Patent Valuation
- 10.6. Leading Patents by Number of Citations
11. CASE STUDY: SINGLE USE BIOREACTORS
- 11.1. Chapter Overview
- 11.2. Single Use Bioreactors: List of Products
- 11.2.1. Analysis by Type of Bioreactor
- 11.2.2. Analysis by Scale of Operation
- 11.2.3. Analysis by Type of Cell Culture System
- 11.2.4. Analysis by Type of Cell Culture
- 11.2.5. Analysis by Type of Molecule Processed
- 11.2.6. Analysis by Key Features
- 11.2.7. Analysis by Application Area
- 11.2.8. Analysis by End Users
- 11.2.9. Analysis by Working Volume
- 11.3. Single Use Bioreactor Developers: Overall Market Landscape
- 11.3.1. Analysis by Year of Establishment
- 11.3.2. Analysis by Company Size
- 11.3.3. Analysis by Location of Headquarters
- 11.3.4. Leading Developers: Analysis by Number of Single Use Bioreactors
12. MARKET IMPACT ANALYSIS: DRIVERS, RESTRAINTS, OPPORTUNITIES AND CHALLENGES
- 12.1. Chapter Overview
- 12.2. Market Drivers
- 12.3. Market Restraints
- 12.4. Market Opportunities
- 12.5. Market Challenges
13. GLOBAL MINI BIOREACTOR MARKET
- 13.1. Chapter Overview
- 13.2. Assumptions and Methodology
- 13.3. Global Mini Bioreactors Market, Historical Trends (Since 2021) and Forecasted Estimates (Till 2035)
- 13.3.1. Scenario Analysis
- 13.3.1.1. Conservative Scenario
- 13.3.1.2. Optimistic Scenario
- 13.3.1. Scenario Analysis
14. MINI BIOREACTORS MARKET, BY CAPACITY OF BIOREACTOR
- 14.1. Chapter Overview
- 14.2. Key Assumptions and Methodology
- 14.3. Mini Bioreactors Market: Distribution by Capacity of Bioreactor
- 14.3.1. Mini Bioreactors Market for Up to 10 mL, Historical Trends (Since 2021) and Forecasted Estimates (Till 2035)
- 14.3.2. Mini Bioreactors Market for 10 mL - 50 mL, Historical Trends (Since 2021) and Forecasted Estimates (Till 2035)
- 14.3.3. Mini Bioreactors Market for 50 mL - 250 mL, Historical Trends (Since 2021) and Forecasted Estimates (Till 2035)
- 14.4. Data Triangulation and Validation
15. MINI BIOREACTORS MARKET, BY TYPE OF CELL CULTURE
- 15.1. Chapter Overview
- 15.2. Key Assumptions and Methodology
- 15.3. Mini Bioreactors Market: Distribution by Type of Cell Culture
- 15.3.1. Mini Bioreactors Market for Mammalian Culture, Historical Trends (Since 2021) and Forecasted Estimates (Till 2035)
- 15.3.2. Mini Bioreactors Market for Microbial Culture, Historical Trends (Since 2021) and Forecasted Estimates (Till 2035)
- 15.3.3. Mini Bioreactors Market for Viral Culture, Historical Trends (Since 2021) and Forecasted Estimates (Till 2035)
- 15.3.4. Mini Bioreactors Market for Insect Culture, Historical Trends (Since 2021) and Forecasted Estimates (Till 2035)
- 15.3.5. Mini Bioreactors Market for Other Cultures, Historical Trends (Since 2021) and Forecasted Estimates (Till 2035)
- 15.4. Data Triangulation and Validation
16. MINI BIOREACTORS MARKET, BY MODE OF OPERATION
- 16.1. Chapter Overview
- 16.2. Key Assumptions and Methodology
- 16.3. Mini Bioreactors Market: Distribution by Mode of Operation
- 16.3.1. Mini Bioreactors Market for Batch / Fed-batch Mode, Historical Trends (Since 2021) and Forecasted Estimates (Till 2035)
- 16.3.2. Mini Bioreactors Market for Continuous Mode, Historical Trends (Since 2021) and Forecasted Estimates (Till 2035)
- 16.4. Data Triangulation and Validation
17. MINI BIOREACTORS MARKET, BY TYPE OF BIOREACTOR
- 17.1. Chapter Overview
- 17.2. Key Assumptions and Methodology
- 17.3. Mini Bioreactors Market: Distribution by Type of Bioreactor
- 17.3.1. Mini Bioreactors Market for Single Use Bioreactors, Historical Trends (Since 2021) and Forecasted Estimates (Till 2035)
- 17.3.2. Mini Bioreactors Market for Stainless Steel Bioreactors, Historical Trends (Since 2021) and Forecasted Estimates (Till 2035)
- 17.3.3. Mini Bioreactors Market for Glass Bioreactors, Historical Trends (Since 2021) and Forecasted Estimates (Till 2035)
- 17.4. Data Triangulation and Validation
18. MINI BIOREACTORS MARKET, BY END USER
- 18.1. Chapter Overview
- 18.2. Key Assumptions and Methodology
- 18.3. Mini Bioreactors Market: Distribution by End User
- 18.3.1. Mini Bioreactors Market for Biopharma Companies, Historical Trends (Since 2021) and Forecasted Estimates (Till 2035)
- 18.3.2. Mini Bioreactors Market for Academic / Research Institutes, Historical Trends (Since 2021) and Forecasted Estimates (Till 2035)
- 18.4. Data Triangulation and Validation
19. MINI BIOREACTORS MARKET, BY GEOGRAPHICAL REGIONS
- 19.1. Chapter Overview
- 19.2. Key Assumptions and Methodology
- 19.3. Mini Bioreactors Market: Distribution by Geographical Regions
- 19.3.1. Mini Bioreactors Market in North America, Historical Trends (Since 2021) and Forecasted Estimates (Till 2035)
- 19.3.2. Mini Bioreactors Market in Europe, Historical Trends (Since 2021) and Forecasted Estimates (Till 2035)
- 19.3.3. Mini Bioreactors Market in Asia-Pacific, Historical Trends (Since 2021) and Forecasted Estimates (Till 2035)
- 19.3.4. Mini Bioreactors Market in Middle East and North Africa, Historical Trends (Since 2021) and Forecasted Estimates (Till 2035)
- 19.3.5. Mini Bioreactors Market in Latin America, Historical Trends (Since 2021) and Forecasted Estimates (Till 2035)
- 19.4. Data Triangulation and Validation
20. MINI BIOREACTORS MARKET, BY KEY PLAYERS
- 20.1. Key Assumptions and Methodology
- 20.2. Mini Bioreactors Market: Distribution by Leading Players
- 20.2.1. Mini Bioreactors Market for Leading Player 1
- 20.2.2. Mini Bioreactors Market for Leading Player 2
- 20.2.3. Mini Bioreactors Market for Leading Player 3
- 20.2.4. Mini Bioreactors Market for Leading Player 4
- 20.2.5. Mini Bioreactors Market for Leading Player 5
- 20.2.6. Mini Bioreactors Market for Leading Player 6
- 20.3. Data Triangulation and Validation
21. EXECUTIVE INSIGHTS
22. APPENDIX 1: TABULATED DATA
23. APPENDIX 2: LIST OF COMPANIES AND ORGANIZATIONS

 全球一次性生物反應器市場:按產品、類型、分子類型、細胞類型、應用、處理模式、最終用戶和地區分類-預測至2031年
 一次性生物反應器市場-2026-2032年全球市場預測
 一次性生物反應器市場(第四版):產業趨勢及2035年全球預測:依生物反應器類型、運作規模、細胞培養類型、合成生物製藥類型、最終用戶及地區分類
 一次性生物反應器市場:市場洞察、競爭格局及市場預測(2034 年)
 一次性生物反應器市場報告:按產品類型、類別、細胞類型、分子類型、最終用戶和地區分類(2026-2034 年)一次性攪拌槽生物反應器市場(按產品類型、應用、最終用戶、操作模式、容量和所有權模式分類),全球預測,2026-2032年
 2026年全球一次性生物反應器市場報告
 一次性生物反應器市場分析及預測(至2035年):依類型、產品、技術、組件、應用、材質、最終用戶、製程及階段分類
 全球一次性生物反應器市場規模、佔有率、趨勢和成長分析報告(2026-2034)日本一次性生物反應器市場報告:按產品類型、類型、細胞類型、分子類型、最終用戶和地區分類(2026-2034年)